Week 7 State of charge estimation
1.Simulate the 3 test cases from harness dashboard and write a detailed report on the results
for testing the harness dashboard we have to download the project model
then we have to open the file
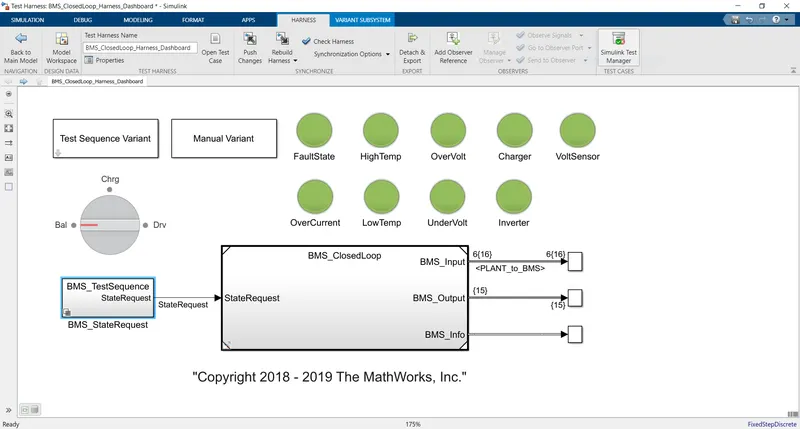
so in this first we have to click on the test sequence block and then we have to click on 1
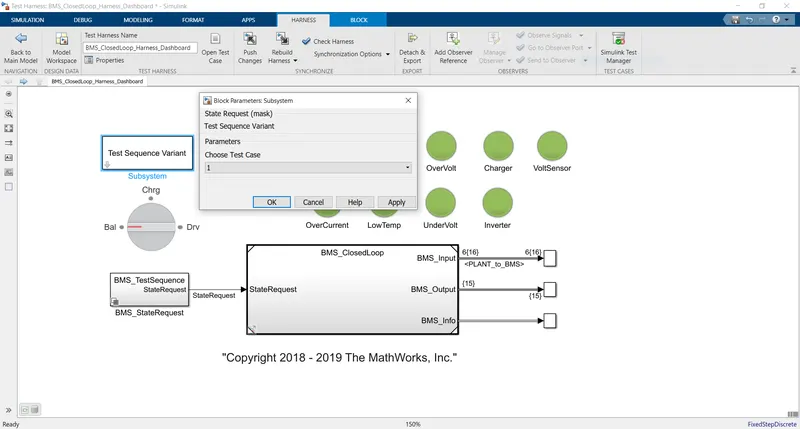
then click on ok then we can see by clicking on bms block the chart will open so that we can know that what is going to simulate
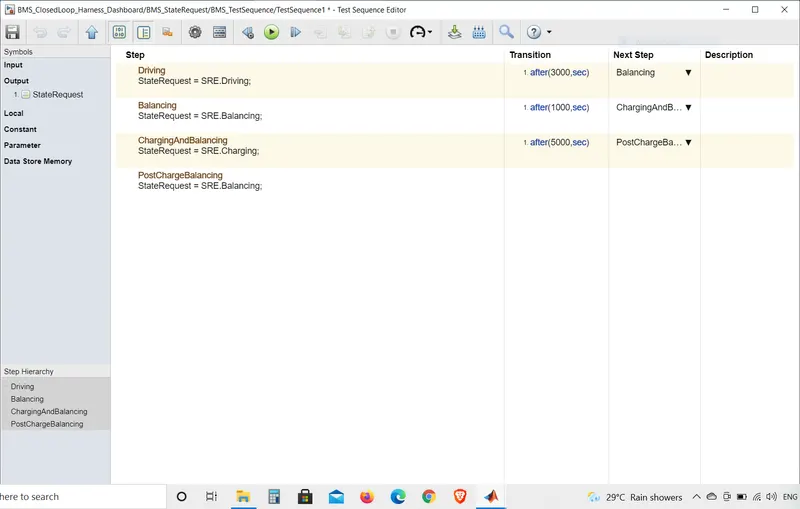
when the simulation starts we can see that the model will be in driving condition.after 3000 sec it will come to stand by condition and after 1000 sec it will be in charging condition
results:
here the indicators are in green colour do we can say that there are no errors.
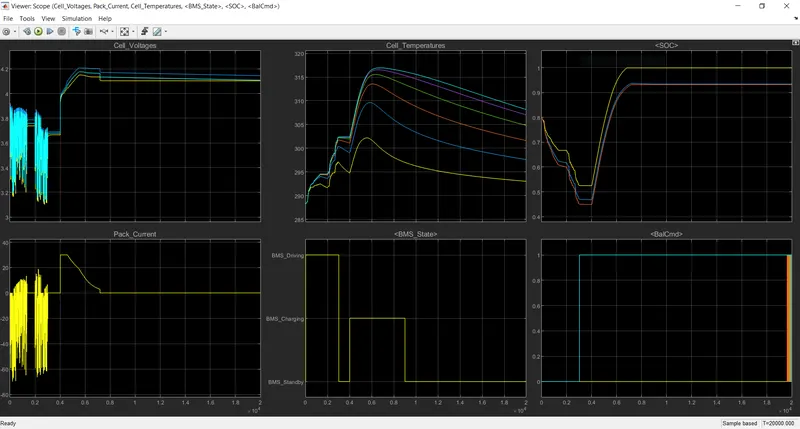
here from the above plot we can see that the vehicle is in driving stage and charged up to 90%.
and then it reaches to standby mode which can be seen in bms plot.
current plot shows the current supplied to vehicle while driving .
soc decreased up to 50% while in driving condition.
(2) now for the second test
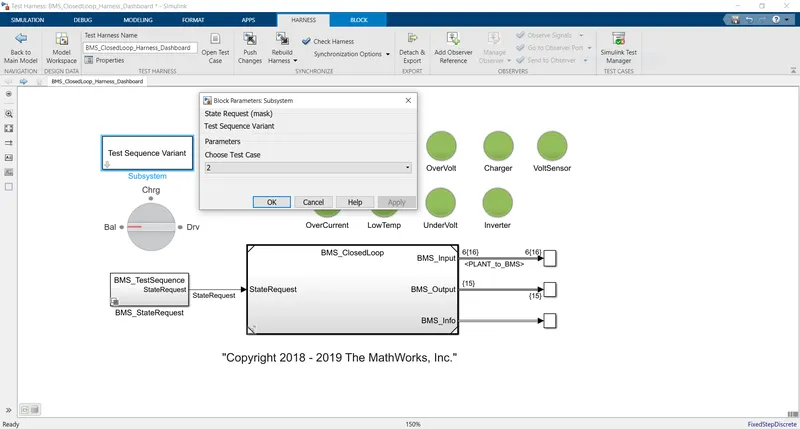
now by clicking on bms block changing to 2
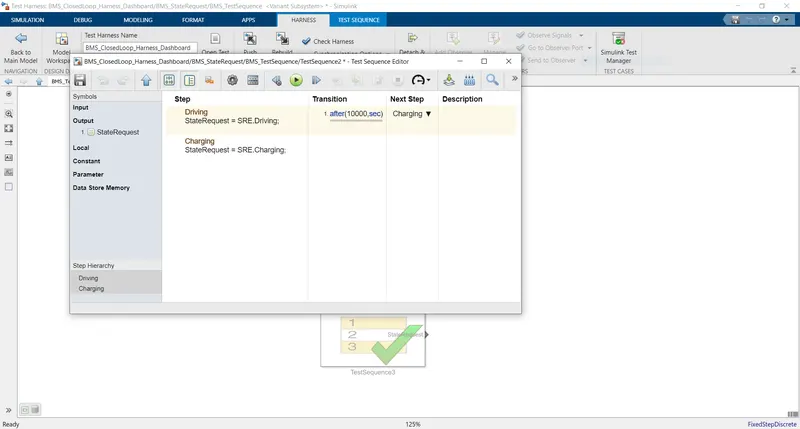
the driving stage is for 0 to 10000sec
next is charging stage.
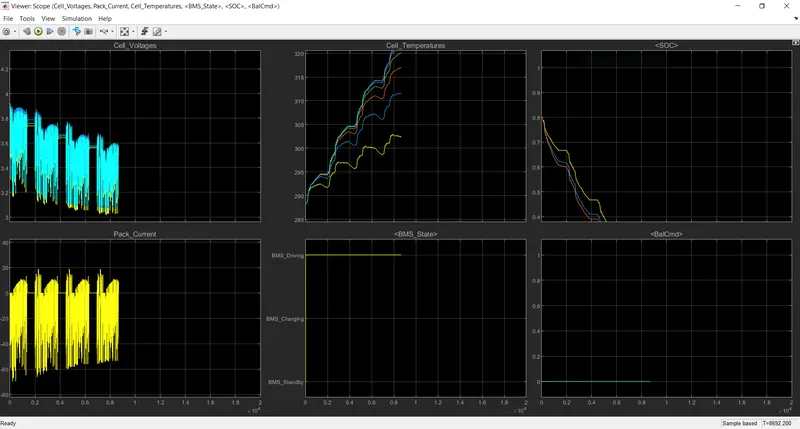
in this plot we can see that soc is not increased it continued to decrease.
(3) changing the sequence value to 3
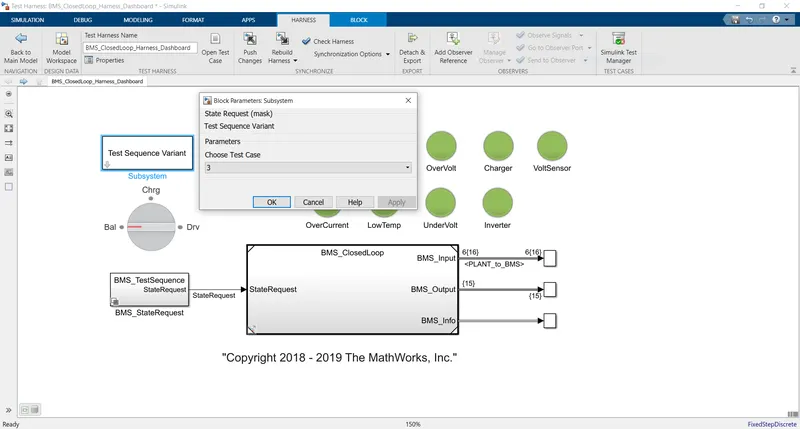
by click on the sequence block select the 3
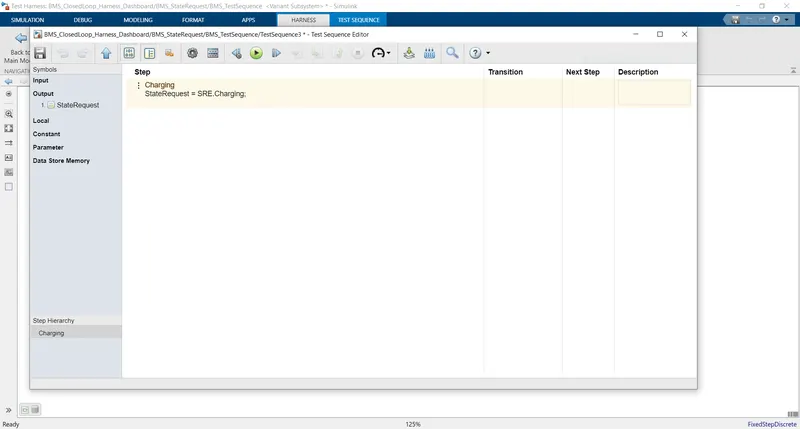
here the condition is only for charging
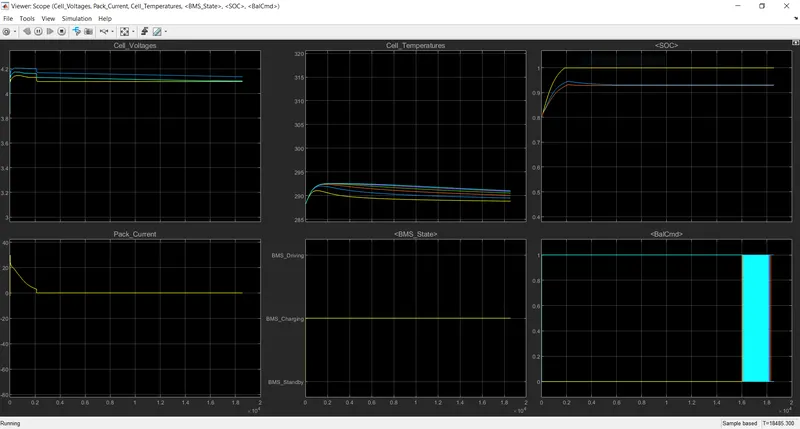
we can see here soc reached to 100% and remained in stand by mode.
cell temperature also decreased
here charging takes place first spc was at 80%.then soc went to 100%at 2000sec,then remained at 100%
2.What is coulomb counting? Refer to the above model and explain how BMS implements coulomb counting for SOC estimation ?
The various mathematical methods of estimation are classified according to methodology. The classification of these SOC estimation methods is different in the various literatures. However, some literatures [5, 7] allow a division into the following four categories.
(i)Direct measurement: this method uses physical battery properties, such as the voltage and impedance of the battery.
(ii)Book-keeping estimation: this method uses discharging current as the input and integrates the discharging current over time to calculate the SOC.
(iii)Adaptive systems: the adaptive systems are self-designing and can automatically adjust the SOC for different discharging conditions. Various new adaptive systems for SOC estimation have been developed.(iv)Hybrid methods: the hybrid models benefit from the advantages of each SOC estimation method and allow a globally optimal estimation performance. The literature shows that the hybrid methods generally produce good estimation of SOC, compared to individual methods.
3.1. Direct Measurement
Direct measurement methods refer to some physical battery properties such as the terminal voltage and impedance. Many different direct methods have been employed: open circuit voltage method, terminal voltage method, impedance measurement method, and impedance spectroscopy method.
3.1.1. Open Circuit Voltage Method
There is approximately a linear relationship between the SOC of the lead-acid battery and its open circuit voltage (OCV) given bywhere is the SOC of the battery at , is the battery terminal voltage when SOC = 0%, and is obtained from knowing the value of and at SOC = 100%. By , the estimation of the SOC is equivalent to the estimation of its OCV . The OCV method based on the OCV of batteries is proportional to the SOC when they are disconnected from the loads for a period longer than two hours. However, such a long disconnection time may be too long to be implemented for battery.
Unlike the lead-acid battery, the Li-ion battery does not have a linear relationship between the OCV and SOC . A typical relationship of Li-ion battery between SOC and OCV is shown in Figure. The OCV relationship with SOC was determined from applying a pulse load on the Li-ion battery, then allowing the battery to reach equilibrium .
The relationship between the OCV and SOC cannot be exactly the same for all batteries. Because the conventional OCV-SOC differs among batteries, there is a problem in that the relationship of the OCV-SOC should be measured to estimate accurately the SOC. Lee et al. [13] proposed a modified OCV-SOC relationship based on the conventional OCV-SOC. The SOC and the capacity of a lithium-ion battery are estimated using the dual extended Kalman filter with the proposed method.
The terminal voltage method is based on the terminal voltage drops because of the internal impedances when the battery is discharging, so the electromotive force (EMF) of battery is proportional to the terminal voltage. Since the EMF of battery is approximately linear proportional to the SOC, the terminal voltage of battery is also approximately linear proportional to the SOC. The terminal voltage method has been employed at different discharge currents and temperatures [14]. But at the end of battery discharge, the estimated error of terminal voltage method is large, because the terminal voltage of battery suddenly drops at the end of discharge [15].
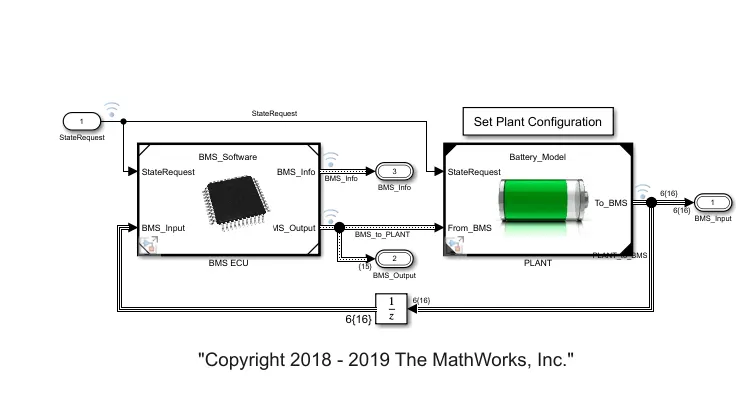
then we have to click on BMS ECU.
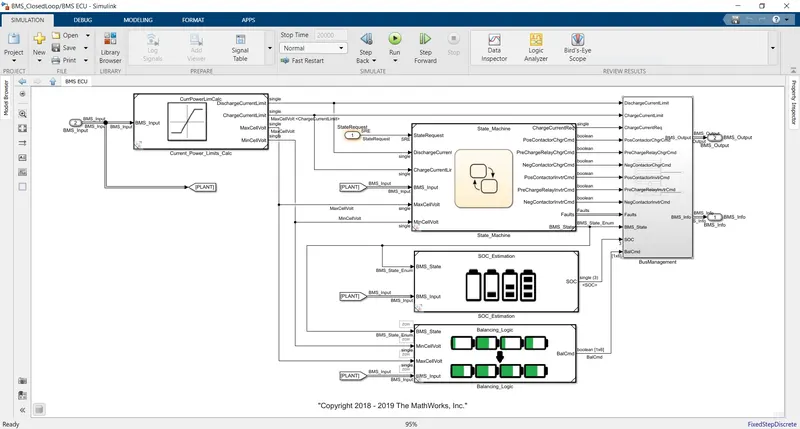
by double clicking on the soc estimation block we get.
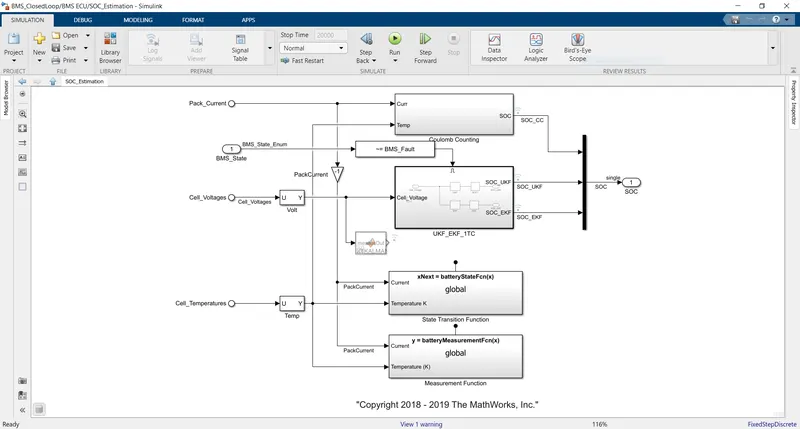
here on the top we can see column counting block.
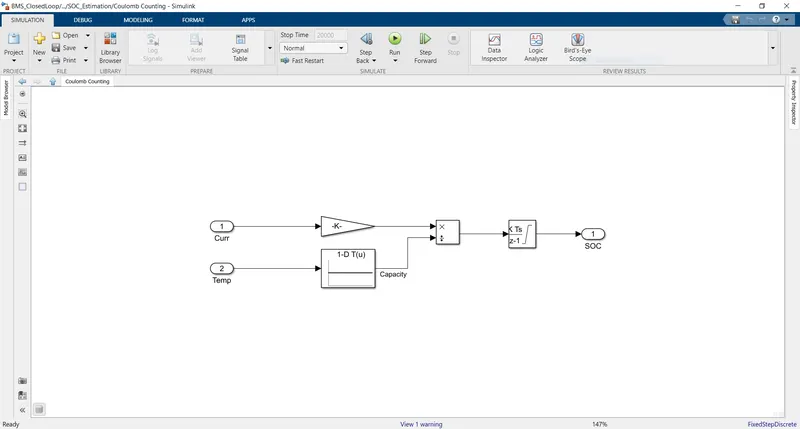
here is the subsystem which is opened.
temperature and current from the battery is given as inputs.
current signal is given to a gain block and temperature is given to capacity.
these inputs are given for integration where it gets calculated according to time
output is given by capacity
soc is estimated.