Week 7 State of charge estimation
1.Simulate the 3 test cases from harness dashboard and write a detailed report on the results
Aim: To Simulate the 3 Test cases from Harness dashboard and observe results.
Using the above link download the test lithium ion battery management algorithm.
Open the Above model.
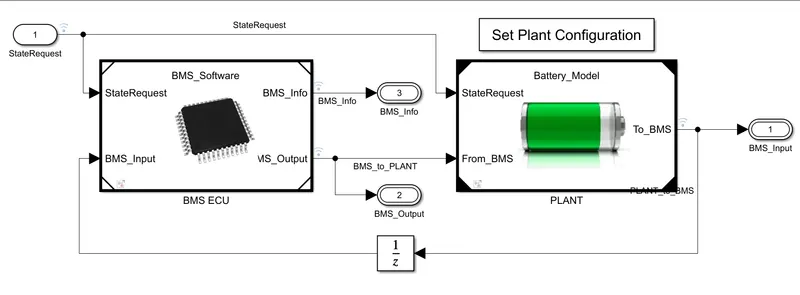
Above model consist of BMS ECU and Plant.
Inside BMS ECU:
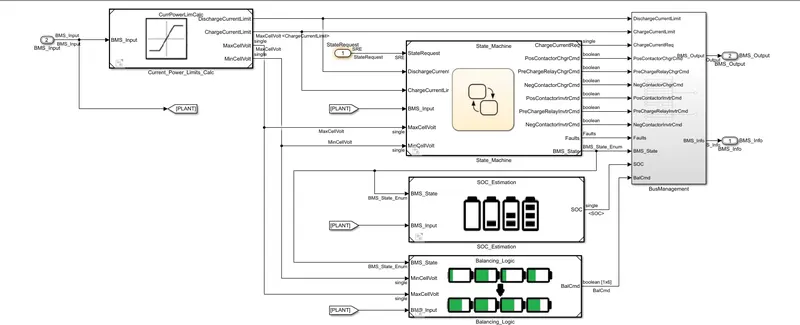
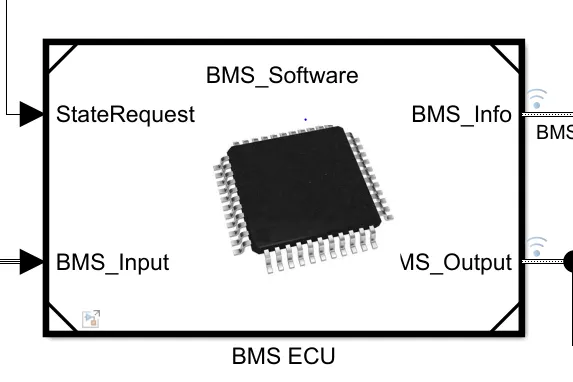
Input to Bms is a state request and Bms Input
Major thing in this Block is a State Machines.
Sate Machines used decided state of the plant.
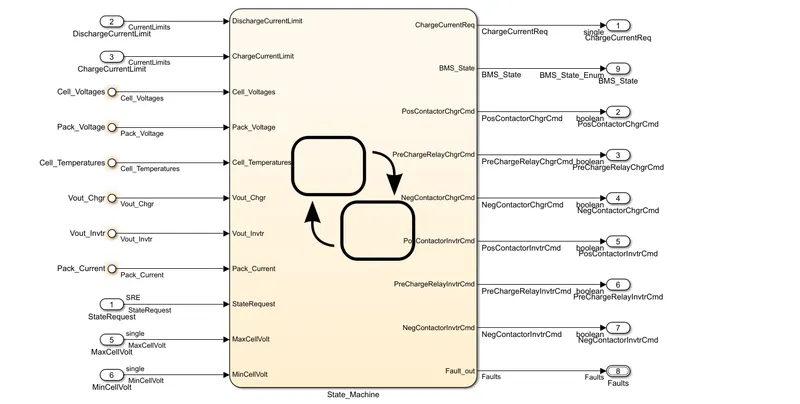
Plant status are input to State machines. Discharge current, Charge current, cell voltage. Based on this inputs, state Machine will operate plant.
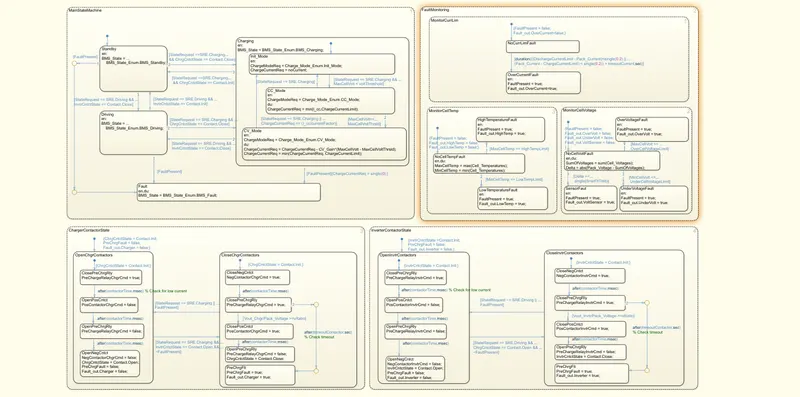
State machine has four parallel states. All states can be operated simultaneously
First state take care of standby, driving ,charging and fault.
Second stage take care of faulty condition of voltage, current, Temperature
Third and fourth state take care of contractor on and off of charging and Inverter circuit.
Plant configuration:
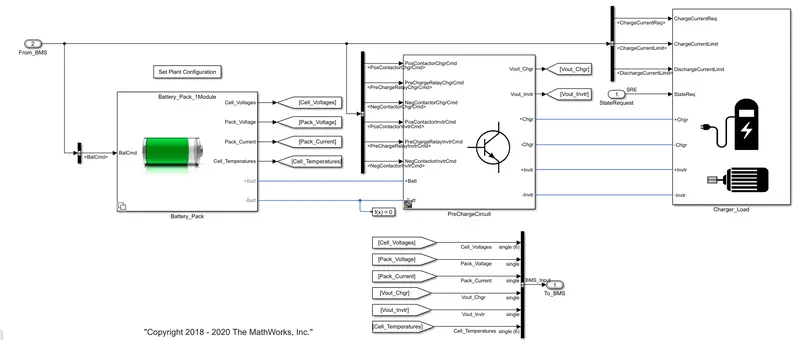
Plant consist of Battery pack, Pre charger circuit, and Load
Now it needed to test the plant. For this we have simulate 3 test cases from harness board.
Open Harness board as shown below.
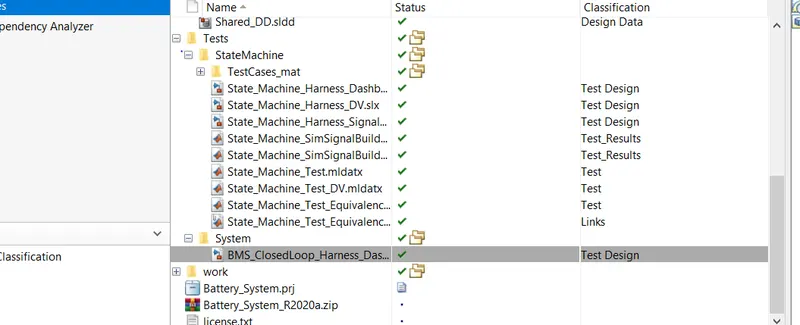
Then the following Model wiil be opened.
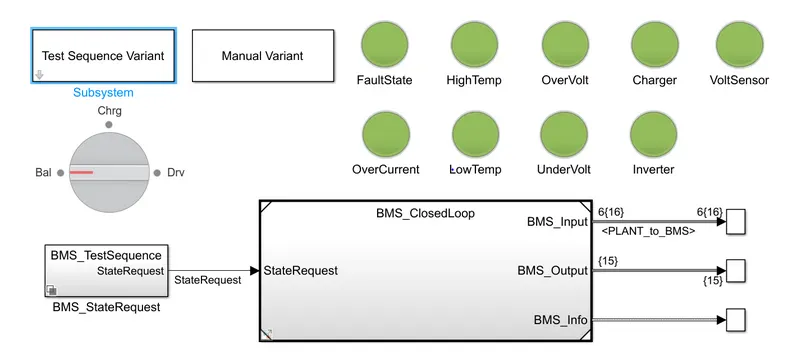
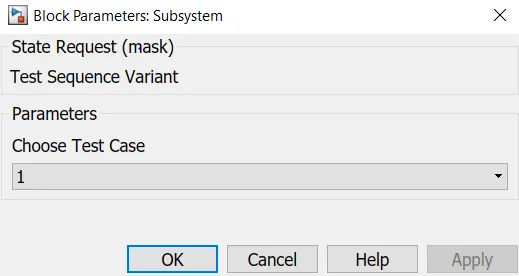
Test :1
Select the sequence Variant as 1
Here six cells connected in series are tested.
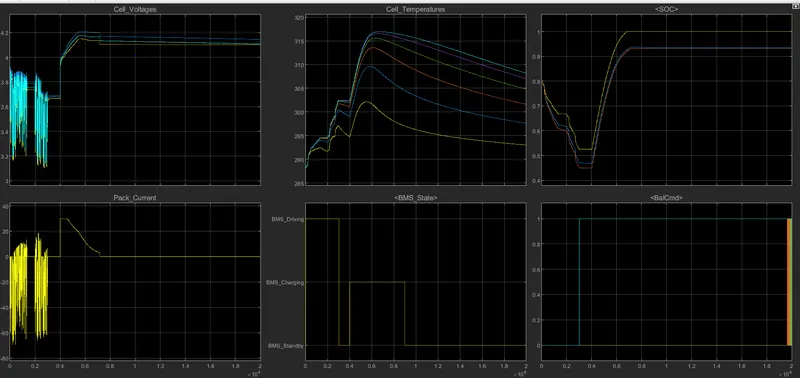
From 5th Graph:
For T=3000secs, Bms is in driving mode
For anthoer 1000 secs , battery is in charging mode
Remaining time , BMS operates in standby mode.
Cell Voltage:
Graph 1 Indicates voltage of all cells within battery pack. Intially vechicle is in driving state and soc will decreases
Graph 2 shows Current is charging and discharging, therfore Voltage of cell is osicllating in intial period.
At T= 3000 secs , Battery pack start in balancing mode. Due to this there sharp rise in voltage and current.
After 1000 secs the battery pack is in charging and balancing conduction, due to which SOC of battery reaches to 100 %
At the end of simulation ,volatges of each cells converges due to balancing, still there is slight difference of voltage across the cells.
Cell Temperature:
At starting, all the cells are at same temperature .
After some time , their is huge temperature difference between cell 1 and cell6.
Due to which pack may damage . To aviod these , battery pack need proper thermal management.
SOC:
SOC calculated with different methods
1: Coloumb counting method(Yellow Graph)
2: UKF ( Blue graph)
3: EKF ( orange graph)
At starting battery is in driving mode, due to which, Soc of battery decreases.
Different methods have different soc calculations.
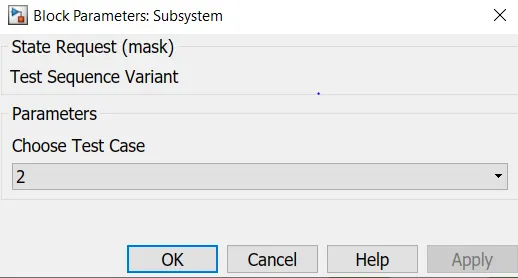
Test :2
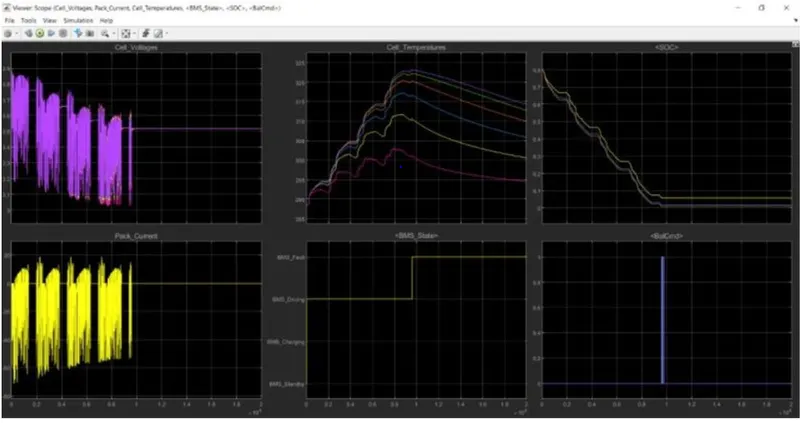
5 Th graph shows , for t=10000 secs battery was operated in driving mode
And rest of the time battery is operating in fault mode.
Cell Voltage:
All cell voltages are deflecting in same manner and current of these battery pack also deflecting.
Cell Temperature:
Temperature of individual cells varies differently. Cell 6th is operating at high temperature. Thermal management is required for this pack.
Soc:
Soc of cells decreases in all the methods. As battery pack is operating in driving mode.
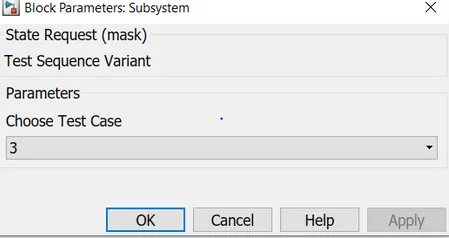
3. Test 3:
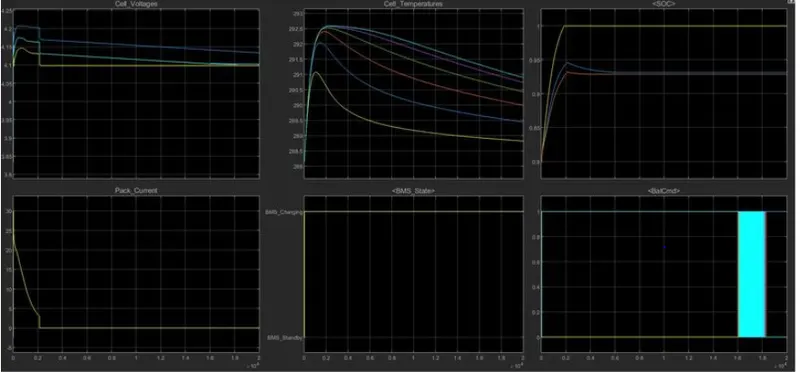
From Graph 5 , it is clear that entire Battery pack now operate in Charging Mode
At intial voltage difference are very, but the end of simulation, due to balancing all voltages converges to one point.
Pack current Graph shows after some time currrent becomes zero because of battery is in charging mode.
Soc of Battery increase to 100% in coloumb counting method, but in other methods soc remains at 95%.
Conclusions:
3 test cases from harness dashboard is simulated and various results were observed.
2.What is coulomb counting? Refer to the above model and explain how BMS implements coulomb counting for SOC estimation ?
Ans: Coulomb counting method is used to measure the State of charge of the battery(SOC).
This is calculated using discharge current from battery over a period of time.
Coulomb counting method measurses SOC using
1: Discharge current
2: Previous estimated SOC (soc(t-1))
SOC= SOC(t-1)+I(t)/Q(t)*change in temperature.
Corrected current is found by expermental results and it is a quadratic expression.
Ic=k2*I(t)^2+K1I(t)+K0
K2, K1,K0 are obtained from experimental data.
SOC= SOC(t-1)+Ic(t)/Q(t)*change in temperature.
Open battery Matlab battery Model.
Select BMS ECU
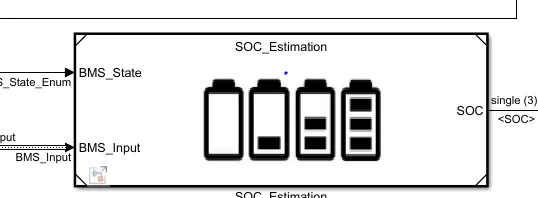
Select SOC Estimation Block
Enter into coloumb Counting Block:
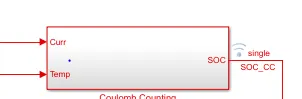
Then Following circuit will open.
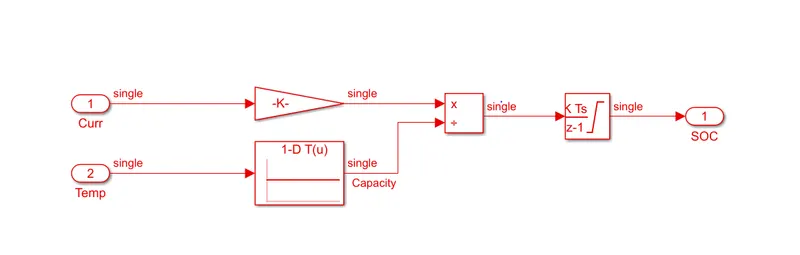
Above circuit will carry out for calculating SOC of battery as mentioned earlier. The main adavantage of coloumb counting method is that of simplicity and low cost.
Input to this circuit are current and temperature.
Cuurent is multiplied with gain block and temperature is multiplied with Capacity. These both values are Multiplied and divided and given to Integrator. And output of integrator is state of charge of battery.
In this manner SOC of Plant is caliculated.