Week 7: Shock tube simulation project
Aim-To carry out the simulation of the shock tube.
Objectives- To encounter the exapxsion the compression of the gases and to note the entire temperature in the process .
Theroy-
Shock Tube is used to produce the shock waves of varying strength in controlled manner. Shock tube are generally used in the arerodynamics,the chemical shock tube are used to study the temperture prpoduced in the chemical kinetics and the shock tube are used in the extraction of the oil from the tree wood in the industries. The shock tube consists of the two rwgions one is High pressure gas region which is generally called the driver region and the other region is called low pressure region which is called driven region.The both regions are seperated by the diaphgram.
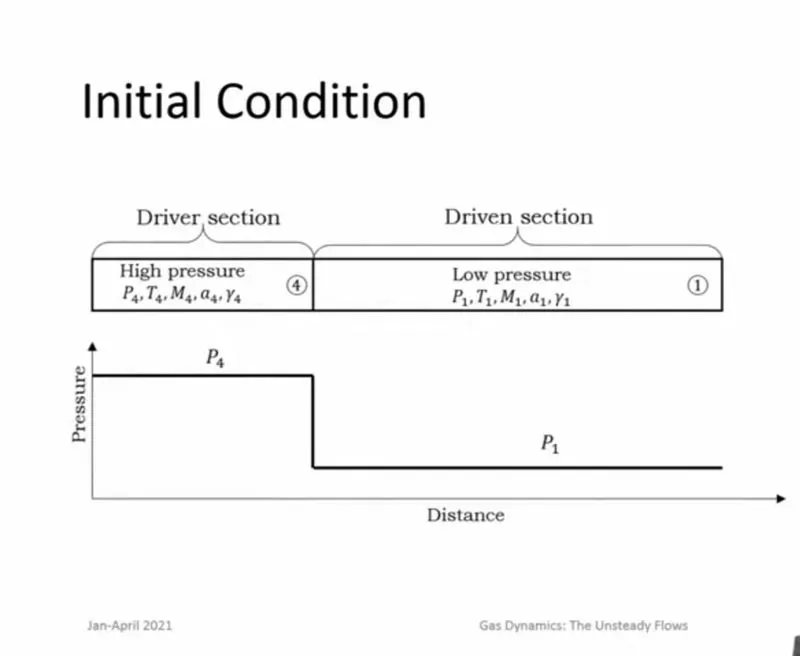
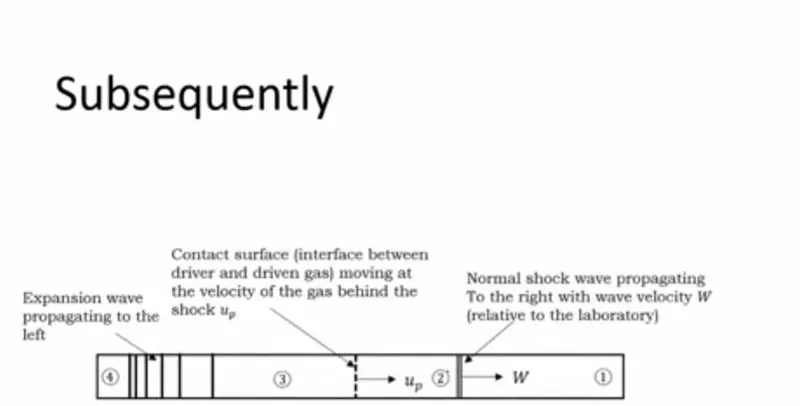
The diaphragm suddenly bursts open under predetermined conditions to produce a wave propagating through the low pressure section. The shock that eventually forms increases the temperature and pressure of the test gas and induces a flow in the direction of the shock wave.
The bursting diaphragm produces a series of pressure waves, each increasing the speed of sound behind them, so that they compress into a shock propagating through the driven gas. This shock wave increases the temperature and pressure of the driven gas and induces a flow in the direction of the shock wave but at lower velocity than the lead wave. Simultaneously, a refraction wave, often referred to as the Prandtl-Meyer wave, travels back in to the driver gas.
The interface, across which a limited degree of mixing occurs, separates driven and driver gases is referred to as the contact surface and follows, at a lower velocity, the lead wave.
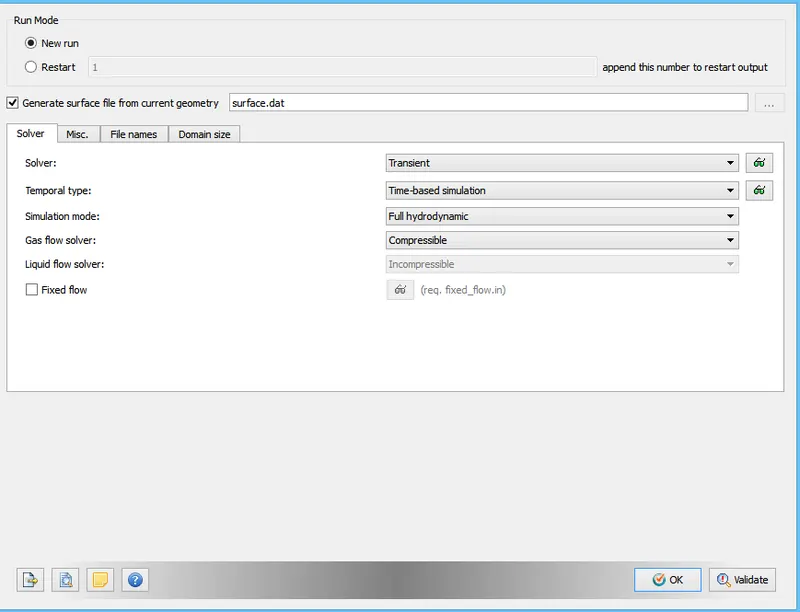
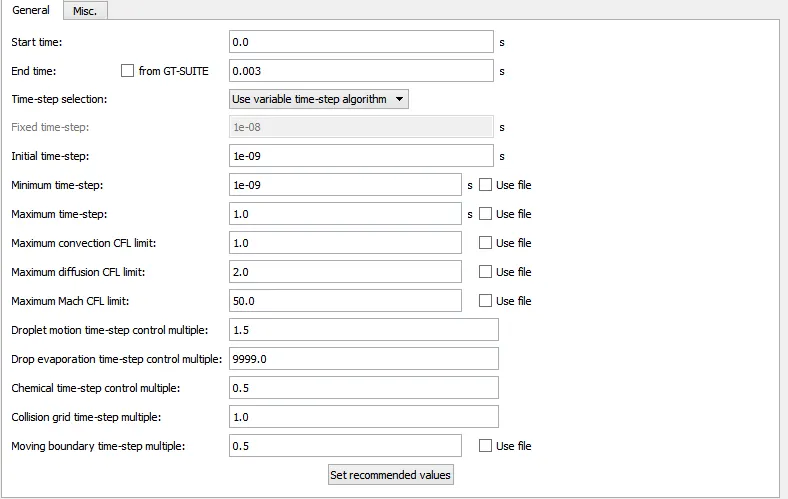
case set up
we have geometry
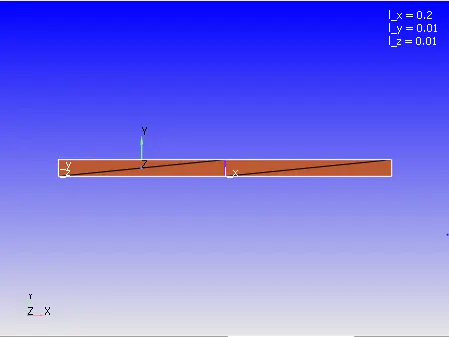
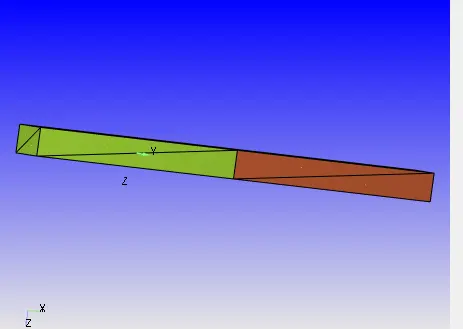
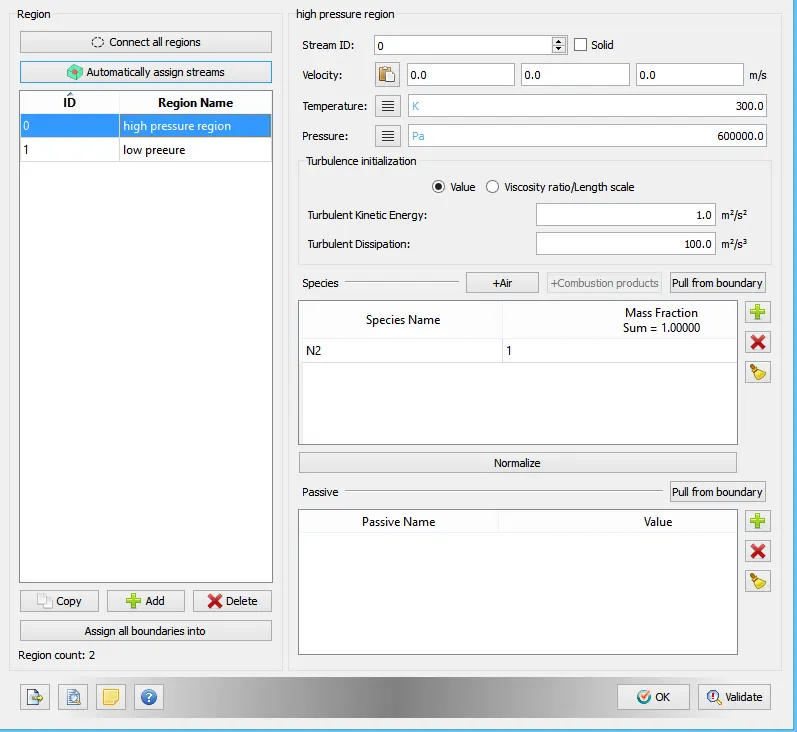
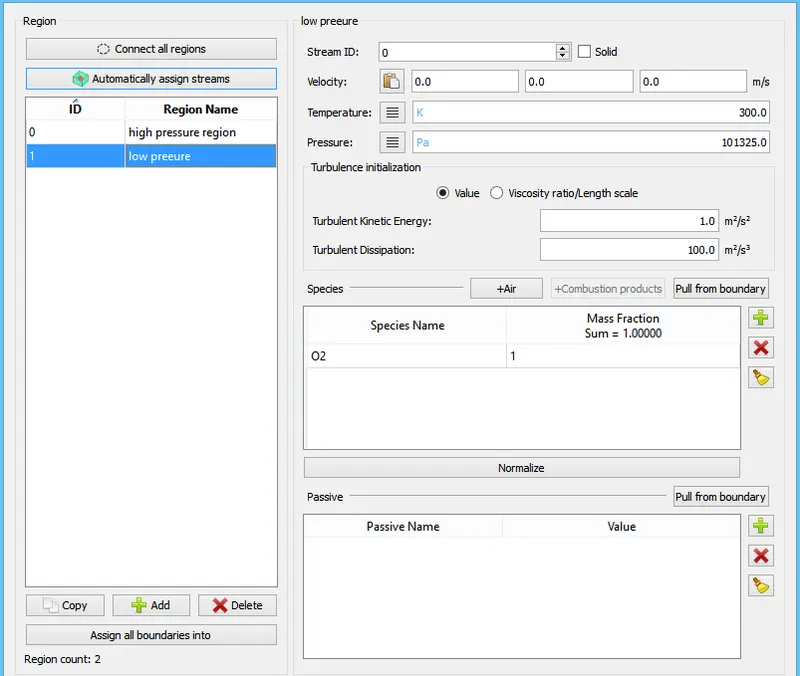
we have two regions high pressure and the low pressure region and the boundary flagging is done below



| Boundaries | Bounadaery condtion |
| High pressure region | slip |
| Hp 2d1 | slip |
| Hp 2d2 | slip |
| Low pressure | slip |
| lp2d1 | slip |
| lp2d2 | slip |
Here we have two regions one with high pressure gas known as driver gas and one with low gas known as driven here in this case the driver gas is Nitrogen with mass fraction of 1 and diver gas is oxygen with mass fraction of 1.
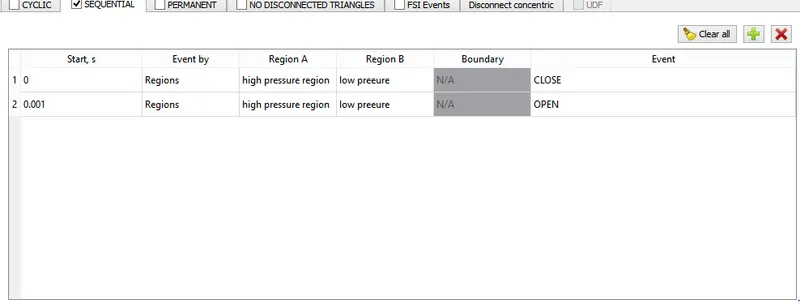
sice we have two regions in the coverge can create events so the we can create the disclosed triangles bewtten the two regions nad based on our need we can open these trangles and we can close the triangles.
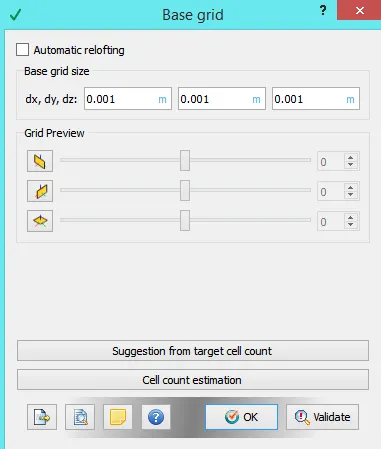
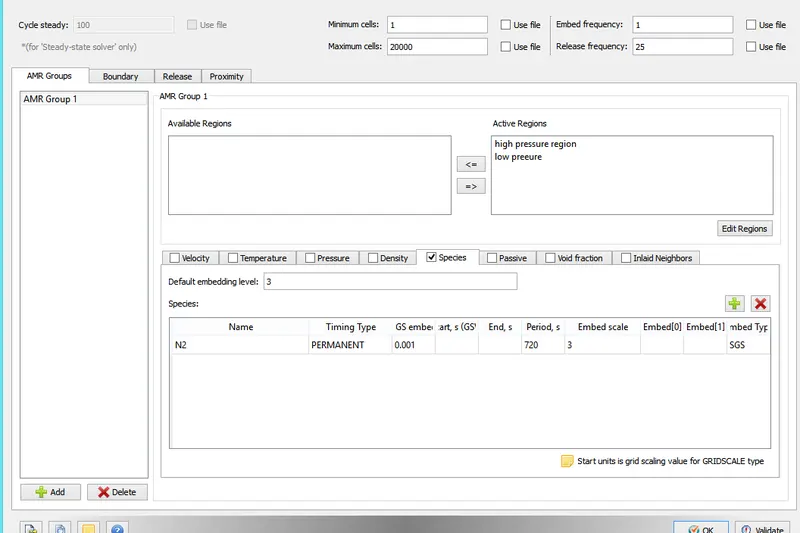
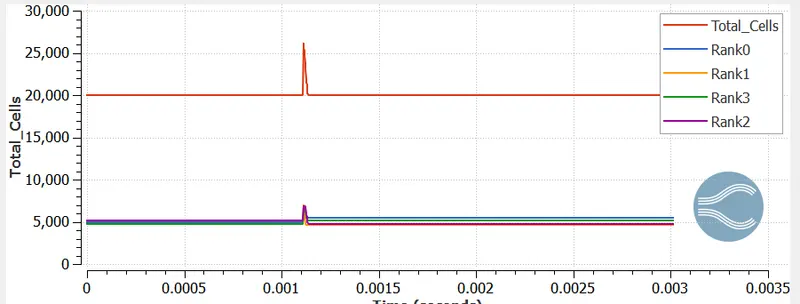
we are using the grid size of 0.001 in dx ,dy and in dz direction and we are using adpative mesh refinement to visuliase the properties near the shock waves properly.
Conclusion
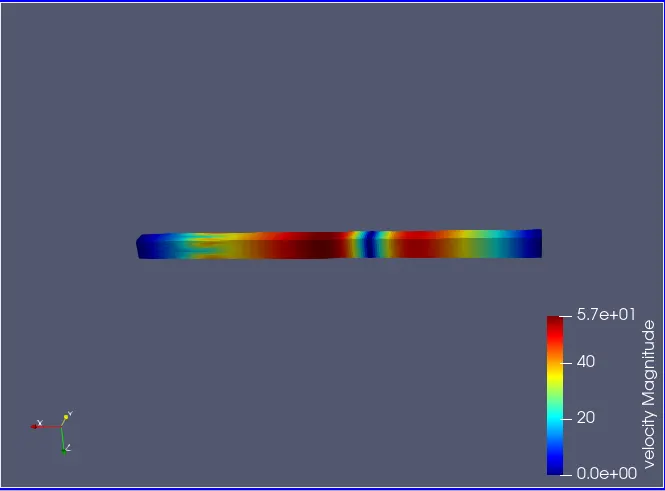
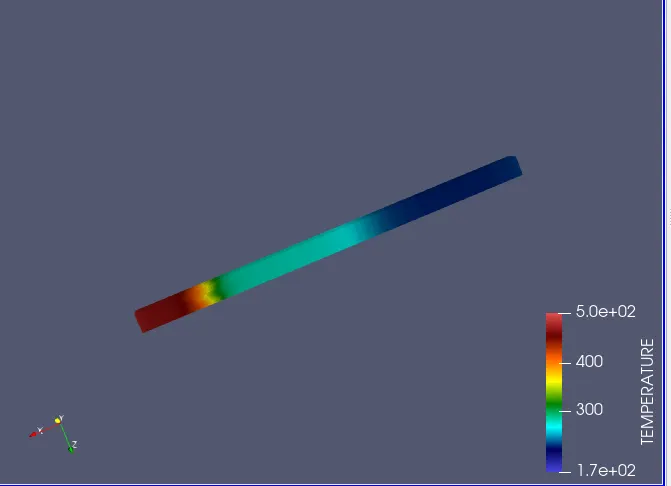
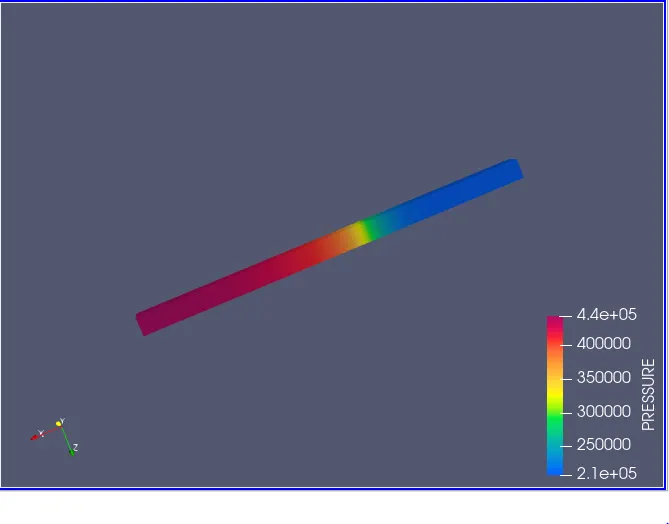
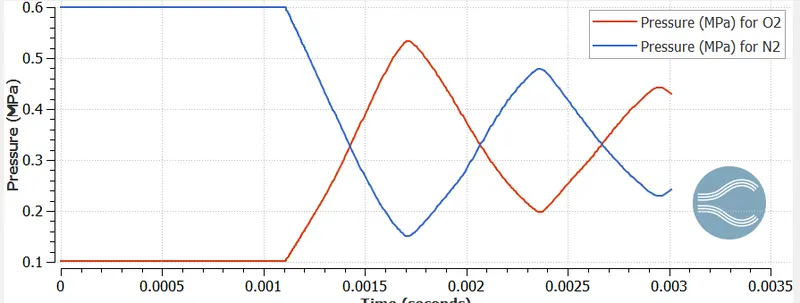
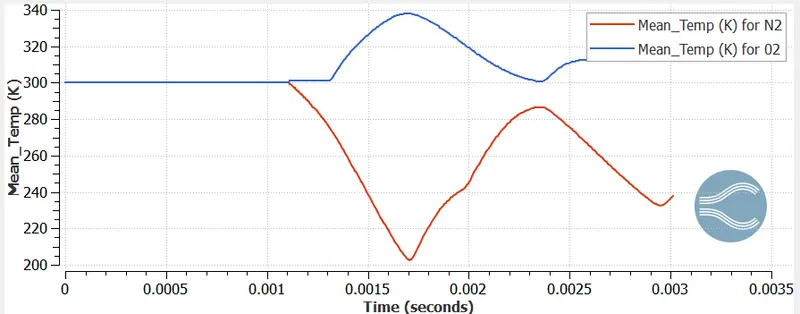
The driver gas compresses the driven gasresults increases the temprerure and the pressure of the test gas.after some time recirculation take place and nitrogen gas reflects back to the driver section with low velocity than the lead wave hence expansion of the gas take place.From the pressure plot the first pressure increases and decreases and the preesore of the oxygen is less and due to compression the pressure and teh temperature of the Oxygen increases.
sa