Week 7: Shock tube simulation project
Aim:
-To setup the transient shock-tube simulation
-To study about pressure, Temperature and cell count as the function of time
Introduction
A shock tube creates direct shock waves to mimic genuine explosions safely. Shock waves are used to study the movement of gasses across materials, for military applications, to create jet effects, for testing materials, and for biomedical research. A compression-driven shock tube was devised in 1899 by a French physicist. The pipe diameter was 0.6 to 2 m, the tube length was 3 to 15 m, and it created 7 to 200 MPa shock waves. Shock waves were used to research chemical transformations, high temperature and self-ignition on gasses and fuels, and Nano particle dynamics. Safe driving gasses include hydrogen and helium. Shock tubes are used to examine the behaviour of materials under thermal and water shocks, mining applications, chemical kinetics of fast-moving gasses, time histories, species identification, and heat transfer. The shock tube is an instrument used to replicate and direct blast waves at a sensor or a model in order to simulate actual explosions and their effects, usually on a smaller scale. Shock tubes (and related impulse facilities such as shock tunnels, expansion tubes, and expansion tunnels) can also be used to study aerodynamic flow under a wide range of temperatures and pressures that are difficult to obtain in other types of testing facilities. Shock tubes are also used to investigate compressible flow phenomena and gas phase combustion reactions. More recently, shock tubes have been used in biomedical research to study how biological specimens are affected by blast waves.
Composite plate deformation begins before the reflection of shock waves after the collision, complicating testing and researching aero-elastic interactions. As the wave time scale is quicker than the plate's, deformation happens after reflection. Patil et al. studied shock-wave deformation of stacked metal sheets. Copper, brass, and aluminium were tested with one piece of 1.5 mm and three-piece of 0.5 mm sheets. The result suggests using shock wave formation to stack metallic sheets to construct a composite structure. A multilayered nacre structure composite was suggested to improve mechanical qualities.
Benzait et al. studied polymer composite fibers for body protection. The composites were hand-laid and vacuum-bagged. Good Armor has a ceramic layer, a light composite layer, and a metal layer that prevents missile penetration. Polymers and foams are tested under shock waves and their disintegration at Los Alamos National Laboratory. High temperatures crush porous materials' pores and reduce the threshold pressure and particle velocity for shock disintegration. Natural Fibers are the most outstanding alternative for Armor and ballistics applications. Basalt, flax, aramids, kenaf, and jute fibres enhance the properties of Armor vests. Hybrid composites are a superior alternative to man-made fibres than reinforcing one natural fiber. Curaua fiber can be used as a backing layer for Kevlar composites. Zhou et al. evaluated sandwich composite panels' stress wave and fragment failures. LS-DYNA was used to simulate material combinations and explosion distance variations. As explosion distance increases, fragment dispersal expands and target density falls. Kevlar and aramid fibres are commonly used for ballistics, but their disposal pollutes the environment. Researchers look for biodegradable natural fibres that absorb and dissipate kinetic energy better. Due to their availability, low cost, ease of manufacture, and durability, natural fibres are chosen. Aircraft parts like shock wave testing. Zhang et al. used damage analysis to understand aircraft part behaviour under harsh situations. The study focused on CFRP composite, and there was little research on C/C composite, Kevlar epoxy, and GFRP composite. This review details the adjustments made to the shock tube diameters, types, and exterior arrangements for specific purpose testing, ignition delay testing methods, results measuring methodologies, and numerous applications.
Shock tubes with and without a diaphragm are driven by compressed air or stored inert gas. Pressure gauges are used to keep track of gas pressure. Depending on the application and type of shock tube, the length and diameter of the driven and driver sections change. Pressure between the driver and driven tubes can be changed via a fast-acting valve or diaphragm. The rupture of the diaphragm creates one-dimensional non-steady flow. Institute for Aerospace Studies, Canada, invented the UTIAS combustion-driven hypersonic shock tube in 1964. In 1994, the identical shock tube was relocated to Tohoku University, Japan, where the diaphragm was replaced with a rapid-opening valve, dump tanks, and pressure transducers were modified. Lengthening the high-pressure chamber delays the reflected wave, during the shock tube test. For measuring a sphere's drag coefficient, acrylic boards were used to observe its motion. Shock tubes were tested in horizontal, vertical, and inclined positions. Multiple spark cameras were installed to record solid motions during testing. A PCB amplifier is coupled to a digital oscilloscope to measure shock velocity and wavelengths during gas mixing. Many cross-disciplinary research projects and applications use shock tubes without a diaphragm. Fast-acting valves have taken the place of the diaphragms that produce shockwaves in traditional shock tubes .A rapid-opening single-pulse diaphragm less shock tube.
Strong repeatability, quick response, and clean flow are all features of fast-acting valves. Improved valve designs provide better performance and quicker opening times. The generation of shock waves is influenced by the valve's opening time, shock-generating distance, pressure differences, operating range, and valve efficiency. The study of ocean contamination caused by microorganisms use diaphragm-free tubes. Driven tube diameter spans from 1 mm to 431.8 mm, and the lowest driver pressure is 1 bar.
One-dimensional shock tube experiments replicated volcanic eruptions and studied rapidly decompressed gas particles. As gas-particle size rises, velocity decreases for a given pressure ratio, according to a study. Newer predictions for gas-particle combination shock strength and velocity agreed with experiments.
Shock tube Working
It consists of a driver and a driven tube in which separated by placing a diaphragm. Pressurized gas is pumped through the driver tube to the section until it rupturing the diaphragm , driven section is maintained for low pressure and generating shock waves.
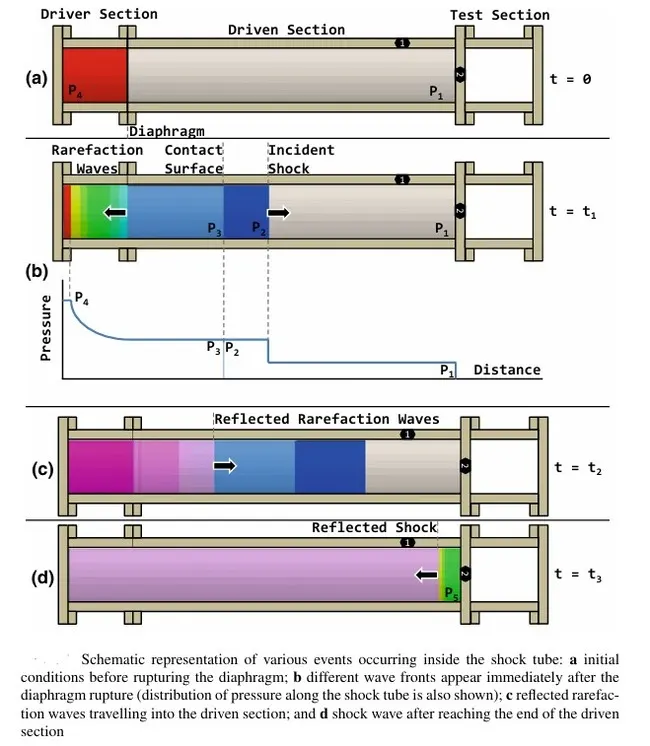
At time t =0,the diaphragm ruptures leading to a sudden release of the high-pressure driver gas (P4) into the low-pressure gas (P1) section, a series of com pression waves, propagate into the driven section. On the way of travel, compression waves compress the driven gas and raise its temperature. At time t = t1 , the rear compression pressure waves at region of high-temperature zone travel faster than leading pressure waves, and these compression waves eventually coalesce to form an incident shock wave at a certain distance away from the diaphragm section. The generated shock wave will be travelling at velocity higher than the velocity of sound of the driven gas. The driver gas and driven gas come in contact at the contact surface, which travels right behind the shock wave. The pressure region between contact surface and shock wave is denoted as P2. Subsequently, an expansion wave travels in the reverse direction of shock wave into the driver section. The expansion wave travels at the speed of sound in the driver gas, and the pressure drop is gradual unlike the shock waves (see pressure–distance curve. The region between contact surface and the expansion wave is denoted as P3. The expansion wave is also called as rarefaction fan with the leading wave referred as ‘head’ and the last wave as the ‘tail’. The rarefaction head upon reaching the end of the driver section gets reflected to interact with the incoming expansion fan (tail), and this overlap further accelerates the reflected rarefaction fan (Gaydon and Hurle 1963). The reflected rarefaction wave travels towards the contact surface. Finally, at t = t4, the incident shock wave undergoes reflection at the end of the driven section, and there is further rise in pressure P5
Ideal Shock tube theory
The discussion on shock tube theory is limited to compressed-gas-driven-type shock tube having a circular cross section. The relationship between the thermodynamic properties on both sides of the shock front is given by the Rankine-Hugoniot relations. One-dimensional theoretical analysis is considered for the shock tube problem; the flow is considered inviscid and obeys ideal gas equation with constant specific heat. Substitution of ideal gas on the momentum equation and rearranging them
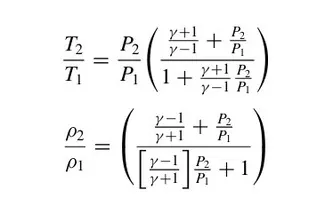
The above equation referred as Rankine-Hugonoit equations
Pressure ratio across the shock wave in terms of mach number is given below.
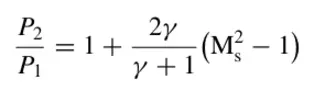
P1 represents the Driven section pressure, P4 represents a driver section pressure. pressure ratio of driven to driver ratio is given by

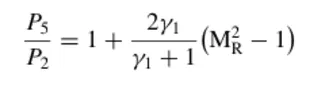
Where a4 is the speed of sound in driver gas, and a1 is the sound speed in driven gas. The above relation used to find the incident shockwave Mach number (Ms). The reflected shock wave Mach number(MR) is determined from the incident shock wave Mach number(MS) using the below equation
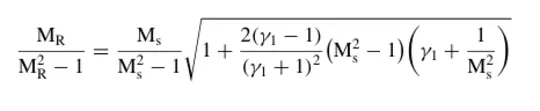
The peak-reflected shock wave pressure (P5) at the end wall of the shock tube is related to the reflected shock wave Mach number (MR)using the following equation,
Modes of operation:
The shock tube can essentially be operated in both shock wave mode and blast wave mode. The basic difference between a shock wave and blast wave lies in the pressure zone behind the shock front. A typical shock wave profile is characterized by the presence of shock front (sudden jump), followed by the contact surface pressure which remains constant for a certain period. While in the case of a blast wave, the sudden jump in pressure is immediately followed by an expansion wave where the pressure decreases exponentially. The type of wave generated in a shock tube depends on the following parameters: Length of the driver section, Nature of the driver gas. In order to generate a shock wave, a rapid driving force is required.
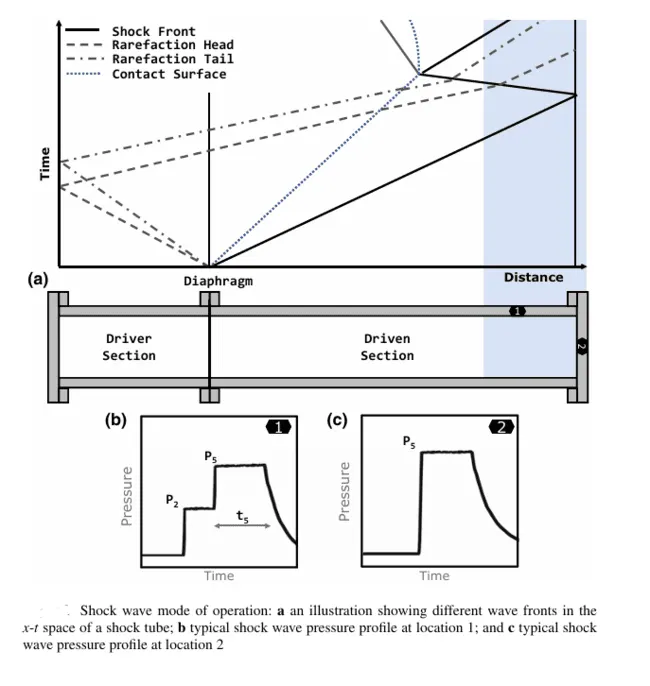
In the shock tube, the sudden release of driver gas initiates the formation of shock wave. The idealized pressure profile obtained during a shock wave mode is also shown in Fig below, location 1 corresponds to side wall of the shock tube and location 2 is on the end wall of driven section. From the wave diagram, it can be seen that the reflected rarefaction head has failed to catch the incident shock front, and the constant pressure behind the shock front is limited primarily by the arrival of the rarefaction wave. The rarefaction wave eventually catches up with the reflected shock front (P5) by overtaking the contact surface and decays the pressure level. The constant pressure duration (t5) can be achieved by providing sufficient driver length with driver gas having lower sound speed (e.g. nitrogen), to delay the arrival time of the contact surface (or rarefaction wave). The reflected shock wave pressure (P5) over a constant time duration (t5) is used as input loading pulse in investigating the target against shock loading.
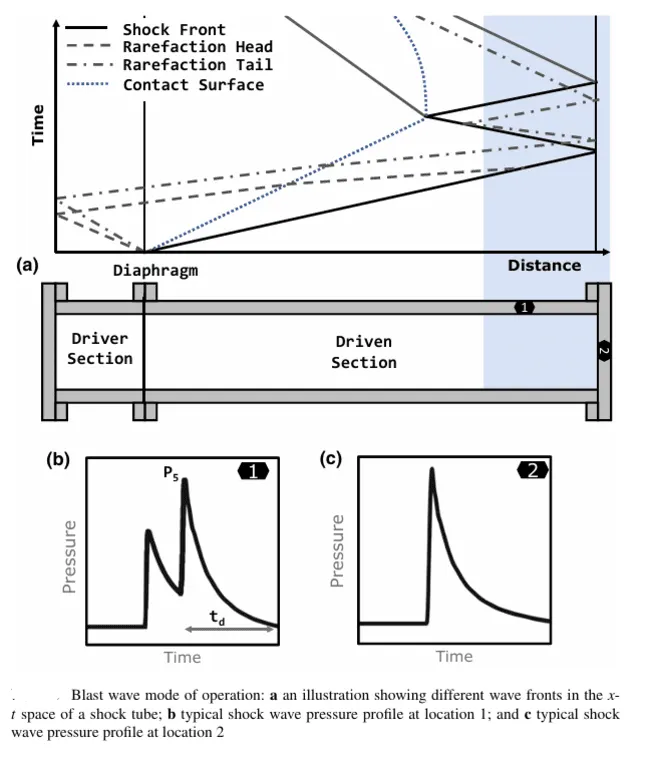
Blast wave mode, it is emphasized in the shock wave mode that the arrival of the rarefaction plays a major role in decaying the pressure levels. In order to obtain an immediate pressure decay profile, the rarefaction waves have to be accelerated. This can be achieved by choosing a driver gas which has a higher sound speed (e.g. helium), and hence, the rarefaction wave is expected to travel faster in the driver section. The reflected rarefaction wave from the driver section further accelerates when it crosses the contact surface due to the increased sound speed and eventually decays the incident shock pressure. In addition, the length of driver section can also be reduced (considering enough driving force for shock front formation) so that time taken for the travel of rarefaction wave in driver section is reduced. The decay in the pressure profile at location 1 indicates that rarefaction head has caught up with the leading shock front and at location 2 , and the reflected shock pressure is exponentially decreased by the series of expansion fan. The reflected shock wave pressure (P5) over positive time duration (td) is used as input blast pulse in investigating the target against blast loading
Types of shock tube are Diaphragmless shock tube (DST), Vertical shock tube (VST), Table-mounted shock tube (TST). DST facility is used to generate shock loading, while, VST and TST setup are used to generate air-blast and buried-blast loading, respectively.
Shock loading occurs when a structure experiences a sudden, high-intensity force or impact. It typically involves rapid changes in load, strain rates, and inertia effects. Typical characteristics of shock loading is High strain rates: Materials behave differently under rapid loading, Localized: The force is concentrated at specific points, Transient: Short-duration loading, Structural Response: Can cause deformation, fracture, or failure.
Blast loading results from an explosion or detonation. It generates shock waves that propagate through air or other media, impacting structures. Typical characteristics of blast loading High-energy release: Generates intense pressure waves, distributed: Affects a larger area, Dynamic loading: Varies over time, Structural Response: Can cause structural damage, fragmentation, and displacement.
Case-Setup:
-File->import->import STL is used to import the geometry file
-Doing a cleanup (removed the surfaces)
-Stream Manager-Created multiple regions under one stream ID
-Time-Based simulation is selected
-Materials-Gas simulation and Species is checked
-Redlich-Kwong equation of state is used to model the gas
-Two species such as Nitrogen and oxygen are defined
-compressible solver and transient solver are used
-Simulation time parameters are defined
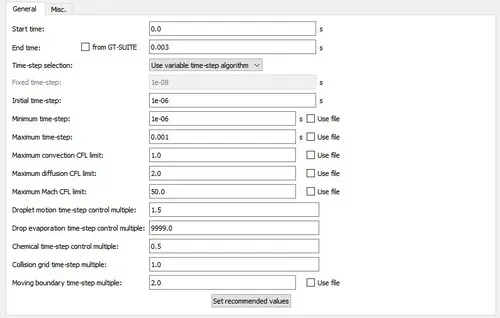
-PISO Algorithm is utilised for pressure-velocity coupling and Density-based solver is used.
-Assigned Boundary conditions as noslip for the high- and low-pressure regions
-Created Regions as High- and low-pressure region before assigning the Boundary conditions and provided the initial values
-Created Sequential to remove the diaphragm after 0.001 s
-Turbulence Modeling-K-E RNG model is used
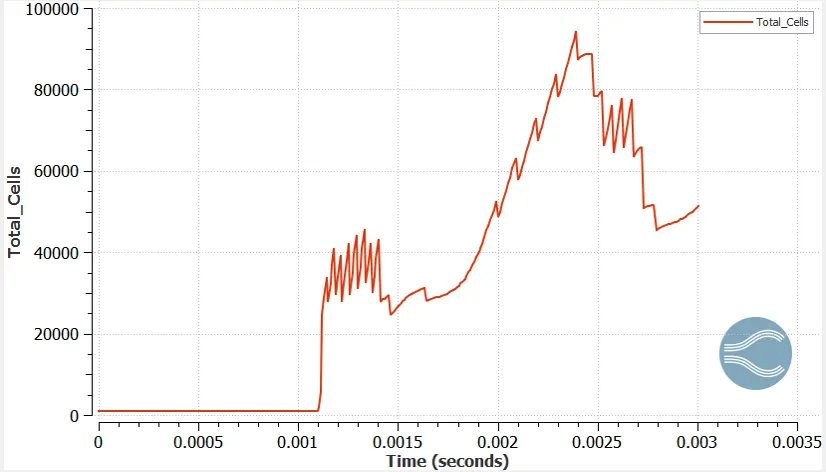
-Used Adaptive mesh refinement for species gradient
-Ran "mpiexec -n X converge --license xxxxx" this command using CYGWIN Terminal
-Postprocessed using ParaView
Plots:
Animation:
Wireframe-https://youtu.be/vc2JxbW1yk4https://drive.google.com/file/d/12j-J7UTSBXB7ZTxk0jqY5SjbmtkMp82v/view?usp=drive_link
Temperature as function of time-https://youtu.be/EdNLxcTcjPo
Pressure as function of time-https://youtu.be/mfBhyZBp6NQ
Velocity as function of time-https://youtu.be/zV88vB7K8as
Mass fraction of N2-https://youtu.be/9-KNcxEszqg
Conclusion:
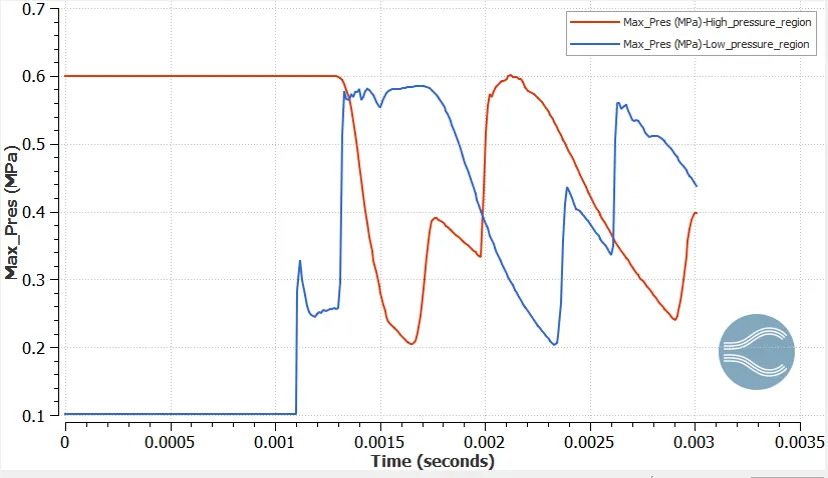
(i)After 0.001 sec in plots and in animation there is disturbance observed and its due to the event setup. High pressure and low-pressure regions are opened and can mix, this is analogous to breaking of diaphragm.
(ii)The pressure increases rapidly. This is due to the generation of shock waves which propagates inside the tube. From the animation it can be observed that the shock waves have a leading head and a trailing head.
(iii) When the shock waves reflect from the end of the shock tube they basically compress the gas at that end to a high pressure. The peak pressure is attained during this compression. The compressed gas prevents the mass of two gases from mixing with each other and is reflected back. This is when the pressure of the gas starts to drop. The wave then reaches out the other end and the pressure decreases further. It is then reflected from that end and the process is repeated.
(iv) The ignition delay can be calculated from the graph of pressure vs time. Ignition delay is the time lag between the reflection of shock from the boundary and the onset of temperature. It can be obtained by linearly extrapolating the steepest curve line back in time to the pre-ignition baseline.
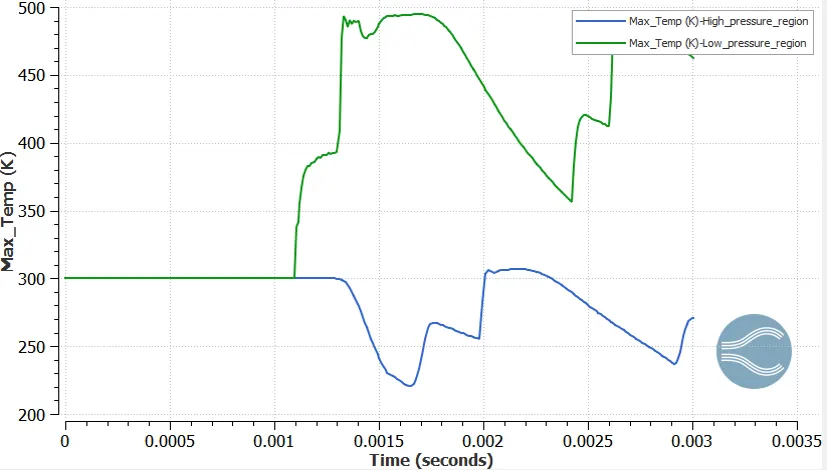
(v). The temperature increases. This is due to the pressure wave propagating in the region of low pressure. This pushes the the mass of the low pressure region and compresses it adiabatically. The work is done on the system, volume decreases and hence the temperature rises.
(vi) The temperature decreases. The shock wave travels from high pressure to low pressure region and the work is done by the system of high-pressure gas. There is adiabatic expansion and hence the temperature decreases.
(Vii) The temperature in high pressure and low-pressure region reaches local minima and local maxima respectively at 0.0016 respectively. Then there is a decline in temperature. This is due to the reflection of shock from the tube
(viii)Due to the shockwave region the species getting expanded as well as getting compressed.
(ix)Nitrogen species gradient is high at the 0.0025 s due to cell count increased
(x)Observed a shock waves due to this pressure decreases and velocity increases.