Genetic Algorithm
Introduction
Drawing its inspiration from Charles Darwin's theory of natural evolution, one of the most fascinating techniques for problem-solving is the algorithm family suitably named evolutionary computation. Within this family, the most prominent and widely used branch is known as genetic algorithms. This algorithm is extremely powerful, yet extremely simple, technique.Genetic algorithms are a family of search algorithms inspired by the principles of evolution in nature. By imitating the process of natural selection and reproduction, genetic algorithms can produce high-quality solutions for various problems involving search, optimization, and learning. At the same time, their analogy to natural evolution allows genetic algorithms to overcome some of the hurdles that are encountered by traditional search and optimization algorithms, especially for problems with a large number of parameters and complex mathematical representations
Elements of Genetic Algorithm
Population
Population at any point in time, genetic algorithms maintain a population of individuals – a collection of candidate solutions for the problem at hand. Since each individual is represented by some chromosome, this population of individuals can be seen as a collection of such chromosomes: A population of individuals represented by binary-coded chromosomes The population continually represents the current generation and evolves over time when the current generation is replaced by a new one.
Fitness Function
At each iteration of the algorithm, the individuals are evaluated using a fitness function . This is the function we seek to optimize or the problem we attempt to solve. Individuals who achieve a better fitness score represent better solutions and are more likely to be chosen to reproduce and be represented in the next generation
Selection
After calculating the fitness of every individual in the population, a selection process is used to determine which of the individuals in the population will get to reproduce and create the offspring that will form the next generation. This selection process is based on the fitness score of the individuals. Those with higher score values are more likely to be chosen and pass their genetic material to the next generation. Individuals with low fitness values can still be chosen, but with lower probability. This way, their genetic material is not completely excluded
Crossover
To create a pair of new individuals, two parents are usually chosen from the current generation, and parts of their chromosomes are interchanged to create two new chromosomes representing the offspring.
Mutuation
A mutation may manifest itself as a random change in a gene. Mutations are implementedas random changes to one or more of the chromosome values
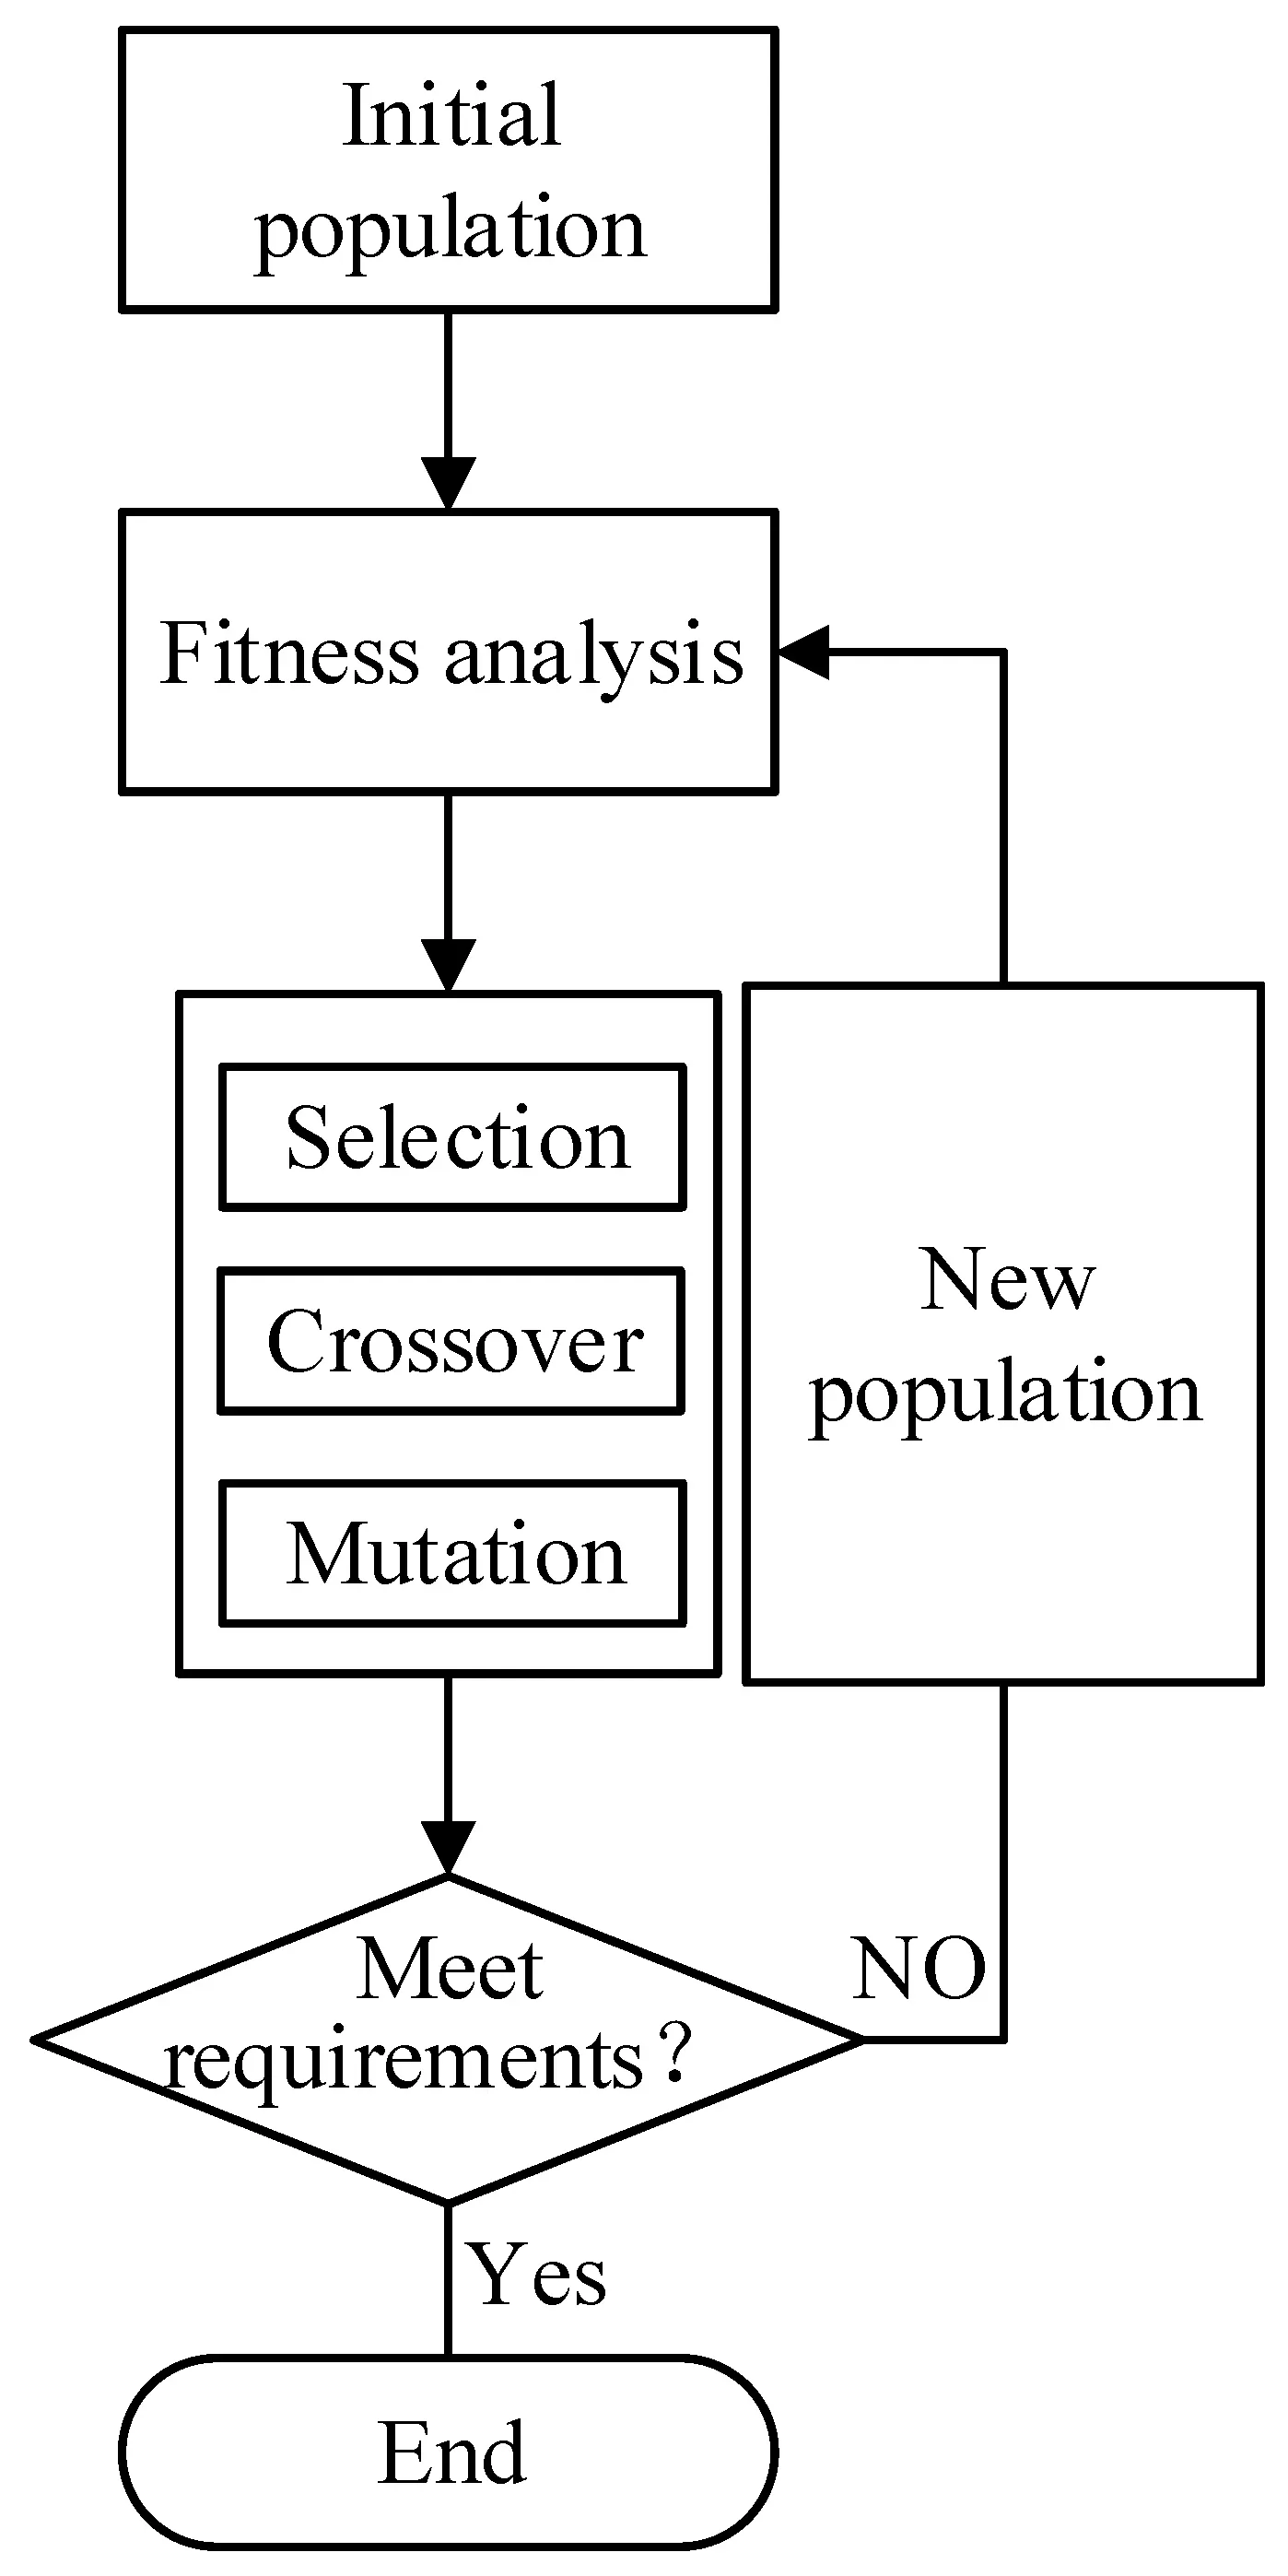
fig1-flow chart of genetic algorithm
Script
The below program is used to find the global maximum for a stalagmite function
clc
clear all
close all

%inputs
x=linspace(0,0.6,150)
y=linspace(0,0.6,150)


[xx yy]=meshgrid(x,y)

for i=1:length(xx)
    for j=1:length(yy)
        input_vector(1)=xx(i,j)
        input_vector(2)=yy(i,j)
        f(i,j)=stalagmite(input_vector) %function call
    end
end

%Study-1 unbounded
for i=1:1:length(xx)
fitnees_func=@stalagmite
[input fval(i)]=ga(fitnees_func,2)
x_unbounded(i)=input(1)
y_unbounded(i)=input(2)

end

figure(1)

hold on
surf(xx,yy,-f)                    %Creates a Surface Plot
shading interp                    %shades a plot
plot3(x_unbounded,y_unbounded,-fval)
xlabel('xvalue')
ylabel('yvalue')
title('Unbounded plot')
grid on

figure(2)
plot(fval)
xlabel('Iterations')
ylabel('Functions')

%Study2-Bounded
for i=1:1:length(xx)
fitnees_func=@stalagmite
[input fval_bounded(i)]=ga(fitnees_func,2,[],[],[],[],[0;0],[1,1])
x_bounded(i)=input(1)
y_bounded(i)=input(2)
end

figure(3)

hold on
surf(xx,yy,-f)
shading interp
plot3(x_bounded,y_bounded,-fval_bounded)
xlabel('xvalue')
ylabel('yvalue')
title('Bounded plot')
grid on

figure(4)
plot(fval_bounded)
xlabel('Iterations')
ylabel('Functions')

%Study3-Bounded Plot with Options
options=optimoptions('ga','PopulationSize', 400)
for i=1:1:length(xx)
fitnees_func=@stalagmite
[input fval_bounded_options(i)]=ga(fitnees_func,2,[],[],[],[],[0;0],[0.6,0.6],[],[],options)
x_bounded_options(i)=input(1)
y_bounded_options(i)=input(2)
end
figure(5)

hold on
surf(xx,yy,-f)
shading interp
plot3(x_bounded_options,y_bounded_options,-fval_bounded_options,'o','MarkerSize',10,'color','r')
xlabel('xvalue')
ylabel('yvalue')
title('Bounded plot with Population size')
grid on

figure(6)
plot(fval_bounded_options)
xlabel('Iterations')
ylabel('Functions')
The below script is a Stalagmite function
function f=stalagmite(inputs)                     %Stalagmite Function with two inputs
f1=(sin((5.1*pi*inputs(1))+0.5))^6
f2=(sin((5.1*pi*inputs(2))+0.5))^6
f3=exp(-4*log(2)*((inputs(1)-0.0667)^2)/0.64)
f4=exp(-4*log(2)*((inputs(2)-0.0667)^2)/0.64)
f=-(f1*f2*f3*f4)                                 %negative sign is used to Convert a Maximum value into a minimum value

end
Genetic Algorithm is used to find the Global minimum for the fitness function in the MATLAB.Our objective is to find a global maximum for a stalagmite function.It is done by using negative sign for the fitness function.so,that Genetic algorithm will find a minimum value that is the value of maximum on negative sign
Explanation
- clc,clear all,close all commands is used to clear the command window,clear all the workspace variables and close all the figure window
- linspace command is used to create a row vector for the inputs by getting a start,end and no of intervals under the command inputs
- declaring a two variables and using an meshgrid command creating a 2Dimensional array for two variables
- using a two for loops with a condition of largest length of XX and YY variable
- a row vector is assigned to get a values from xx and yy
- Each and everytime a row vector get a two new values
- A two inputs is used to call a stalagmite function
- The two for loops used to create a surface plot
- Using a one for loops with a condition to execute upto the length of the largest array dimension
- a variable declared for the function handle and Genetic Algorithm is used to find a minimum value of a fitness function in a matlab with arguments have function name and input values
Syntax of Genetic Algorithm
[x,fval,exitflag,output,population,scores]=ga(fun,nvars,A,b,Aeq,beq,lb,ub,nonlcon,IntCon,options)
fun represents a fitness function
nvars represents a no.of.variables using a postive integer
A,b represents linear inequality constraints
it would be `A cdotx<=b`
Aeq,beq represents a linear equality constraints
it would be `Aeq cdot x= beq`
lb represents a lower bound range for inputs
ub represents a Upper bound range for inputs
nonlcon represents a Nonlinear constraints
IntCon represents a Integer Variables
options represents a various options for plot,Population,selection,crossover,mutuation,fitness scaling,Multiobjective,stopping criteria,output,display,Vectorize and parallel
X represents a minimum value of fitness function inputs
fval represents a minimum value of fitness function
exitflag represents a reason for genetic algorithm stopped code
output represents a information about the optimization process
Population represents a population size by no of variables matrix
Scores represents a final scores for integer and non integer problems
These are all the syntax would be used with different no of arguments and above described with all arguments
x = ga(fun,nvars)
x = ga(fun,nvars,A,b)
x = ga(fun,nvars,A,b,Aeq,beq)
x = ga(fun,nvars,A,b,Aeq,beq,lb,ub)
x = ga(fun,nvars,A,b,Aeq,beq,lb,ub,nonlcon)
x = ga(fun,nvars,A,b,Aeq,beq,lb,ub,nonlcon,options)
x = ga(fun,nvars,A,b,[],[],lb,ub,nonlcon,IntCon)
x = ga(fun,nvars,A,b,[],[],lb,ub,nonlcon,IntCon,options)
x = ga(problem)
[x,fval] = ga(___)
[x,fval,exitflag,output] = ga(___)
[x,fval,exitflag,output,population,scores] = ga(___)
Stopping Criteria for Genetic Algorithm
Generations — Specifies the maximum number of iterations for the genetic algorithm to perform.
Time limit — Specifies the maximum time in seconds the genetic algorithm runs before stopping, as measured by tic and toc. This limit is enforced after each iteration, so ga can exceed the limit when an iteration takes substantial time.
Fitness limit — The algorithm stops if the best fitness value is less than or equal to the value of Fitness limit.
Stall generations — The algorithm stops if the average relative change in the best fitness function value over Stall generations is less than or equal to Function tolerance.
Stall time limit — The algorithm stops if there is no improvement in the best fitness value for an interval of time in seconds specified by Stall time limit, as measured by tic and toc.
Function tolerance — The algorithm stops if the average relative change in the best fitness function value over Stall generations is less than or equal to Function tolerance.
Constraint tolerance — The Constraint tolerance is not used as stopping criterion. It is used to determine the feasibility with respect to nonlinear constraints. Also, max(`sqrteps`,ConstraintTolerance) determines feasibility with respect to linear constraints.
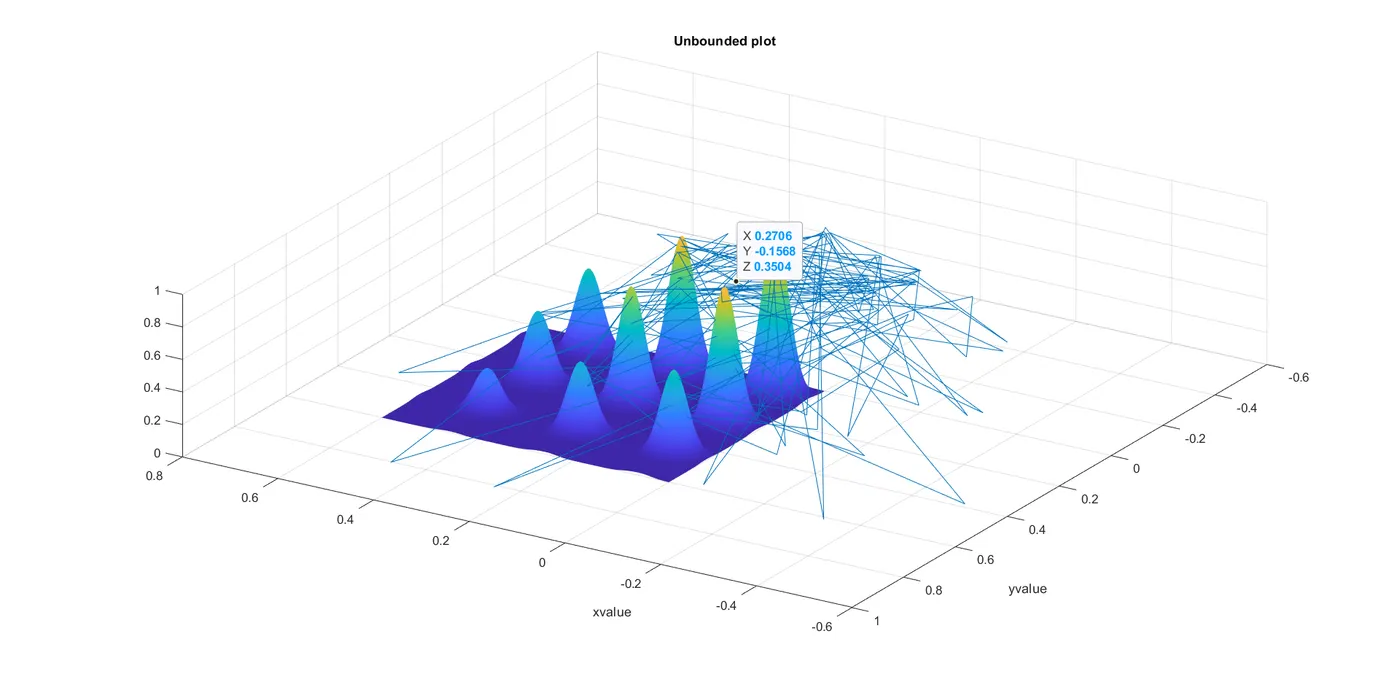
- Figure command creates a new figure that represents a surface using surface command and plot3 command represents a 3D graph using a minimum fitness function inputs and minimum fitness function values
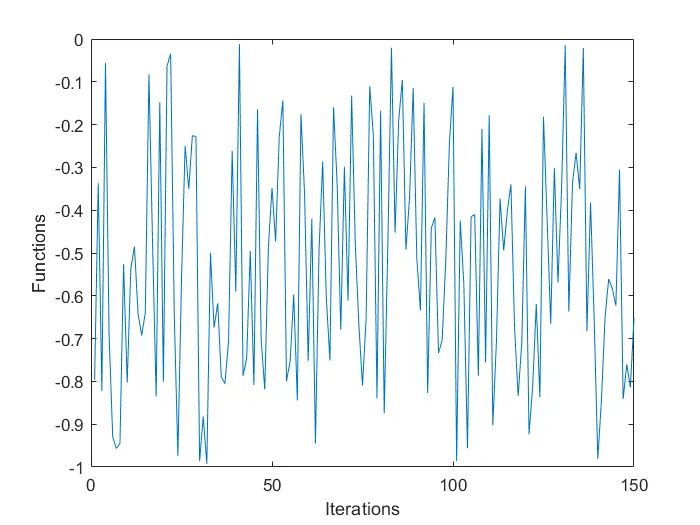
- on the second figure,the plot command is used to show the graph iteration against a function value
- on the for loop using a genetic algorithm with arguments
- arguments consist of fitness function,no.of.variables,lower bound and upper bound
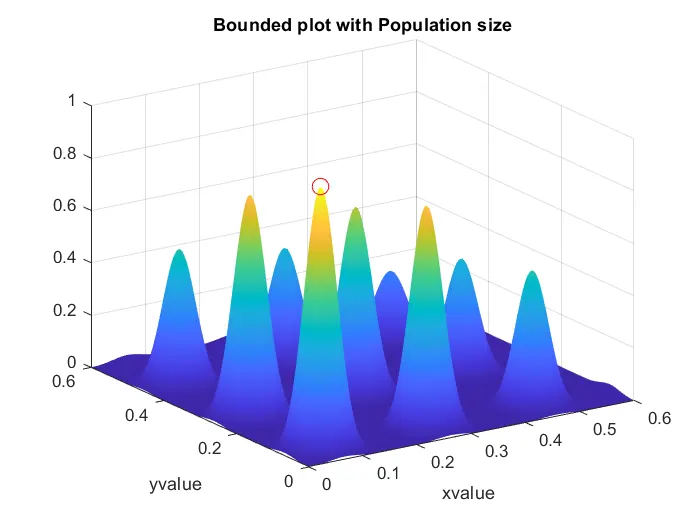
- on the third figure,it shows a surface with points that would represents fitnesss value and x and y value for each iteration
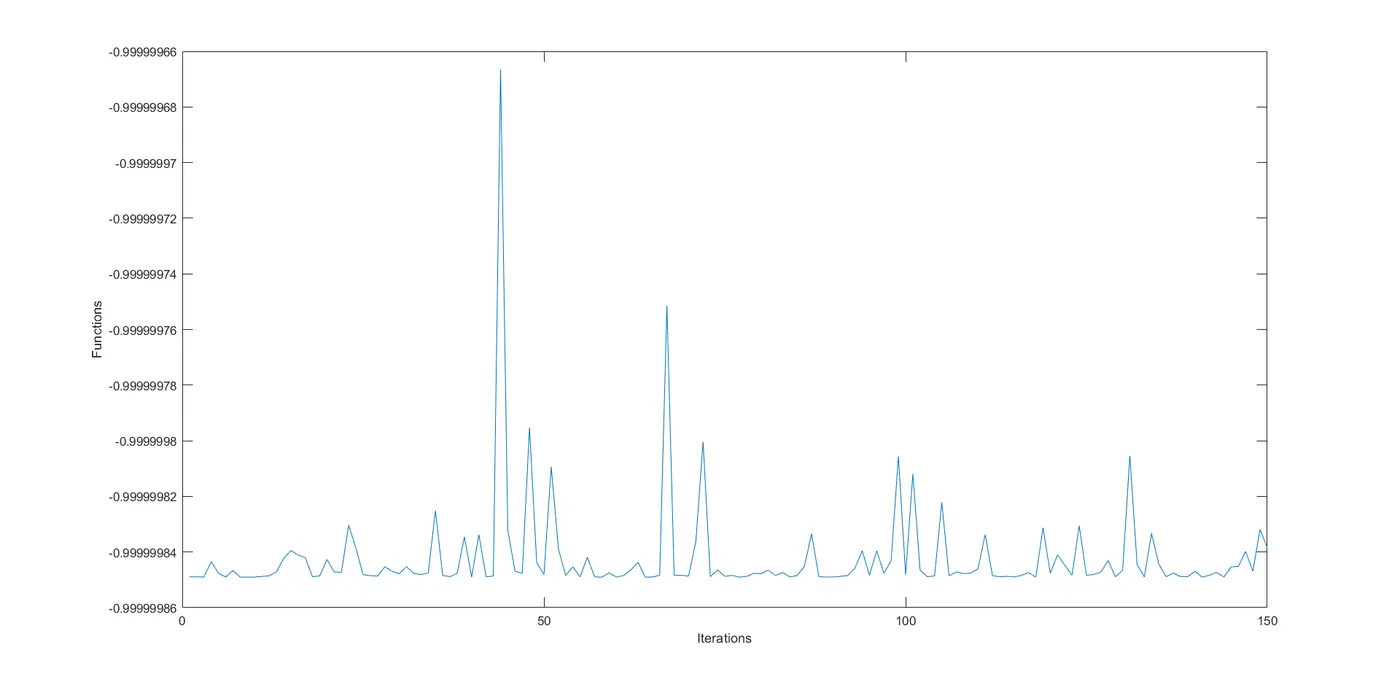
- on the fourth figure,shows a graph of bounded fitness values against iterations
- on the for loop used a Genetic algorithm with a arguments of fitness function,no.of.variables,lower bound,upper bound and options
- under the options provided a population size of 400
- on the fifth figure shows a surface with points that would represents fitnesss value and x and y value for each iteration
- on the sixth figure shows the graph between iterations and fitness values for the options with lower and upper bound
Plot
Study 1-Unbounded
Study 2-Bounded
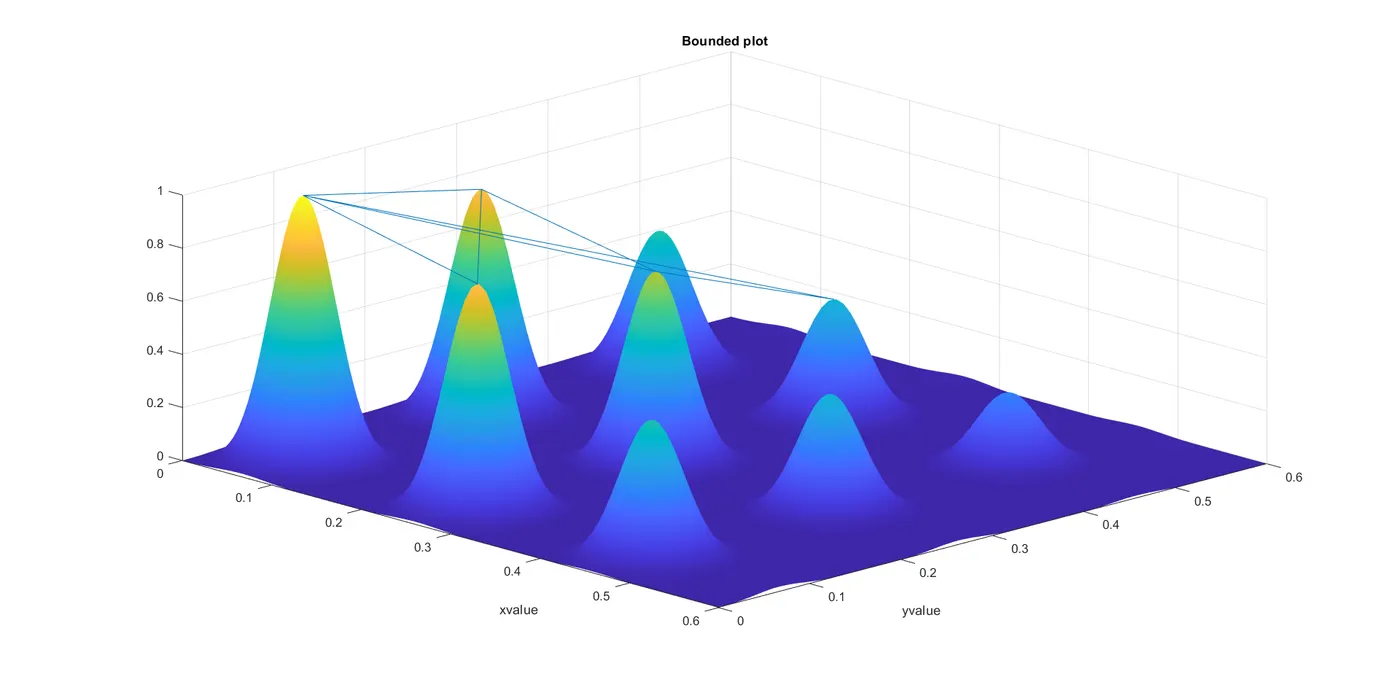
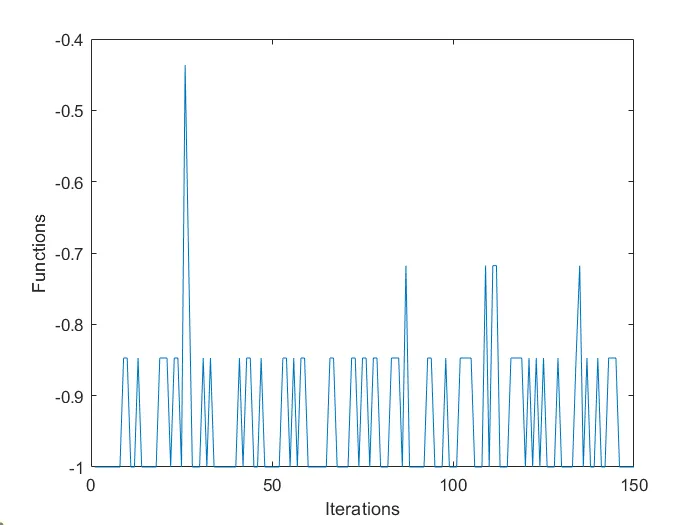
Study 3-Bounded with a population size
Error
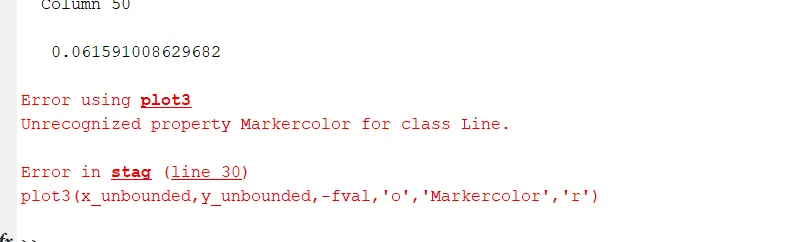
To overcome this error instead of Markercolor,need to use a color . The above error is raised because of mispelled
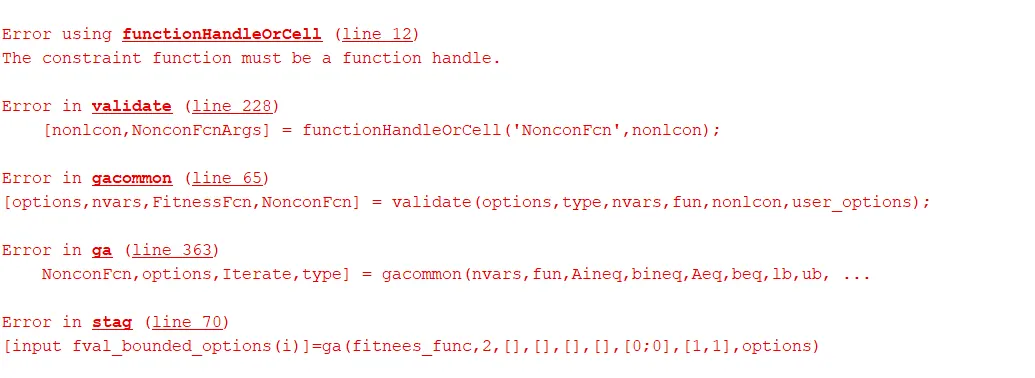
To overcome this error,In ga command after the upper bound argument there would be nonlinear constraints and then option argument.The error is raised due to wrong syntax
Conclusion
Genetic algorithm is used to find the global maximum of the stalagmite function are made and the plots for all three studies are made.