Parsing NASA thermodynamic data
Objective
write a code to parse Nasa Thermodynamic data file to evaluate a molecular weight for different species and to evaluate a thermodynamic properties such as Enthalpy,Entropy ,specfic heat for different temperature and species.
File parsing
Parsing a file means reading in a data stream of some sort and building an in memory model of the semantic content of that data. This aims at facilitating perfoming some kind of transformation on the data.
- Read the entire file into a character string.
- Split the string into a cell array of strings, with one block in each cell.
- Pre-allocate output variables based on the size of the string and the cell array.
- Loop over all blocks and parse one block at a time.
File
The Thermo.dat file consists of 14 co-efficients,name,low,high,mid temperatures for each species and it consists a global low,high,mid temperatures
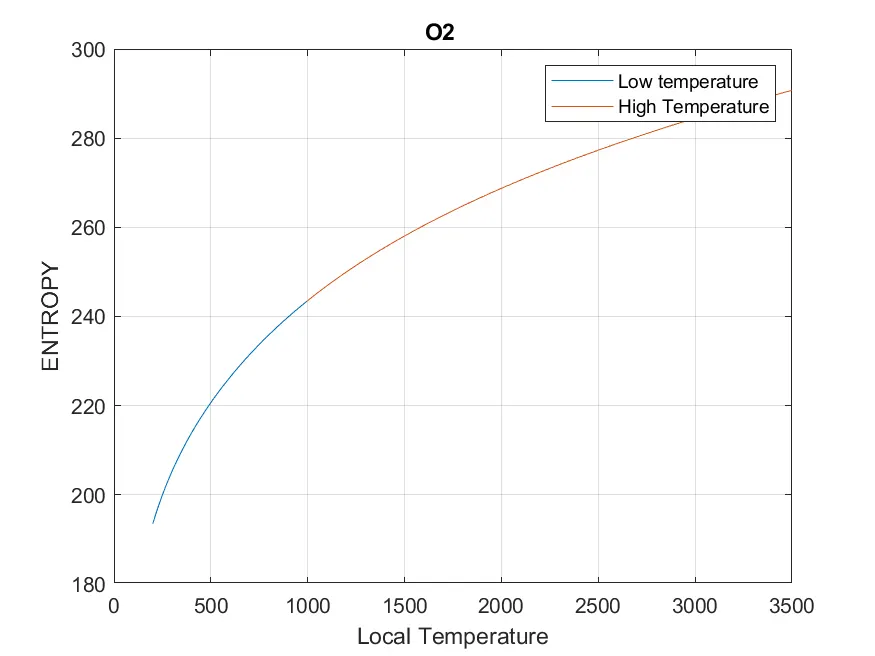
Entropy
Entropy, the measure of a system's thermal energy per unit temperature that is unavailable for doing useful work. Because work is obtained from ordered molecular motion, the amount of entropy is also a measure of the molecular disorder, or randomness, of a system.
entropy is determined by
`S=R cdot (a1 cdot lnT +a2.T+a3 cdot frac{T^2}{2}+a4 cdot frac{T^3}{3}+a5 cdot frac{T^4}{4}+a7)`
a1,a2,a3,a4,a5,a7 are the coefficients
T represents a temperature
R represents a Universal Gas constant
Coefficients are different below Mid teperature and above Mid temperature
High Temperature coefficients are first 7 coefficients and low temperature coefficients are second 7 coefficients on Thermo.dat file
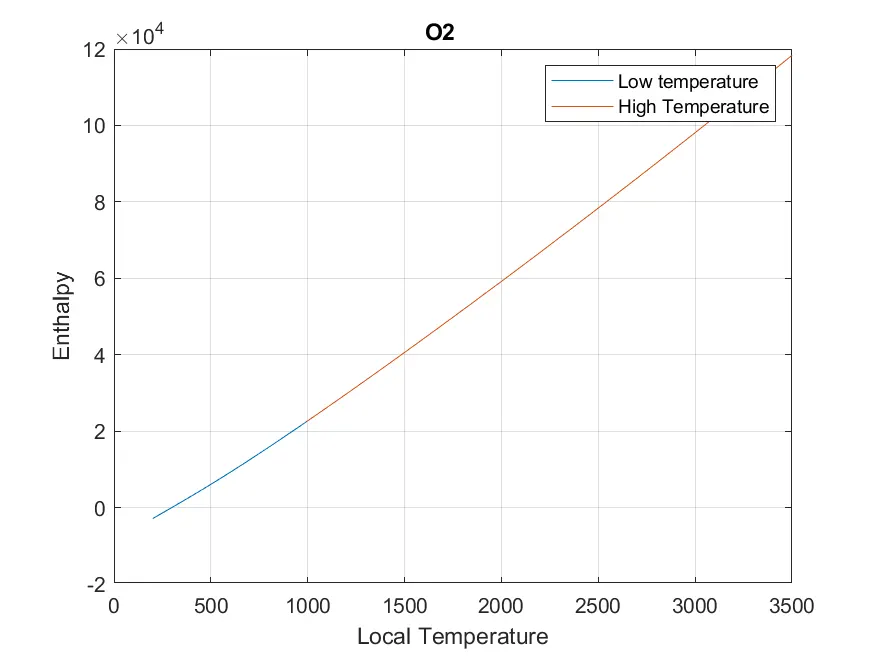
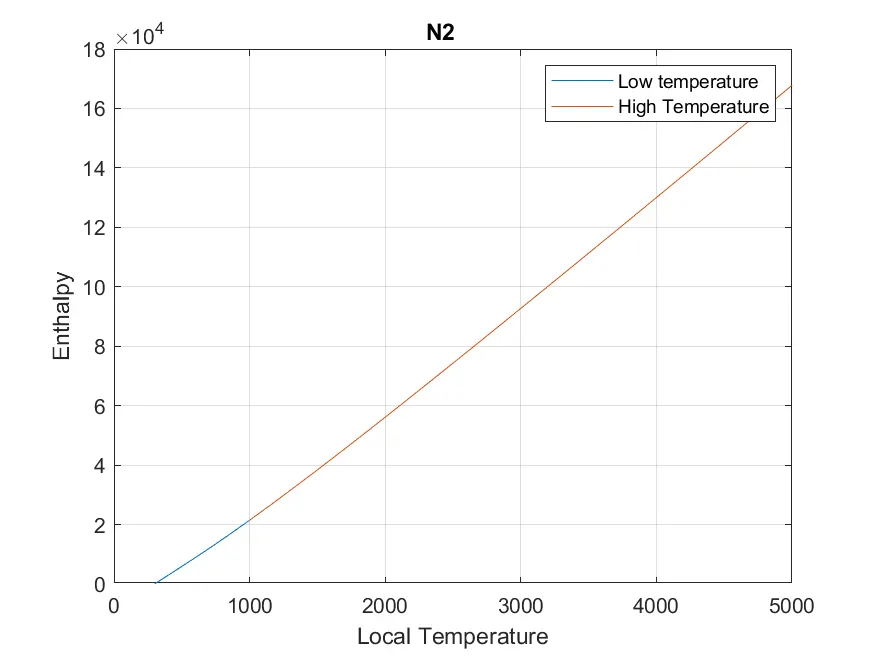
Enthalpy
Enthalpy is the sum of the internal energy and the product of pressure and volume . When a process occurs at constant pressure, the heat evolved (either released or absorbed) is equal to the change in enthalpy.
Enthalpy is determined by
`H=R cdot T cdot(a1+ a2 cdot frac{T}{2)+a3 cdot frac{T^2}{3}+a4 cdot frac{T^3}{4}+a5 cdot frac{T^4}{5}+frac{a6}{T})`
a1,a2,a3,a4,a5,a6 are coefficients different for low temperature and high temperature
R represents a Universal gas constant
T represents a temperature
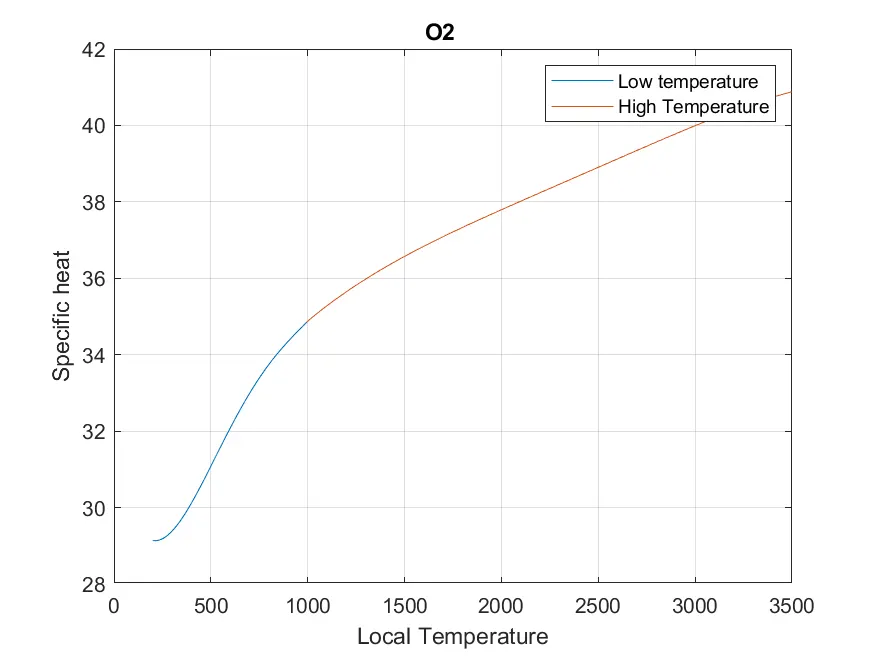
Specific Heat
Specific heat is defined by the amount of heat needed to raise the temperature of 1 gram of a substance 1 degree Celsius (°C). Water has a high specific heat capacity which we'll refer to as simply "heat capacity", meaning it takes more energy to increase the temperature of water compared to other substances.
Specific heat is determined by
`CP=R cdot (a1+a2 cdot T+a3 cdot T^2+ a4 cdot T^3+a5 cdot T^4)`
a1,a2,a3,a4,a5,a6 are coefficients different for low temperature and high temperature
R represents a Universal Gas Constant
T represents a temperature
Molecular Weight
The average mass of a molecule of a compound compared to ¹/₁₂ the mass of carbon 12 and calculated as the sum of the atomic weights of the constituent atoms
Molecular weight is determined by
`M.W=( NO.OF.ATOMS) cdot (ATOMIC MASS UNIT)+( NO.OF.ATOMS) cdot (ATOMIC MASS UNIT)..,`
Matlab Script
Main Script
clc                                                                   %clear all the previous command window
close all                                                             %close all the figure window
clear all                                                             %clear all the workspace variables

l=1;                                                                  %figure counter

File=fopen('THERMO.dat','r')                                          %opening the .dat file
for j=1:1:5
fgetl(File);                                                          %reads a line by line on the opened .dat file
end

for i=1:1:53
    First_line=fgetl(File);                                           %assigning a variable to the read line taken as string
    Species_Name=First_line(1:1:6);
    Local_Low_temp(i)=str2num(First_line(49:1:57));                   %converting a string to the number
    Local_High_temp(i)=str2num(First_line(58:1:65));
    Local_mid_temp(i)=str2num(First_line(68:1:76));
    second_line=fgetl(File);
    [H1(i) H2(i) H3(i) H4(i) H5(i)]=coefficients(second_line);        %function call
    Third_line=fgetl(File);
    [H6(i) H7(i) L1(i) L2(i) L3(i)]=coefficients(Third_line);
    Fourth_line=fgetl(File);
     [L4(i) L5(i) L6(i) L7(i) ZERO]=coefficients(Fourth_line);
     no_of_intervals=300;
    t=linspace(Local_Low_temp(i),Local_High_temp(i),no_of_intervals); %temperature array for a particular species
    for k=1:1:no_of_intervals
    R=8.314;                                                          %Universal gas constant
       Temperature(i,k)=t(k);                                         %converting a row vector into 2D array
    if t(k)<Local_mid_temp(i)                                         %Equations for low temperature coefficients
        CP(i,k)=R.*(L1(i)+(L2(i).*t(k))+(L3(i).*(t(k).^2))+(L4(i).*(t(k).^3))+(L5(i).*(t(k).^4)));
        H(i,k)=R*t(k)*(L1(i)+(L2(i)*(t(k)/2))+(L3(i)*(t(k)^2)/3)+(L4(i)*(t(k)^3)/4)+(L5(i)*(t(k)^4)/5)+(L6(i)/t(k)));
        S(i,k)=R*((L1(i)*log(t(k)))+(L2(i)*t(k))+(L3(i)*(t(k)^2)/2)+(L4(i)*(t(k)^3)/3)+(L5(i)*(t(k)^4)/4)+L7(i));
        Midcounter=k;                                                 %counter to determine a mid temperature for each and every species
    elseif t(k)>Local_mid_temp(i)                                     %Equation for High temperature coefficients
       CP(i,k)=R*(H1(i)+(H2(i)*t(k))+(H3(i)*(t(k)^2))+(H4(i)*(t(k)^3))+(H5(i)*(t(k)^4)));
        H(i,k)=R*t(k)*(H1(i)+(H2(i)*(t(k)/2))+(H3(i)*(t(k)^2)/3)+(H4(i)*(t(k)^3)/4)+(H5(i)*(t(k)^4)/5)+(H6(i)/t(k)));
        S(i,k)=R*((H1(i)*log(t(k)))+(H2(i)*t(k))+(H3(i)*(t(k)^2)/2)+(H4(i)*(t(k)^3)/3)+(H5(i)*(t(k)^4)/4)+H7(i));
    end
    end
    %Creating a new folder for each and every species
  mkdir('C:Userssai charanDesktopScriptNASA FILE PARSING3  ',Species_Name);
    %joining a two different strings
  path=strcat('C:Userssai charanDesktopScriptNASA FILE PARSING3',Species_Name);
    %Function call
  cp_h_s_Plots(Midcounter,Temperature,i,H,'Enthalpy',Species_Name,l,path)
  l=l+1;
  cp_h_s_Plots(Midcounter,Temperature,i,CP,'Specific heat',Species_Name,l,path)
  l=l+1;
  cp_h_s_Plots(Midcounter,Temperature,i,S,'ENTROPY',Species_Name,l,path)
  l=l+1;
  molecular_weight=Mol_wt(Species_Name);                              %Function call
  %Display a molecular weight values
  fprintf('Molecular weight for the %s is %fn',Species_Name,molecular_weight)

end
Coefficient Function
function [a1 a2 a3 a4 a5]=coefficients(second_line)
Counter=findstr(second_line,'E');                         %Find a letter in a string

a1=str2num(second_line(1:Counter(1)+3));                  %converting a string to number and string a contains a coefficients
a2=str2num(second_line(Counter(1)+4:Counter(2)+3));       %read a line of a determined length
a3=str2num(second_line(Counter(2)+4:Counter(3)+3));
a4=str2num(second_line(Counter(3)+4:Counter(4)+3));
if length(Counter)==5
a5=str2num(second_line(Counter(4)+4:Counter(5)+3));
else
    a5=0;
end
end
Molecular Weight Function
function mol_wt=Mol_wt(species_name)
Char_and_elem='OHCSNA';
mystruct.O=15.9994;                                                %a letter inside a string can be used as a variable
mystruct.H=1.00794;
mystruct.C=12.0107;
mystruct.S=32.065;
mystruct.N=14.0067;
mystruct.A=39.948;
Mole_wt(1)=0;
Mole_wt(2)=0;
for i=3:1:8
    for j=3:1:8
    if Char_and_elem(j-2)==species_name(i-2)
        amu=mystruct.(species_name(i-2));
        Mole_wt(i)=Mole_wt(i-1)+amu;
        mol_wt=Mole_wt(i);
        break;
    elseif species_name(i-2)=='2' || species_name(i-2)=='3' || species_name(i-2)=='4' || species_name(i-2)=='5' || species_name(i-2)=='6'
        species_name_value=(str2double(species_name(i-2)));
        Mole_wt(i)=(species_name_value*amu)+ Mole_wt(i-2);
        mol_wt=Mole_wt(i);
        break;
    elseif species_name(i-2)=='(' || species_name(i-2)==')'
        Mole_wt(i)=mol_wt;
        break;
    end
    end
    if species_name(i-2)==' '
        break;
end
end
end
Function of plots for Specific heat,Enthalpy,Entropy
function cp_h_s_Plots(Midcounter,Temperature,i,a,b,Species_Name,l,path)

  figure(l)                                                                                                      %create a new figure
    plot(Temperature(i,1:Midcounter),a(i,1:Midcounter),Temperature(i,Midcounter:end),a(i,Midcounter:end))
    grid on
    xlabel('Local Temperature')
    ylabel(b)
    legend('Low temperature','High Temperature')
    title(Species_Name)
    saveas(gca,fullfile(path,b), 'png');                                                                         %save a curent figure on a specified path with a specified name
end
Program explanation
After opening a file ,it gives a all data to evaluate a specific heat ,Enthalpy and entropy
on a file punctuation represents a comments given for four line on the second line there would be a temperatures that is global temperature
on the script,Local temperatures is used
To skip five lines used a for loop and no variable is assigned
On a thermo.dat after the five lines, the fourlines for a one species and it it will have a same patteren for another species.In that way it consists of 53 species
To evaluate,for different species used a for loop
Read a first line to get a species name and Local High,Low,Mid Temperatures
for that,first line is saved in a variable as a string and then increment index for a particular Range of the variable is assigned to another variable to get a desired one
Even a string contains a numbers to use that as a number str2num command is used
second line ,third line ,fourth line contains a coefficients.on a one line contains a five coefficients
To split a coefficients a index is determined for E by using findstr command.on that Index adding the values to get the exact coefficients as a string and it is converted to a numbers
on a fourth line there would be a 4 coefficients,to avoid a error used a if condition executes based on the length
To avoid repeating a same commands and same lines Used a function
Using a linspace command for a collection of temperatures
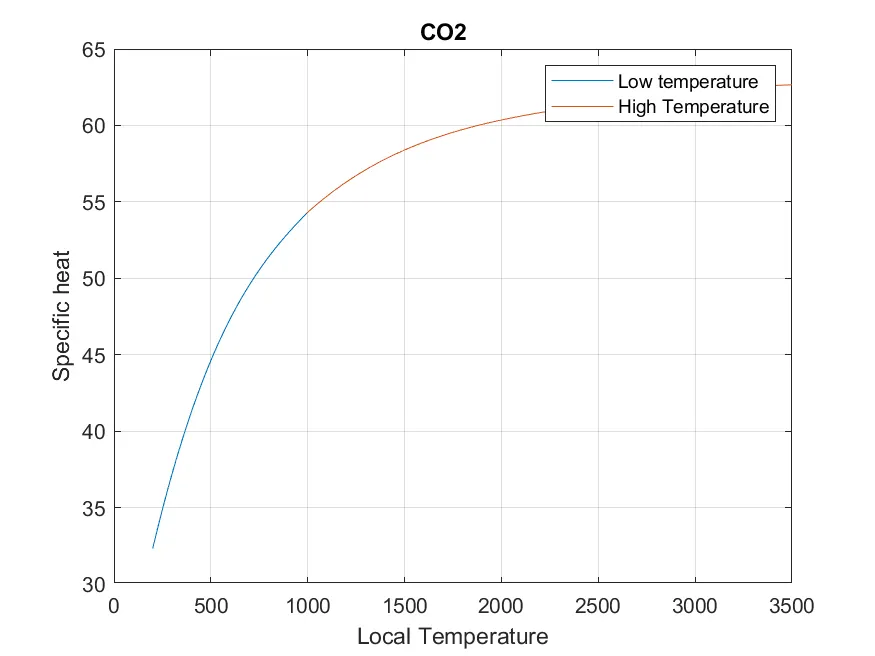
To determine a thermodynamic properties for continuously changing in temperature between a local low and high temperature
used a for loop for a different temperature and if condition to execute a different coefficients for below mid and above mid temperatures
midcounter variable is used to find a appropriate last temperature less than middle temperature to plot a differentaiting between high and low temperature coefficients
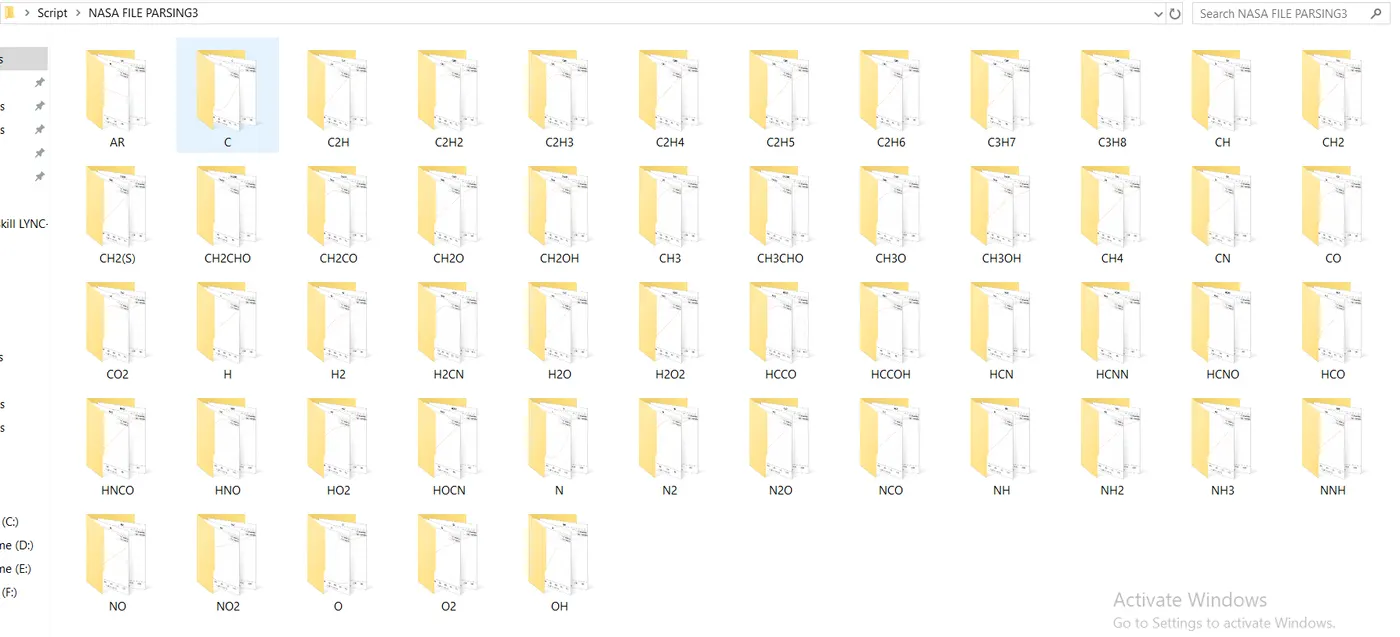
created a folder for different species at a particular folder using mkdir command
to save a figures at a specified path used a strcat to join a created folder and parent folder
To avoid repeating a same commands,used a function for plotting a graph
To get a new graph for each plots Counter l is increased by 1
under a mol_wt function Declared a different atom name under a string and the letter in a string is converted into a variable and the value is assinged to it
once a species name is passed , using a for loop to check a one letter on a string with declared string under the function using if condition and then incremented by 1 to check another letter and another else if condition is used to identify a numbers and using a molecular weight formula is calculated
if we have a letters on a string it will execute a comparision of each and every letter and it is added with a previous value
if we have a one letters and one numbers are mixed on string comparison of letter and value is compared and previous value will multiplied and then once again letter is compared and atomic mass unit will multiply with number on the string added previous second value and once executed it will come out a loop using a break command and string is empty it will comeback to the main program
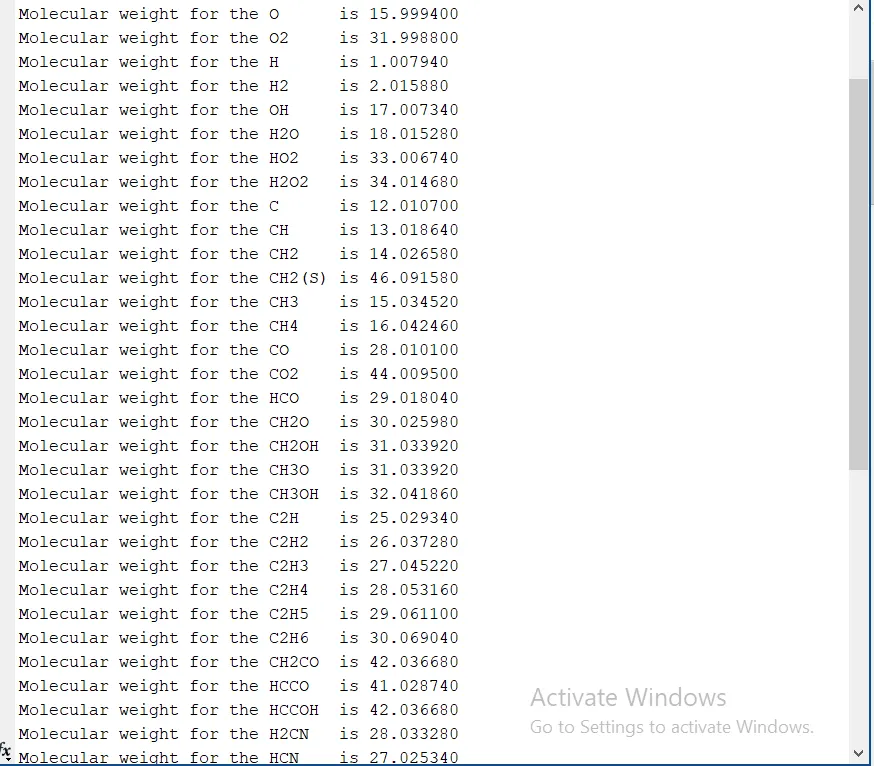
The molecular weight is printed to the command window
Plots
O2
N2
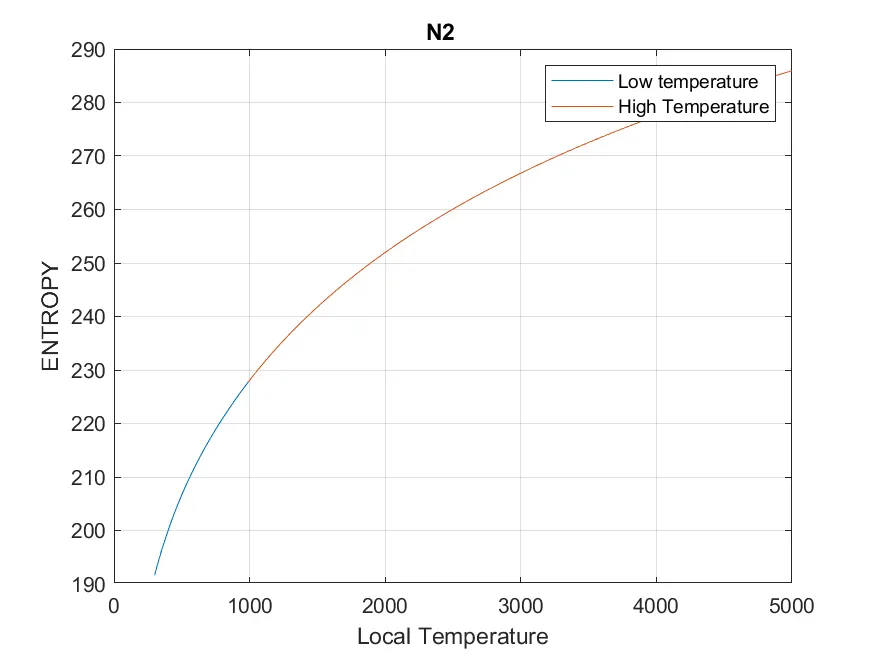
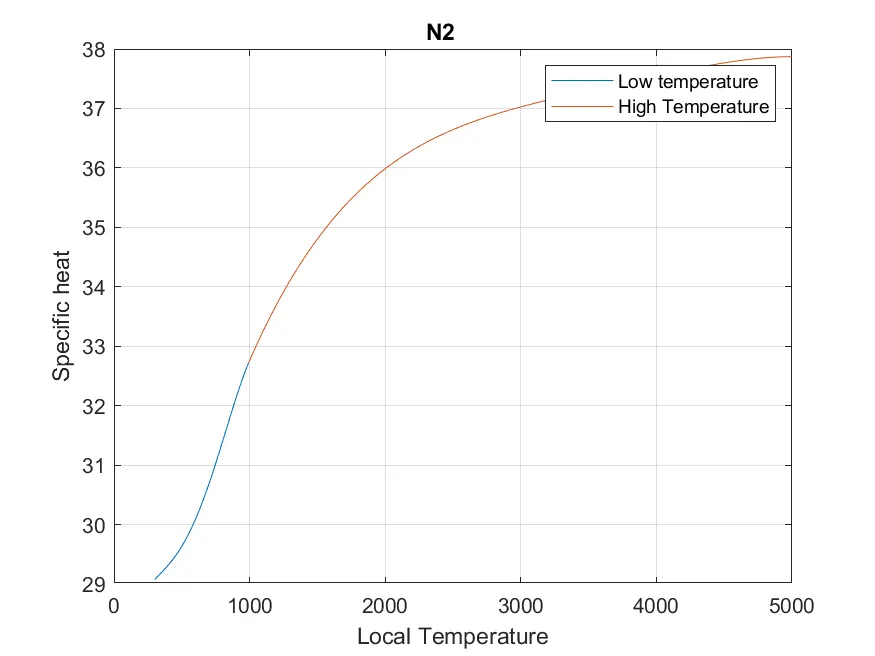
CO2
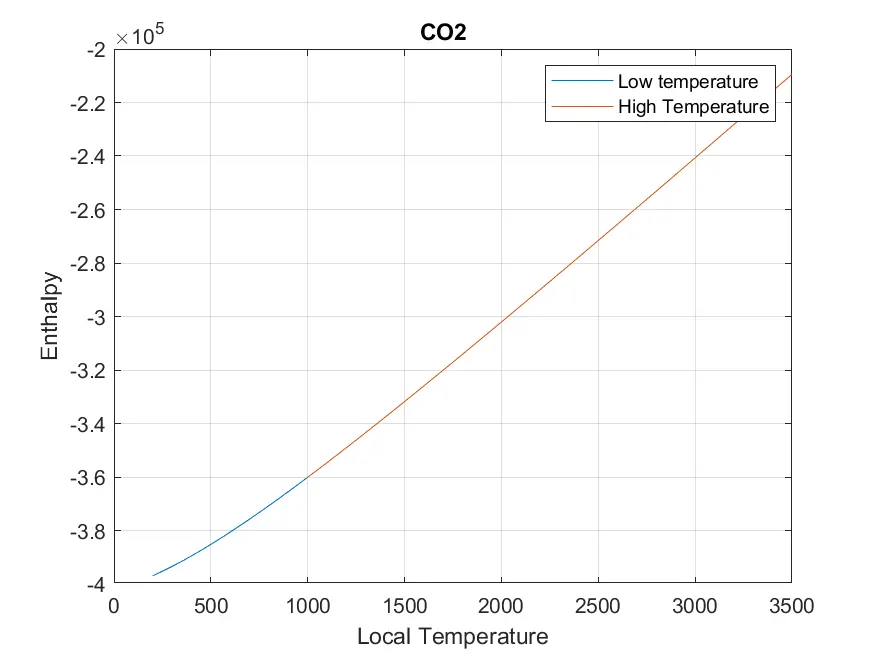
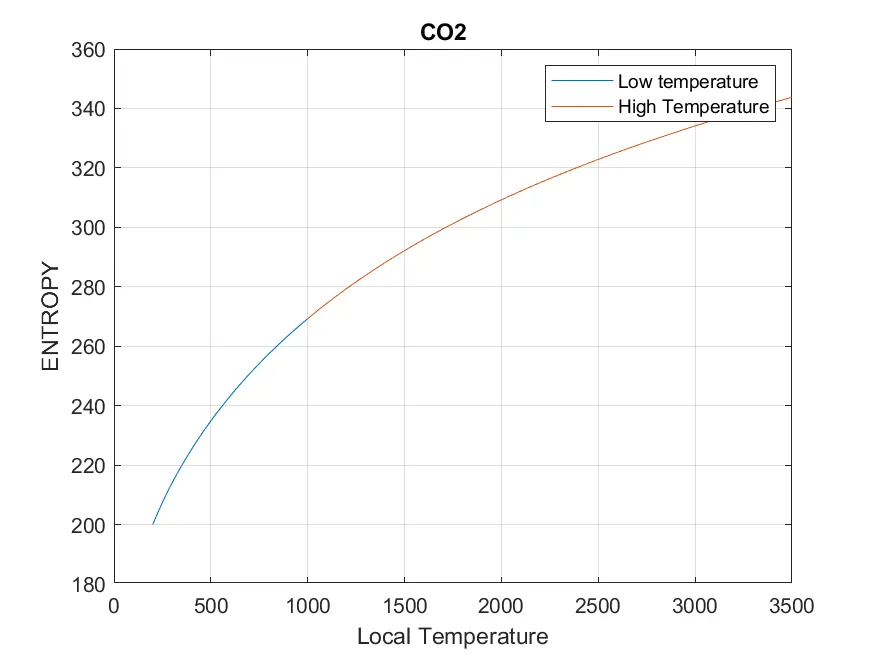
Folders
Molecular Weight
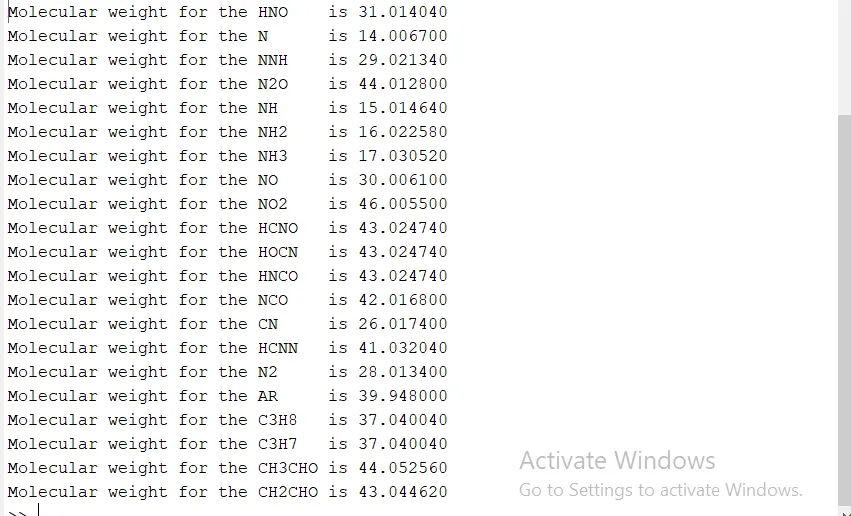
Errors
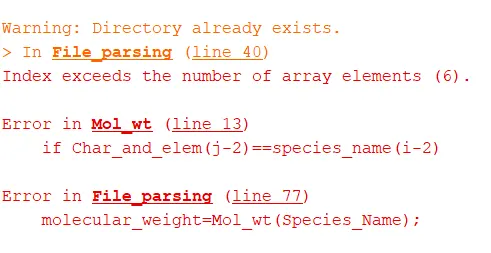
Error is thrown due to string has a 6 letters but used a index 7 on the string
Conclusion
Hence the thermodynamic properties are evaluated and a graph is plotted a thermodynamic properties against a local temperature for the different species and molecular weight for each species in the file is calculated
Here is a Google drive link contains all folder https://drive.google.com/drive/folders/1R4NC0gh9bFZCE4im7YXG9ms7wcAxNpN0?usp=sharing
References
https://www.mathworks.com/matlabcentral/answers/274746-is-it-possible-to-transform-a-string-to-a-variable-code-name-in-matlab
https://www.mathworks.com/help/matlab/ref/saveas.html
https://www.mathworks.com/help/matlab/ref/mkdir.html
https://www.mathworks.com/help/matlab/ref/strcat.html
https://www.mathworks.com/matlabcentral/answers/27899-if-statement-using-or-operator