Week 7: Shock tube simulation project
Problem:- Objective of this Challange is to set Shock Tube simulation. Plot the pressure and temperature history in the entire domain - Explain the result.Plot the cell count as a function of time - Explain the result.It is expected to show the mesh generation using PARAVIEW.
Solution :- Shock waves are formed when there is a sudden release of energy in limited space resulting in a supersonic displacement of the gas. Shock tubes are one of the easiest ways to generate good repeatable shock waves in ground-based test facilities with a good control over its parameters. A classical shock tube consists of a driver section(filled with high pressure gas) and a driven section(filled with low pressure gas) separated by a metal diaphragm. The rupture of the metal diaphragm generates a shock wave in the driven section of the shock tube.
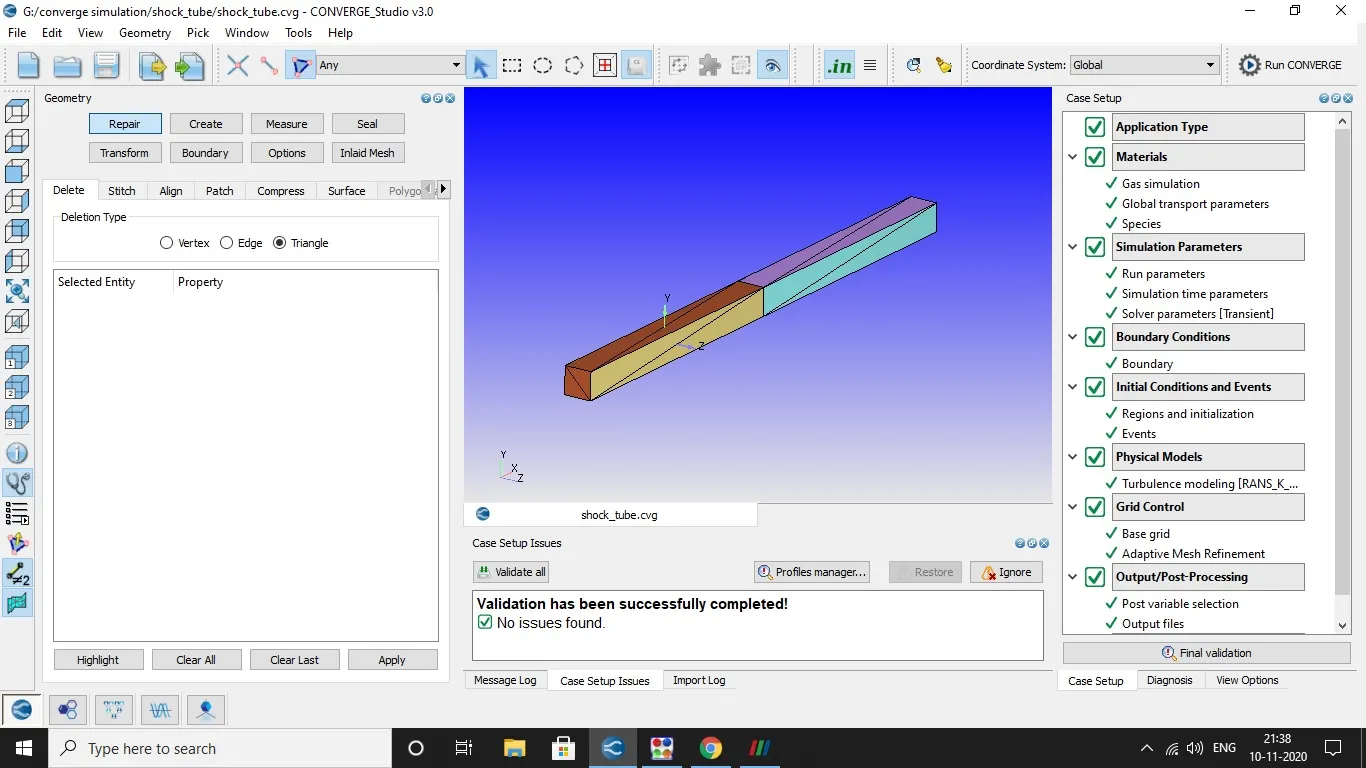
A case is setup in converge studio for shock tube simulation with geometry as shown below. There is two section of geometery, one section is set at high Pressure N2 and other section is set at low Pressure O2 region. Species used is Air.
Boundary Flagging
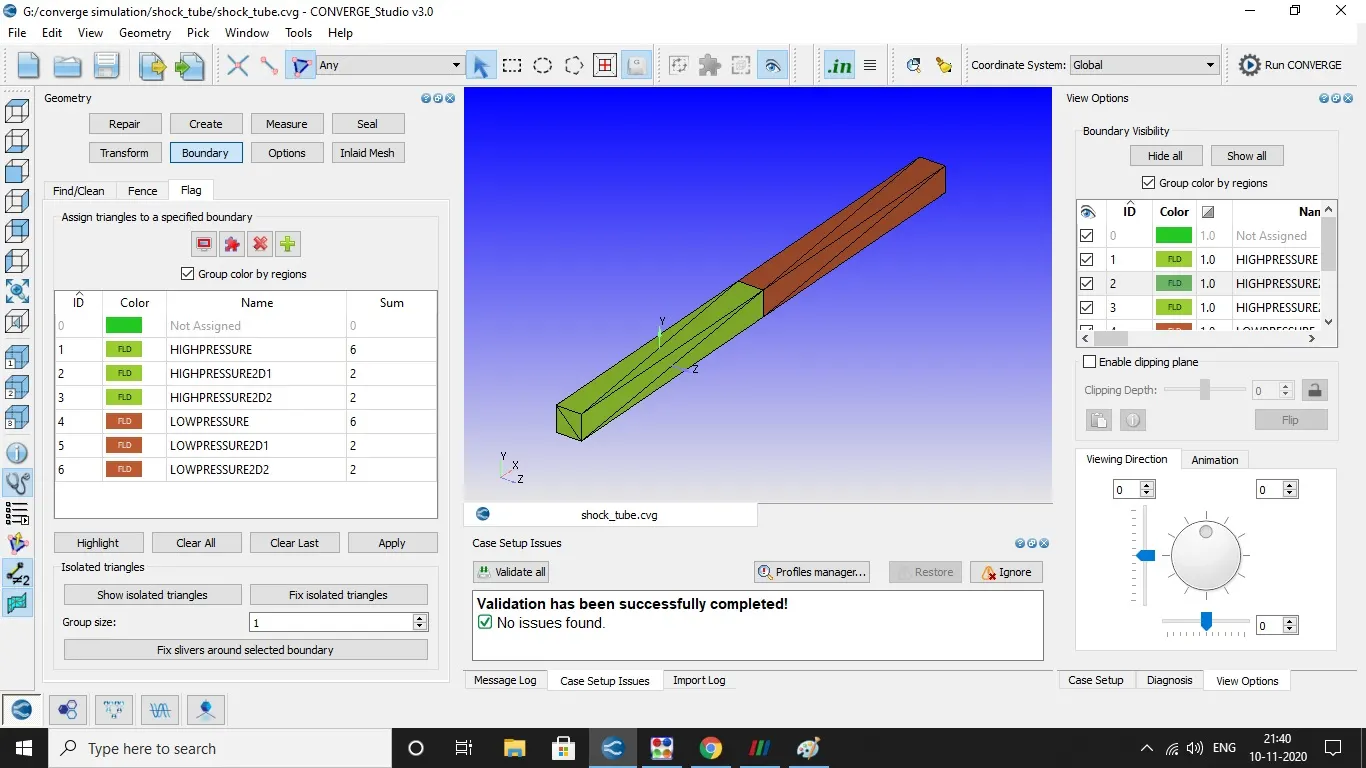
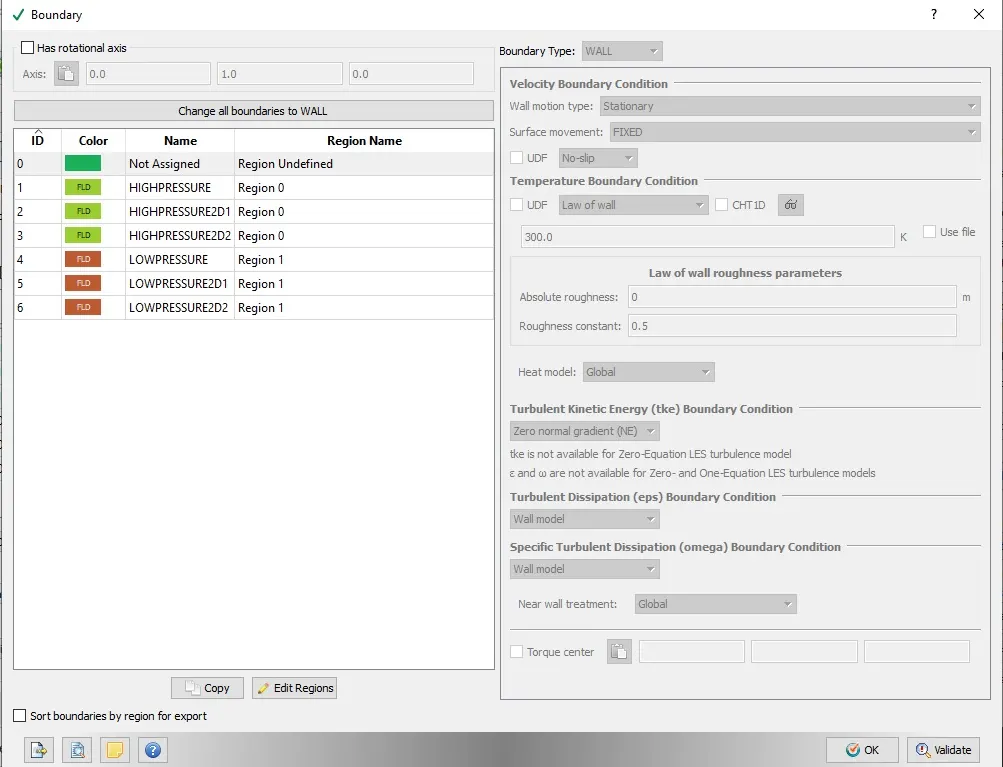
Create 6 Boundary using boundary flag option as shown below. Set Two region High Pressure and low pressure using Region and initializing option.
Create Region
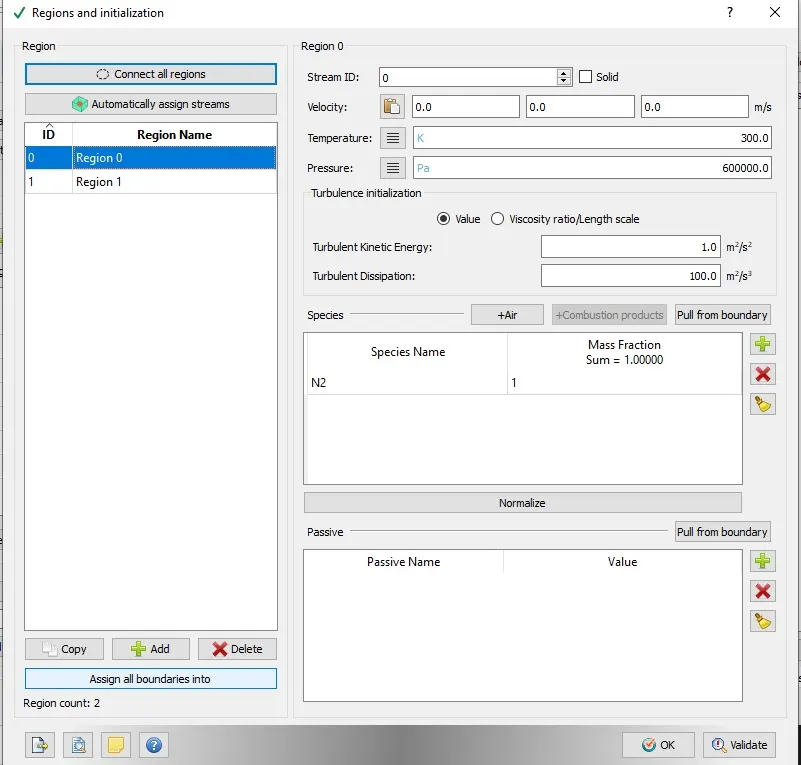
Create Region 0 as high Pressure Region with Pressure 6 Bar and Temperature with 300k and with Species N2 as shown Below.
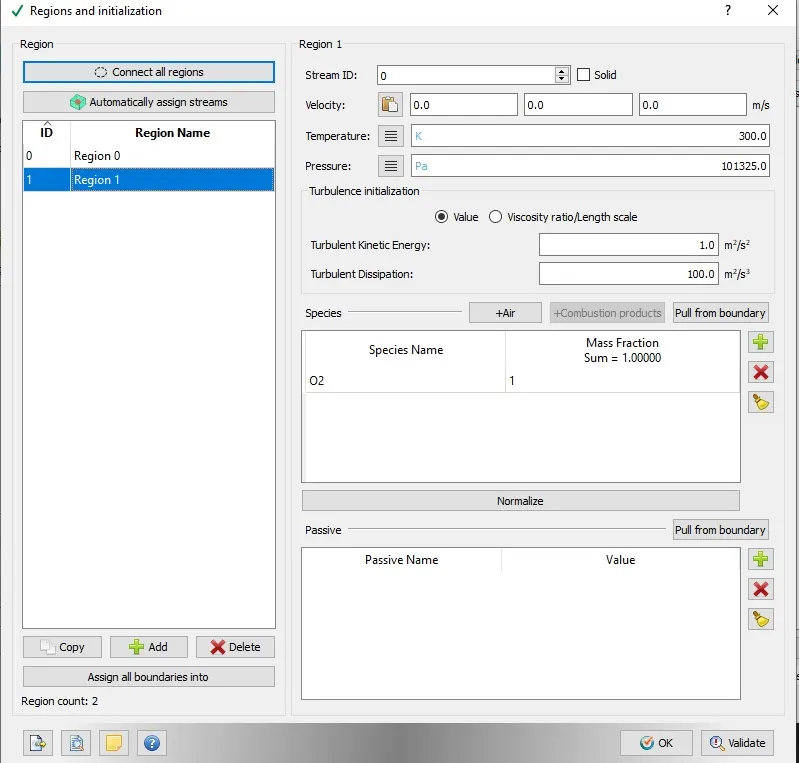
Simmilarly Create Region 1 as low Pressure Region with Pressure at atmospheric and Temperature at 300k with Species O2 as shown Below.
Boundary Condition
Set High Pressure Boundary to Region 0 and Low Pressure boundary to Region 1. High and Low Pressure to No slip and other at 2D Boundary condition
Events
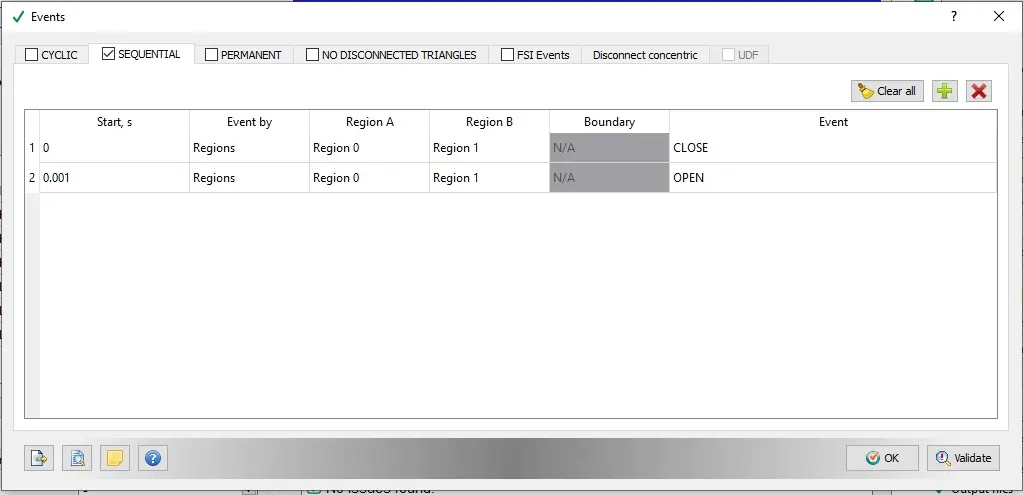
Events Created to develop Diaphram Movement.Here at 0 Sec Event is at close Position,it means High Pressure and low Pressure region is Separated by Diaphram. At 0.001 sec event is at open position,it means that Diaphram is Ruptured and High Pressure N2 gas move toward low Pressure O2.
Grid Control.
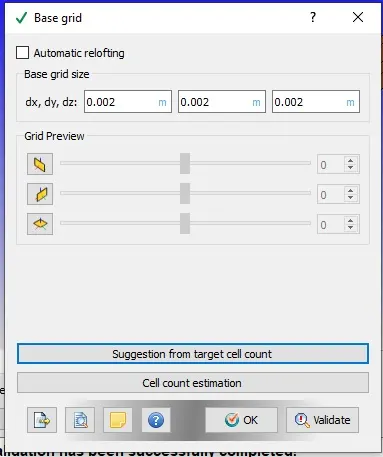
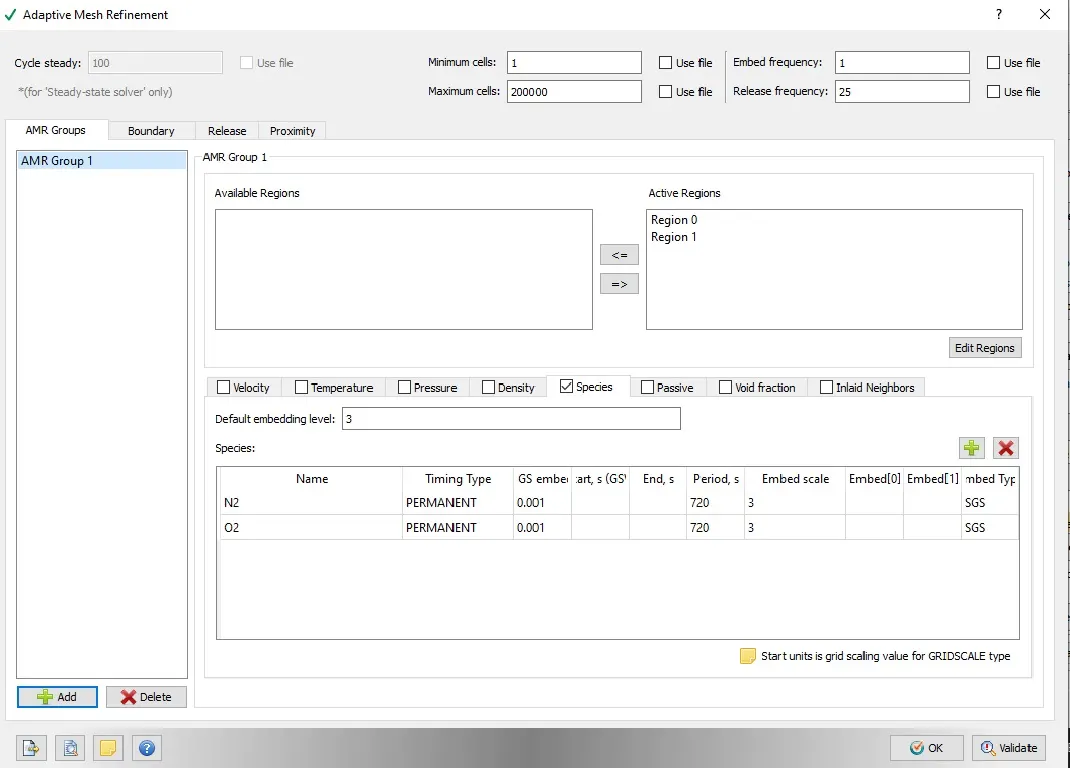
Set Grid size dx=0.002,dy=0.002 and dz=0.002. and Apply Adaptive mesh Control with option Species,it will refine mesh with movement of Species mass Fraction 0.001 for region0 and Region1 as shown Below.
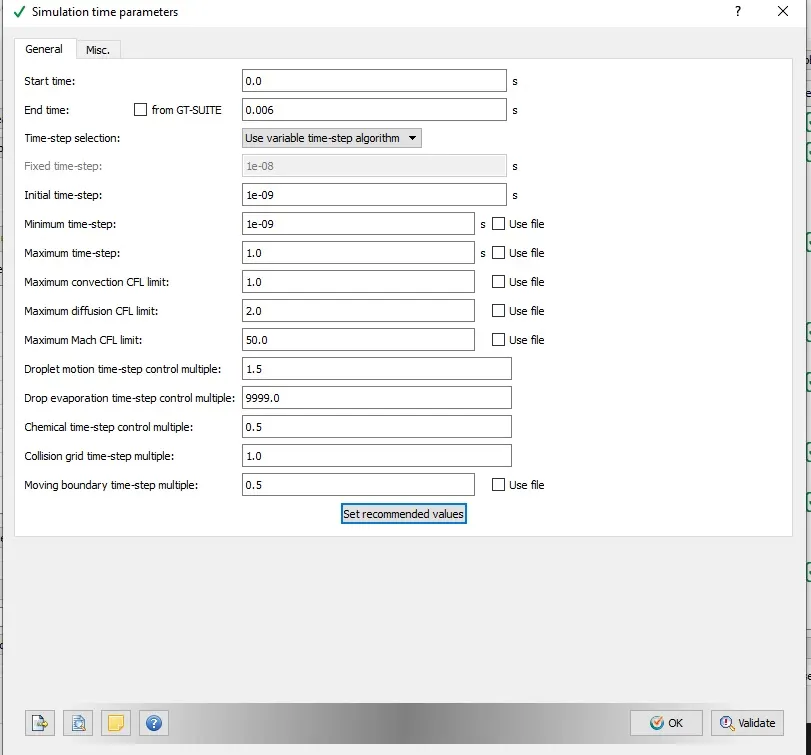
Simulation Time Parameter
Start Time:- 0 Sec
End Time:- 0.006
Initial Time Step:- 1e-9
Minimum Time Step:- 1e-9
max time Step:- 1.0
Max convection CFL Limit:- 1.0
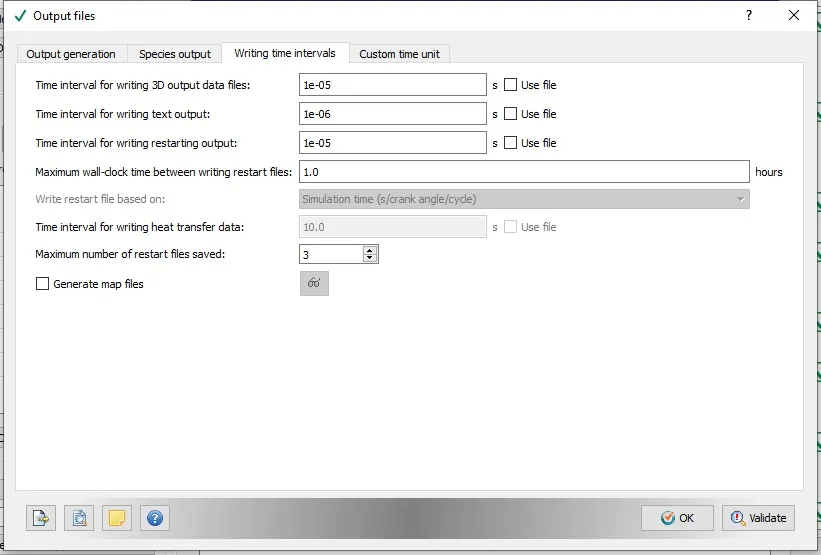
Output file
Set interval for Writing 3D Output data files = 1e-5
Time interval for writing text output= 1e-6
Time interva; fpr writing retarting output= 1e-5
Cygwin and 3D Post out file
Run output files in cygwin and with help of Converge Studio generate 3D output file in binary vtk option and open this output files in Paraview.Paraview is open source which show results of case Setup.
Results
Mesh in Paraview
At Time Frame =25
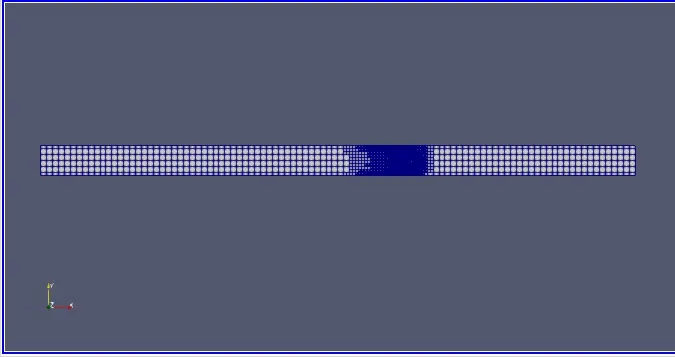
Embedding level of 3 show that mesh is refined at three sub grid level as shown Below.
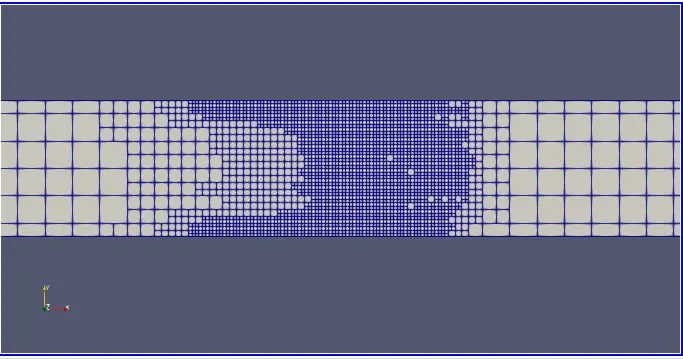
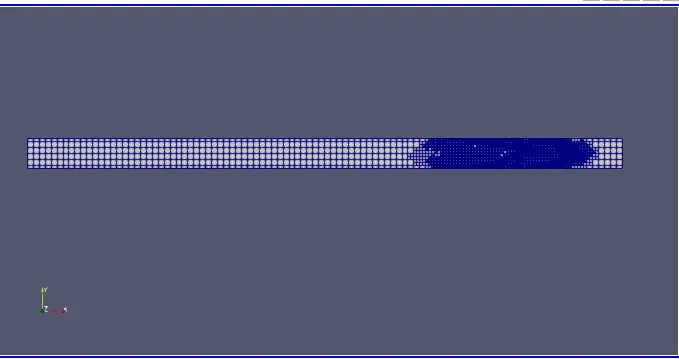
At time frame =30.
Show that as N2 moves in low pressure zone AMR help to refine mesh size with movement of N2 and give Accurate Result.
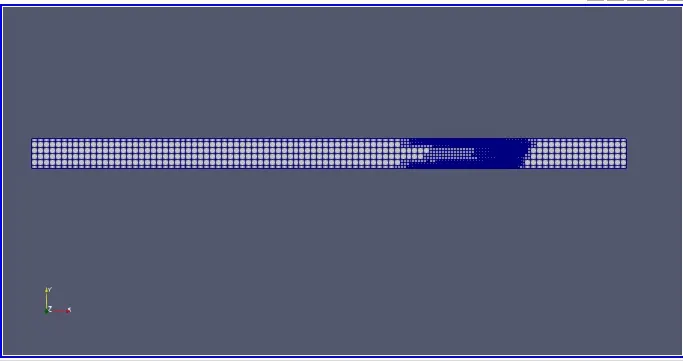
At Time Frame =40
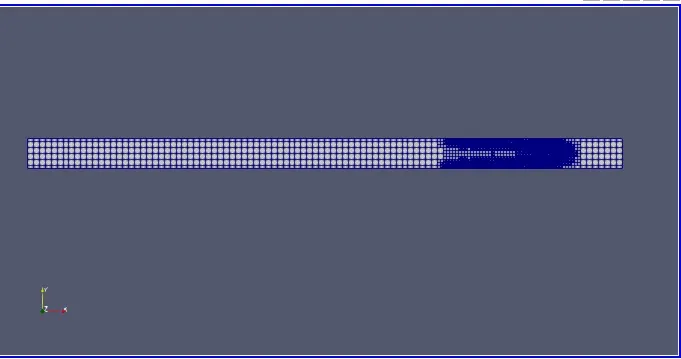
At Time Frame =50
As shock waves reflected and move in backward Direction.Mesh refinement is created in backward Direction.
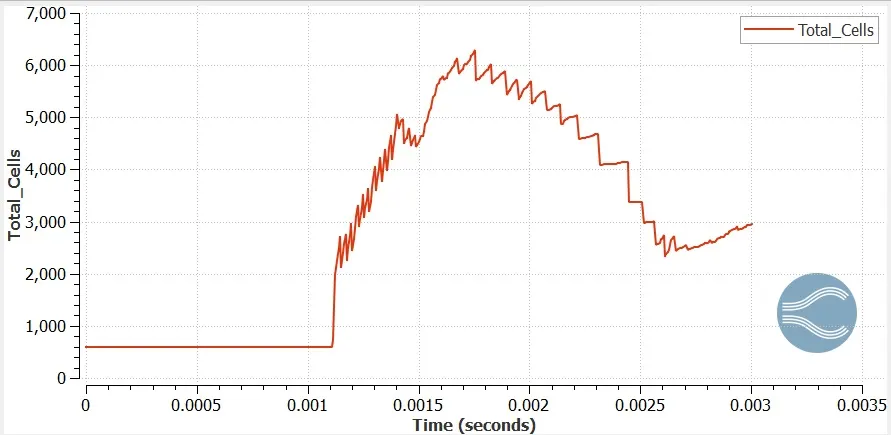
Cell Count
AS shown Below, after 0.001sec when Driver gas move toward Driven Section.AMR will increase cells to get accurate Results as shown Below.
Line Plots
Mean Temperature
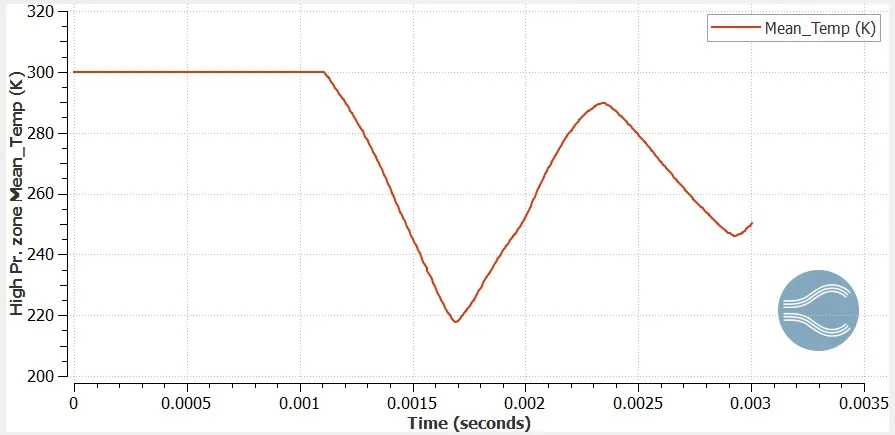
As shown below Line Plot of mean Temperature of High Pressure zone Region 0. After 0.001, when diaphram Repture , High Pressure N2 will Rush toward Lower Pressure zone, First Temperature will be Decrease and after Reflection of shock waves, again temperature will Decrease.It will follow sinosudal curve and decay to get converge value of Temperaure.
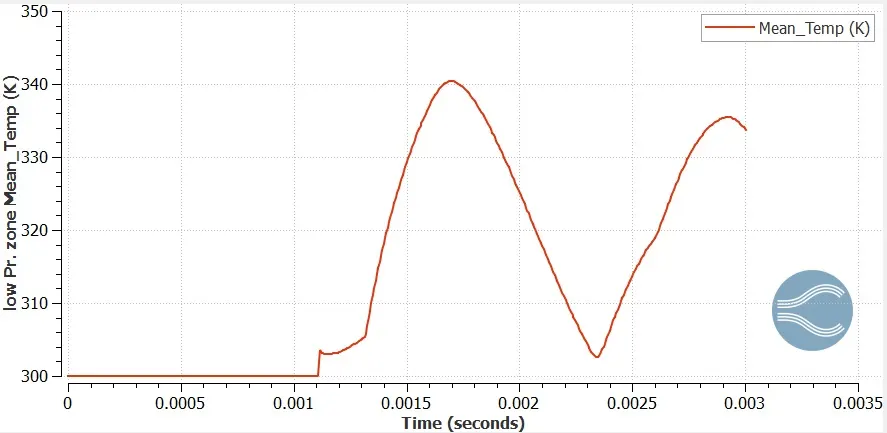
simmilarly in Low pressure zone,Temperature from 300 k increase to value of 340 k as Driver move toward driven and after reflecting of shock wave temperature will be decrease and as movement of shock wave in to and fro direction, Temperature will also follow sinusoidal movement and slowly decay to get Converge value.
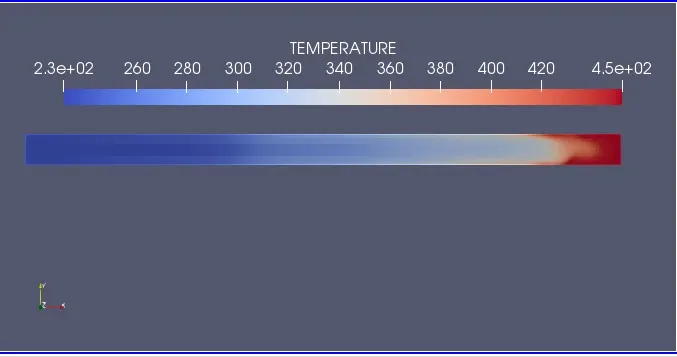
Temperature Profile in Paraview
Pressure
It is clearly shown from graph that as N2 move toward low Pressure o2 zone, Pressure will increase and after deflection backward Pressure will be decrease.
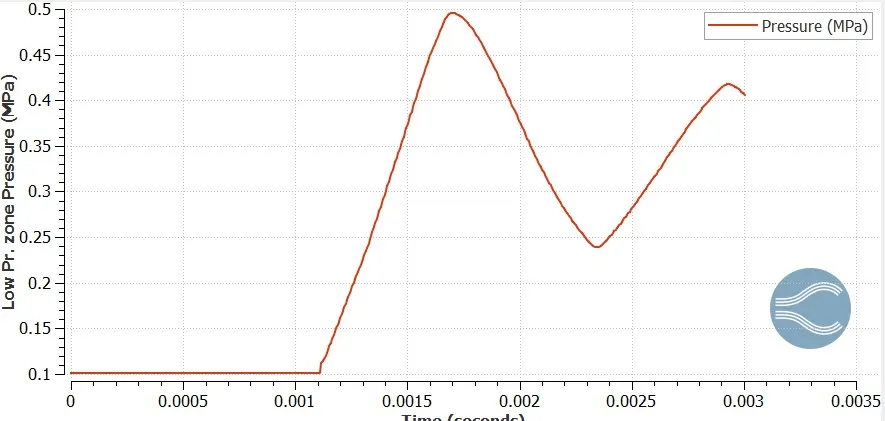
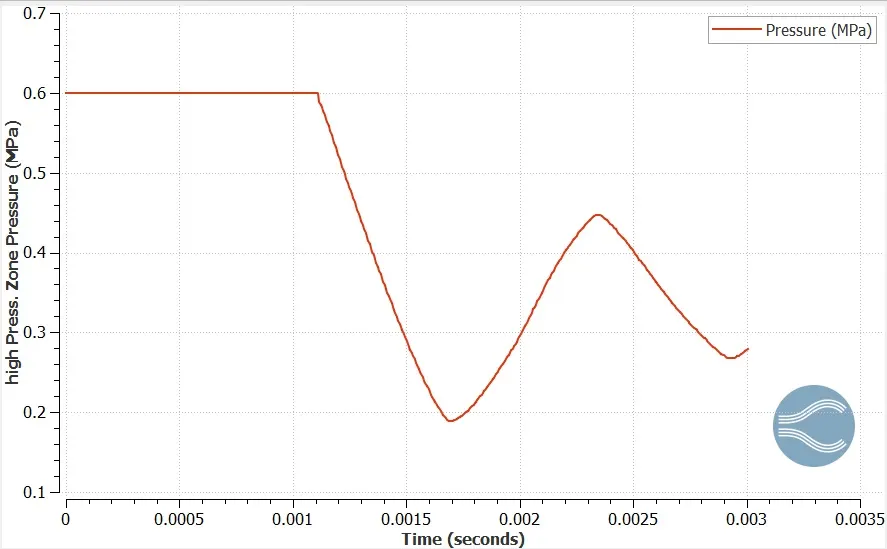
It is clearly shown from graph that as N2 move toward low Pressure o2 zone, Pressure will decrease in Region 0 and after deflection backward Pressure will be increase .Slowly it will attain constant value when both region will be at equilibrium.
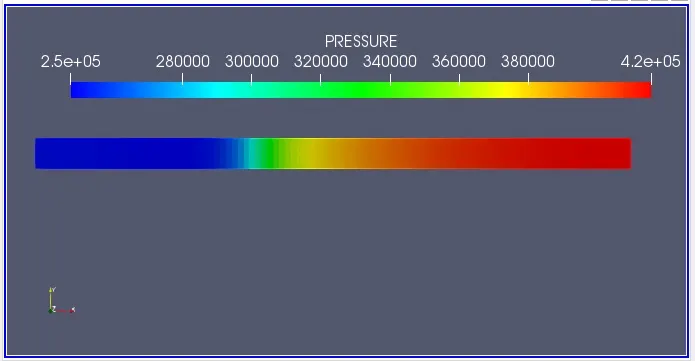
Pressure Profile in Paraview
Conclusion
(1) when diaphram will Burst and High Pressure N2 move Towards Low Pressure O2, first Both Temperature and Pressure in Low Pressure Region 1 will increase and both temperature and Pressure in High Pressure region 0 will decrease.
(2) After Reflection of shock waves, Pressure and Temperature in Region 1 will decrease and increase in Region 0. Thus follow Sinusoidal Movement till it acquire equilibruim State.
(3) Amr with species option Help in refinement of mesh with Movement in Fractions of N2 and O2. It helps to get more accurate Results.