Week 4: Project - Transient simulation of flow over a throttle body
Problem:- Create Transient state flow simulation over throttle body and create velocity, pressure, mass flow contour and line plotings and show animation of throttle valve.
Solution:- Set up case study of flow over throttle valve in transient state. Transient solver is used when there is movement in a body over which flow is flowing.
Species - Air
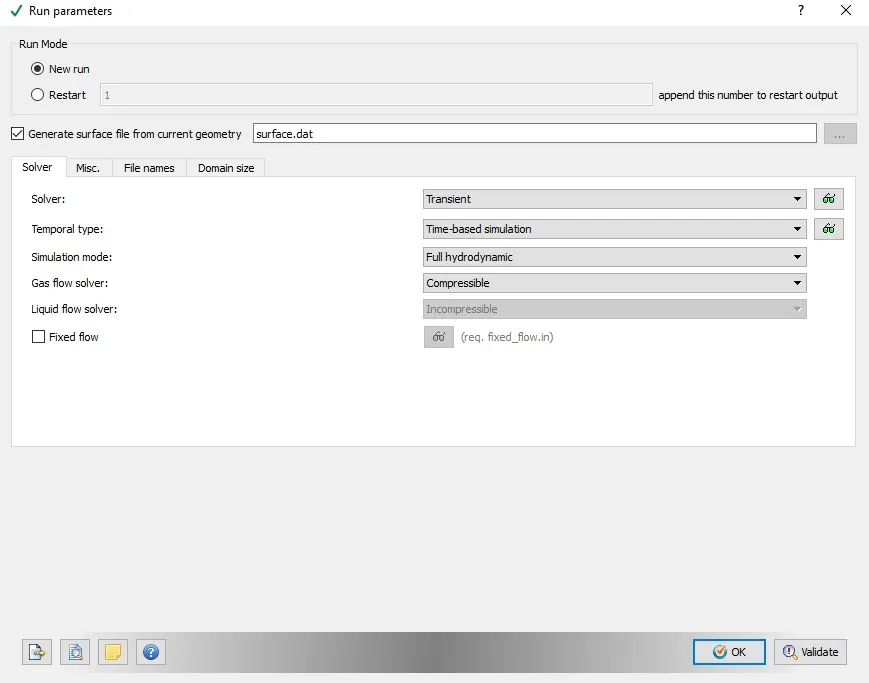
set Run Parameter solver at triansient and Simulation mode at full Hydrodynamic so it consider also species properties and give results while running simulation.
Simulation Parameters
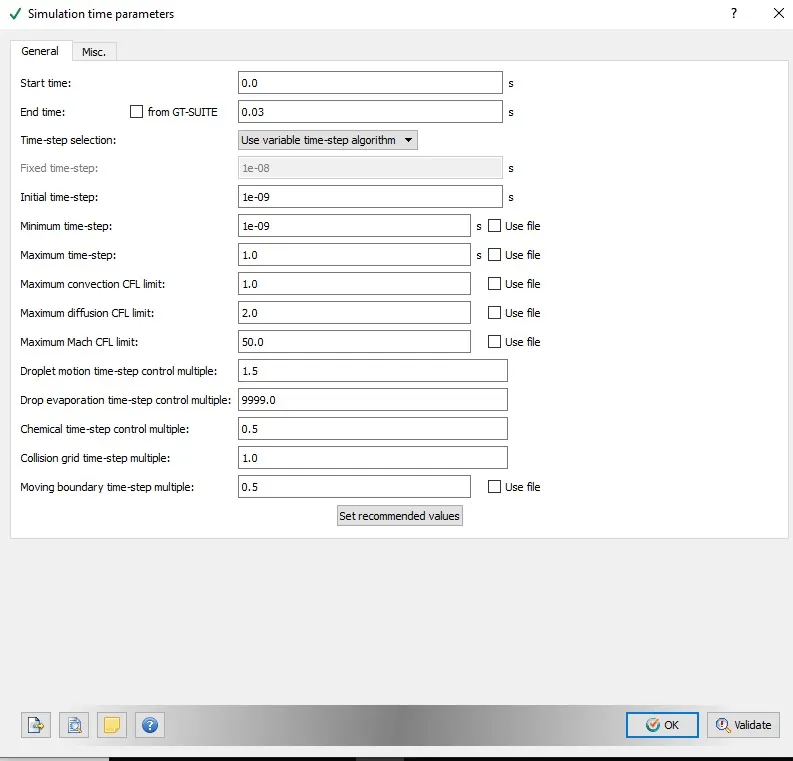
Set Initial start time:- 0 sec
End time:- 0.03Sec
Intial time step:- 1e-9
Minimum Time step:- 1e-9
minimum time step:- 1.0
Maximum CFL Limit:- 1.0
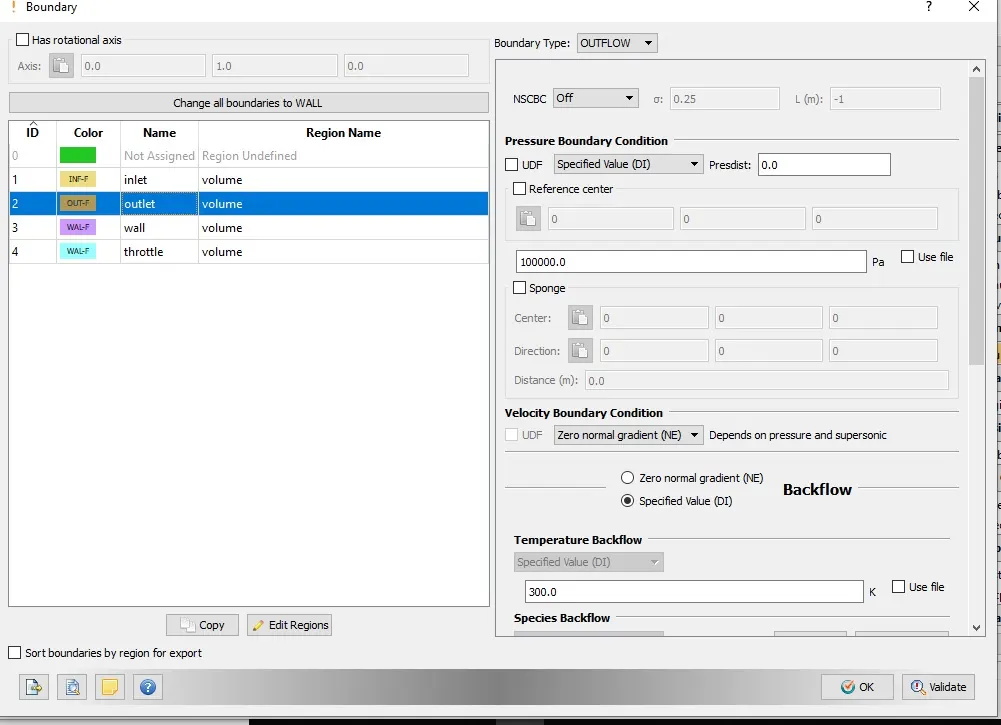
Boundry Conditions:-
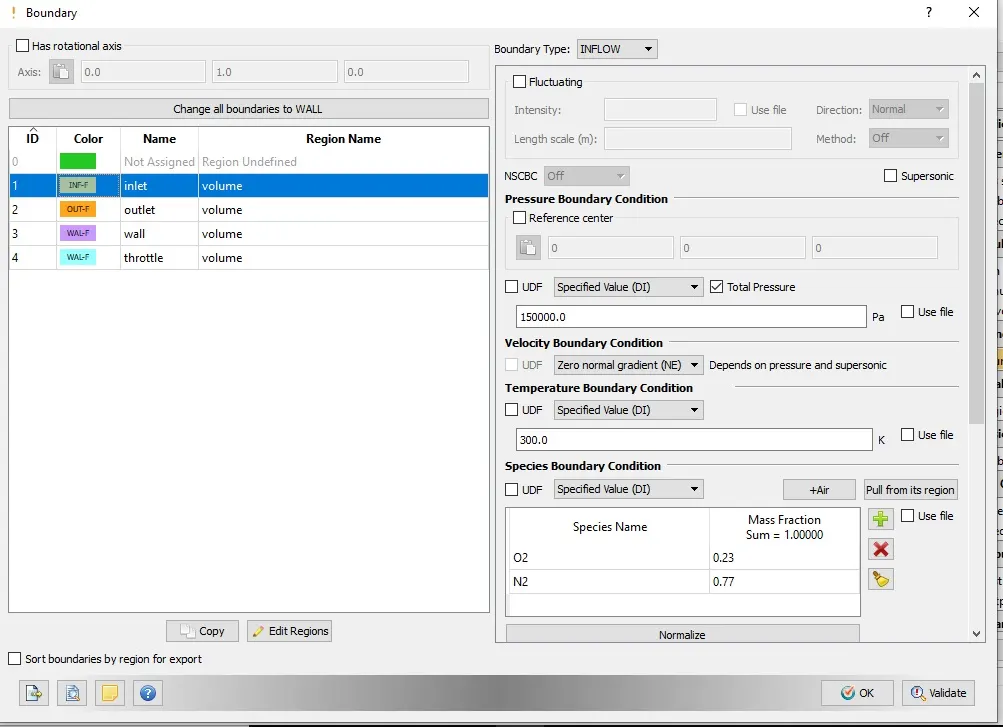
Inlet Boundry Condition:- 1.5 Bar
Temperature boundry condition:- 300k
Boundry Conditions:-
outlet Boundry Condition:- 1.0 Bar
Temperature backflow:- 300k
Wall
Set wall at law of wall and Temperature boundry consition at 300k
Throttle
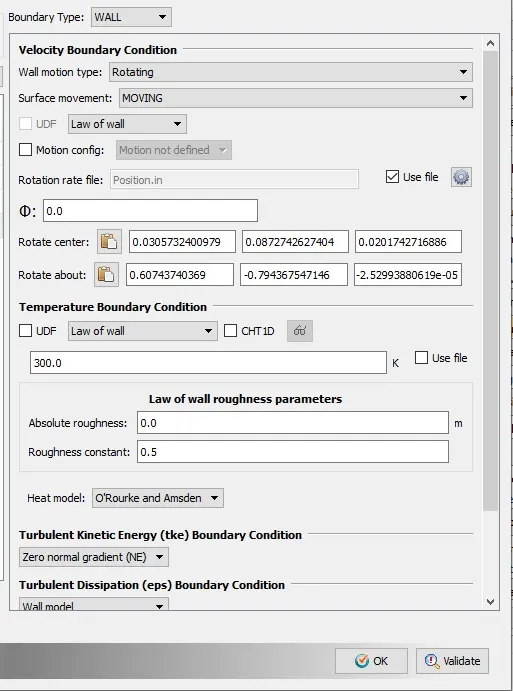
we set movement of Throttle valve by controlling angle of rotation of valve. To create movement of throttle set wall motion type at Rotating and Surface Movement at moving. Now we have to define three parameters one is Rotation Center, Rotation Axis and Rotation Angle.
To get Rotation Center and Rotation Axis. Click on measure tool and then Direction Icon in which click on Arc Normal Option. Then click on three point on Throttle Cylindrical body about which throttle will Rotate.It will give coordinate of Rotation Center and Normal vector with respect to WCS. Copy these coordinate and Paste in rotation center and Rotation about as shown below.
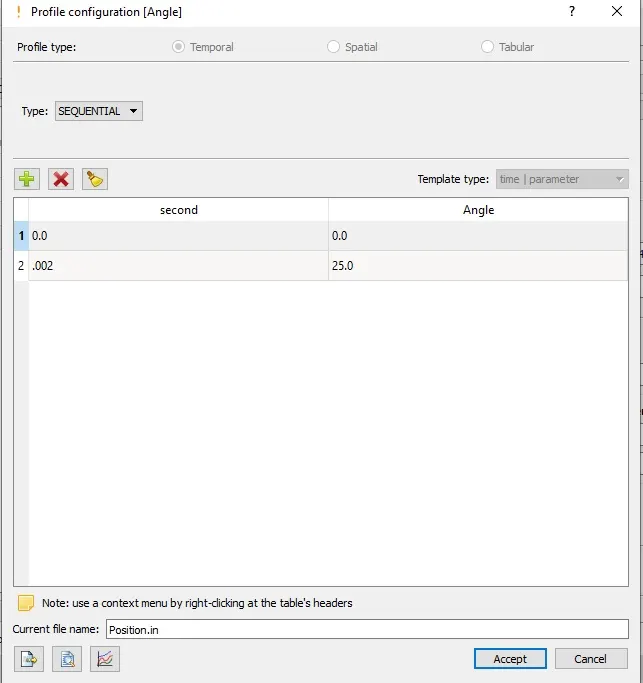
In option Rotation rate file click on Setting and Profie configuration (Angle) menu will open. we will create .in file in which define Rotation of valve with respect to Second as shown Below.
Grid control and fixed Emedding
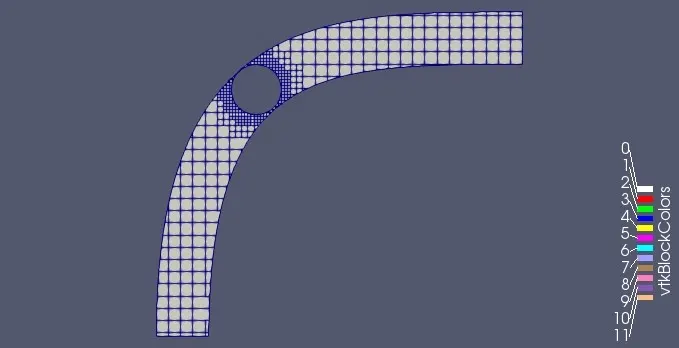
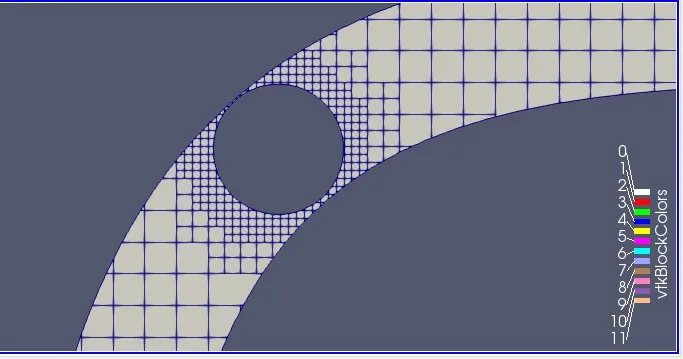
Set Base Grid size to dx=0.004,dy= 0.004 and dz= 0.004. Click Option Fixed Embedding to refine mesh size over Throttle body to get more precise result. fixed emedding option reduce mesh size over throttle body region and increase cell count as shown in Results.
Output file
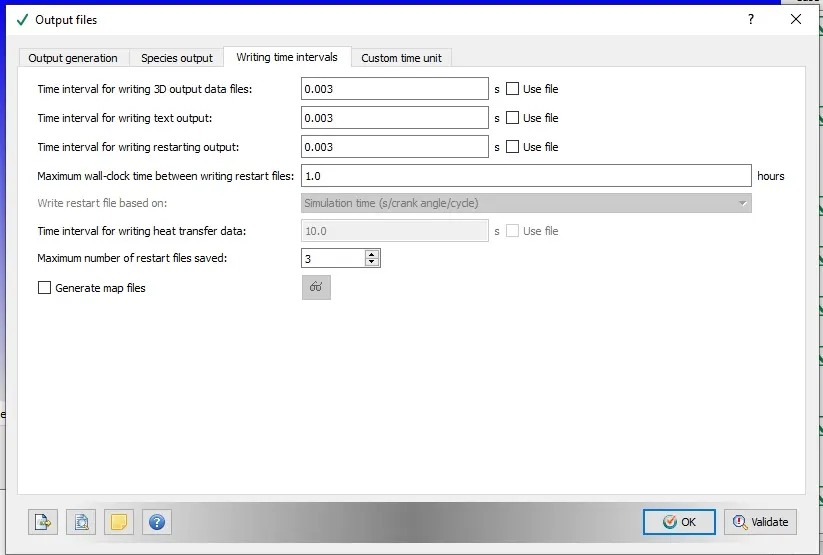
We will create at least 10 Post.out files while running simulation in Cygwin. so set time interval for writing 3D output data file is 0.003 as intially we set end time is 0.03.Rest of settings are giving below.
Cygwin and Paraview
Export file from converge setup and Run these files in Cygwin to create output files. Call these output files in converge Post Process 3D interface and create .vtm file. Open this .VTM file into paraview and make section view. it is open source which will show Results of simulations.
Results
As shown Below in paraview we can check Mesh pattern. Due to fixed embedding option cell count near throttle body is increased and Reults will be improved and precise.
Glyph
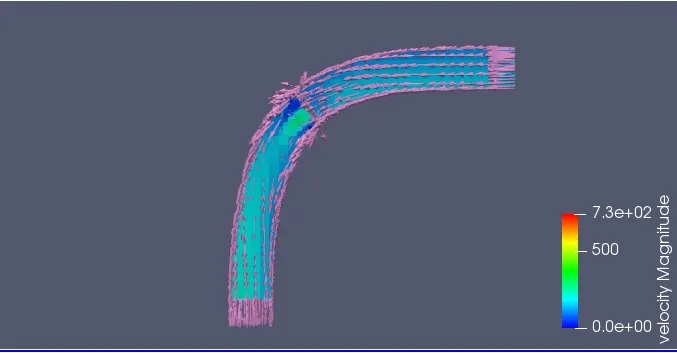
Click on Glyph and Set to velocity parameter. it will help to analyse flow through pipe is ok and as per case setup.
Velocity
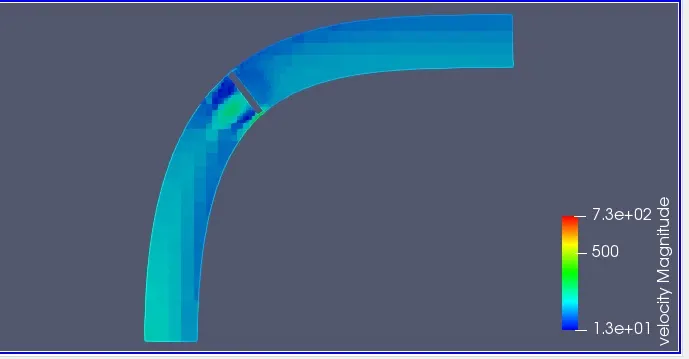
Below velocity profile is at that position when throttle valve is Rotated at 25deg and flow is restricted. Therefore velocity toward inlet boundry near throttle valve is decreased shown in dark blue color.
Pressure
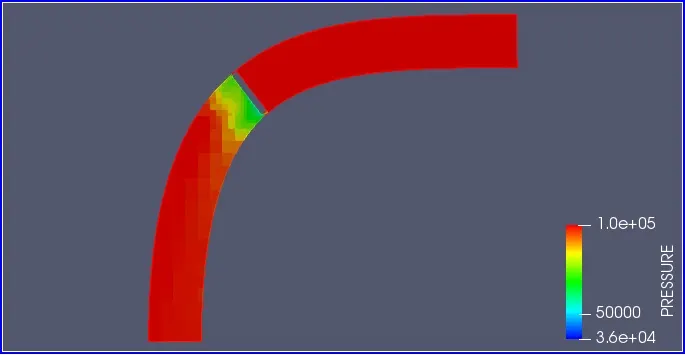
Below Pressure profile is at that position when throttle valve is Rotated at 25deg and flow is restricted.Therefore Pressure on throttle valve toward outlet Boundry is decrease as shown in green color and red color show increase in pressure toward inlet boundry.
Streamline Tracer
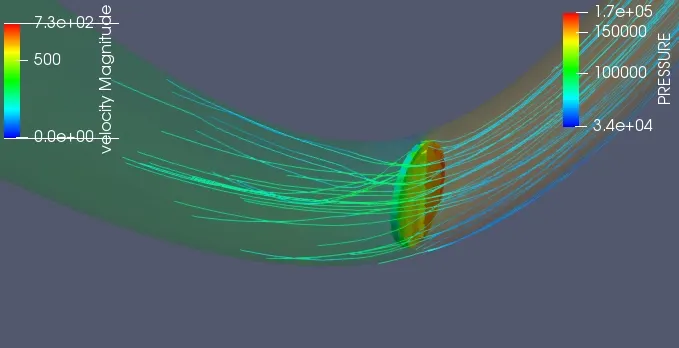
The below Images are of Throttle valve rotated at 25 deg From both sides in Streamline Tracer option. It is also cleared in streamline Tracer that Pressure (Red color) is increased on Throttle valve and due to Seperation of flow pressure is Dropped(Yellow-Green color) it is toward inlet boundry
Valve toward inlet Boundary
Line Plot
Mass flow Rate
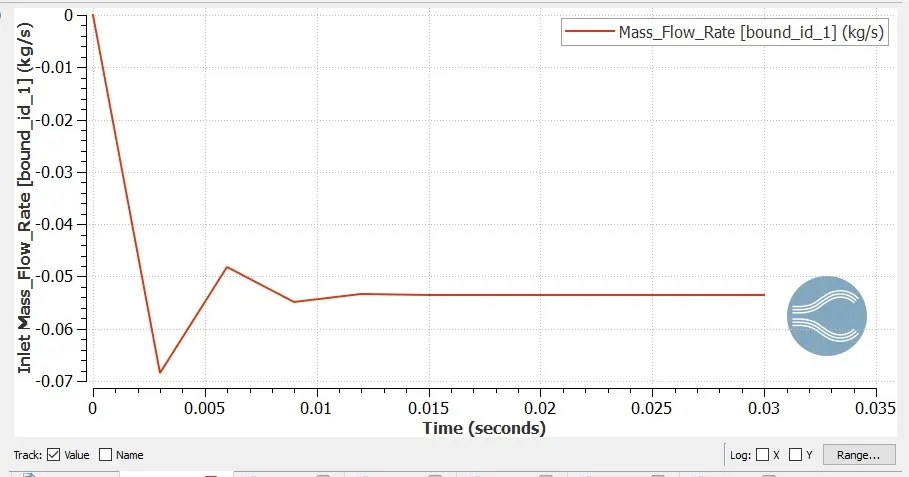
The below line plot show mass flow rate at inlet boundry and convered to value of 0.0534 kg/s at 0.012 sec.
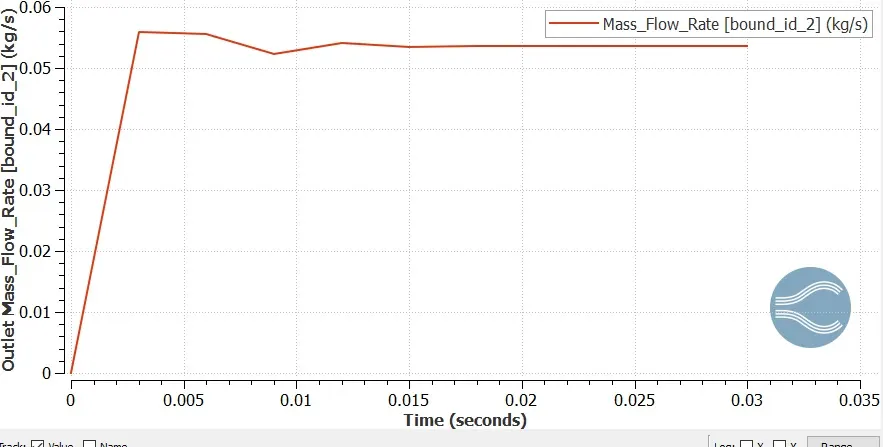
The below line plot show mass flow rate at outlet boundry and convered to value of 0.0534 kg/s at 0.015 sec.
Total Pressure
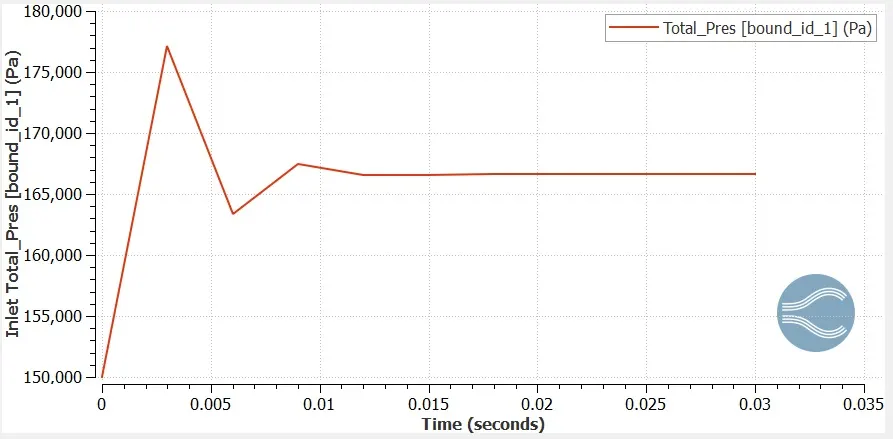
Total pressure is sum of static and dynamic pressure. The below graph show total pressue at inlet boundry and converged to 1.66 bar at 0.012 sec.
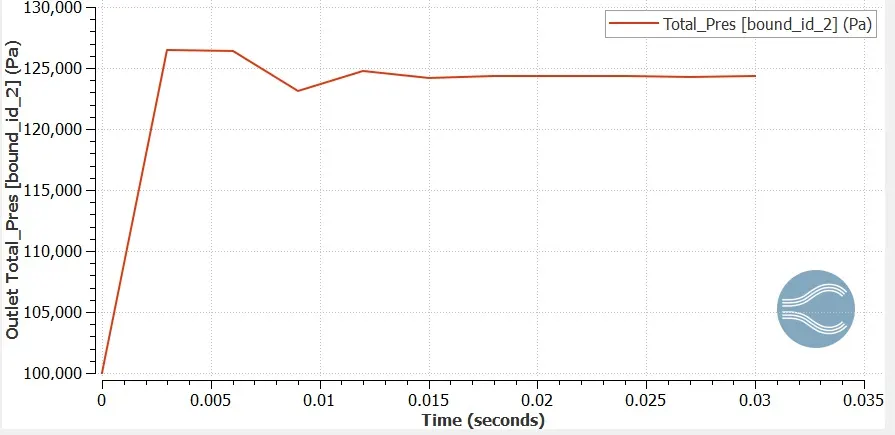
The below graph show total pressue at outlet boundry and converged to 1.2 bar at 0.015 sec.
Velocity Line Graph
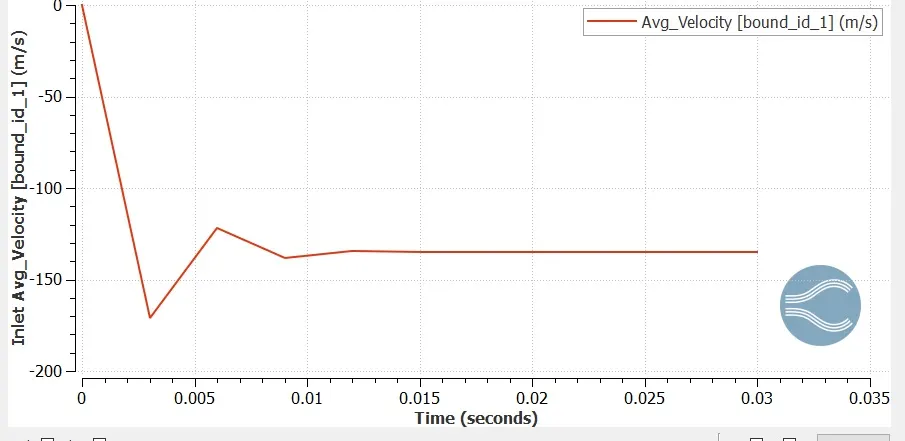
The below graph show Average velocity at inlet boundry and converged to value of 134.7m/s at 0.012 sec.
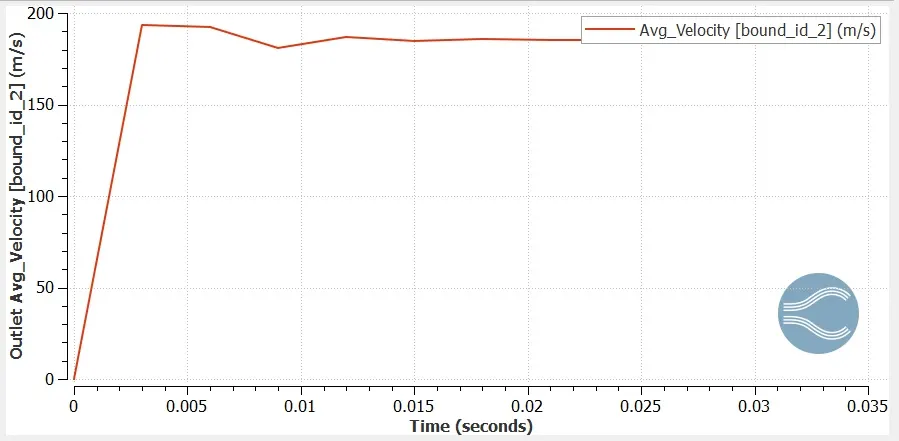
The below graph show Average velocity at inlet boundry and converged to value of 185m/s at 0.015 sec.