Week 7: Shock tube simulation project
Aim:
To do Shock Tube Simulation using Converge CFD.
Objectives:
- Setup a transient shock tube simulation in coverge.
- Plot the pressure and temperature history in the entire domain.
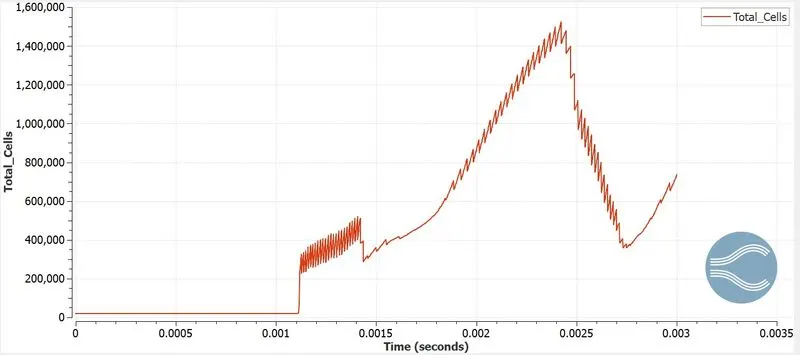
- Plotting the cell count as function of time.
Shock Tube:
- A simple shock tube is a tube, rectangular or circular in cross section which is usually constructed of metal, in which a gas at low pressure and a gas at high pressure are separated using some form of diaphram.
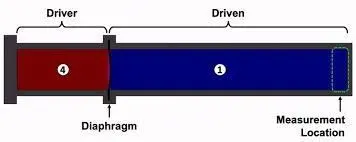
- The low pressure gas is known as driven gas which is subjcted to the shock wave. The high pressure gas is known as driver gas. The corresbonding of the tube are likewise called the driver and driven sections. The driver gas is mostly choosen to have a low pressure molecular weight for safety reason with high speed of sound.
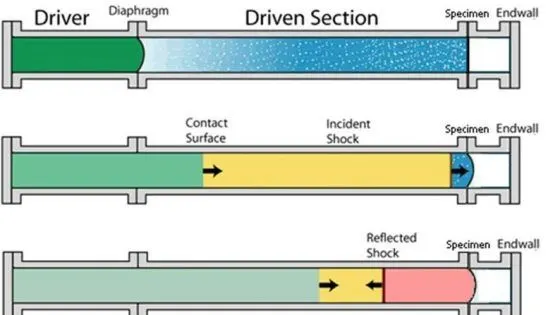
- Shock tube can create and direct blast waves at a sensor or an object in order to intimate actual explosions and the damage that they cause on a smaller scale.
Procedure:
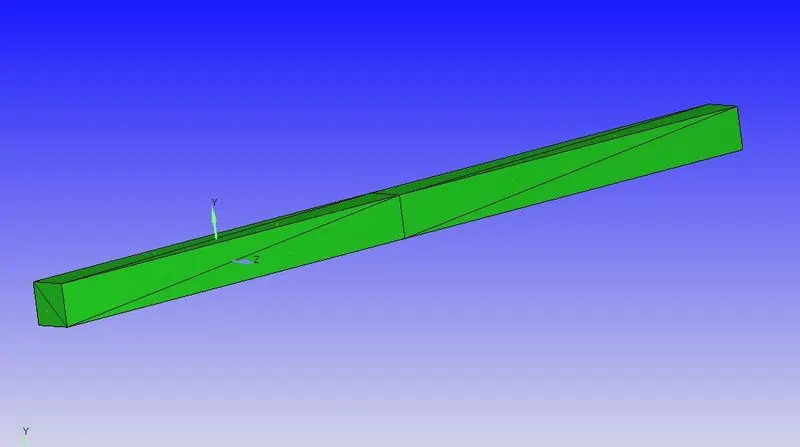
- Open converge and import the geomertry or create a geometry.
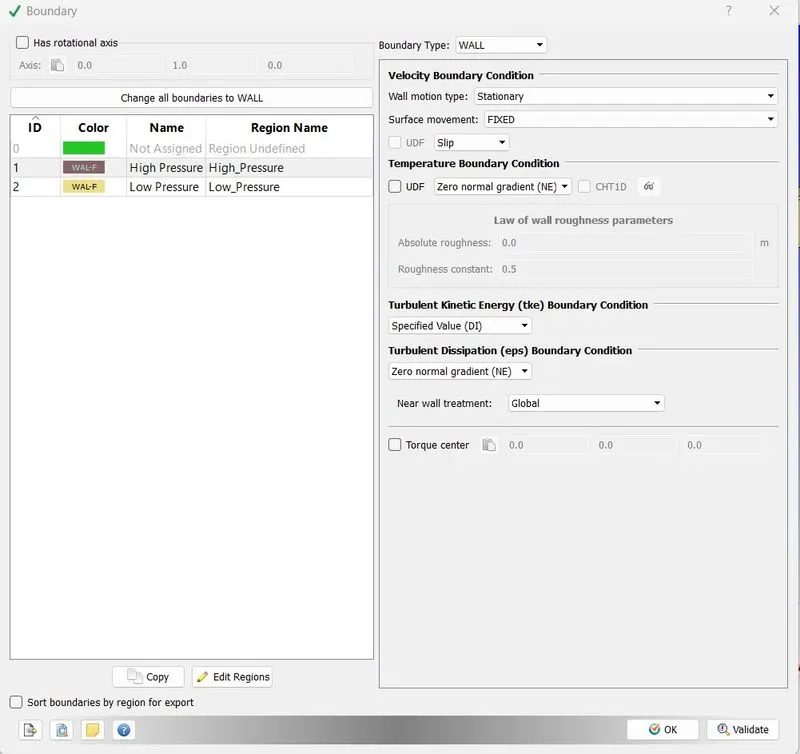
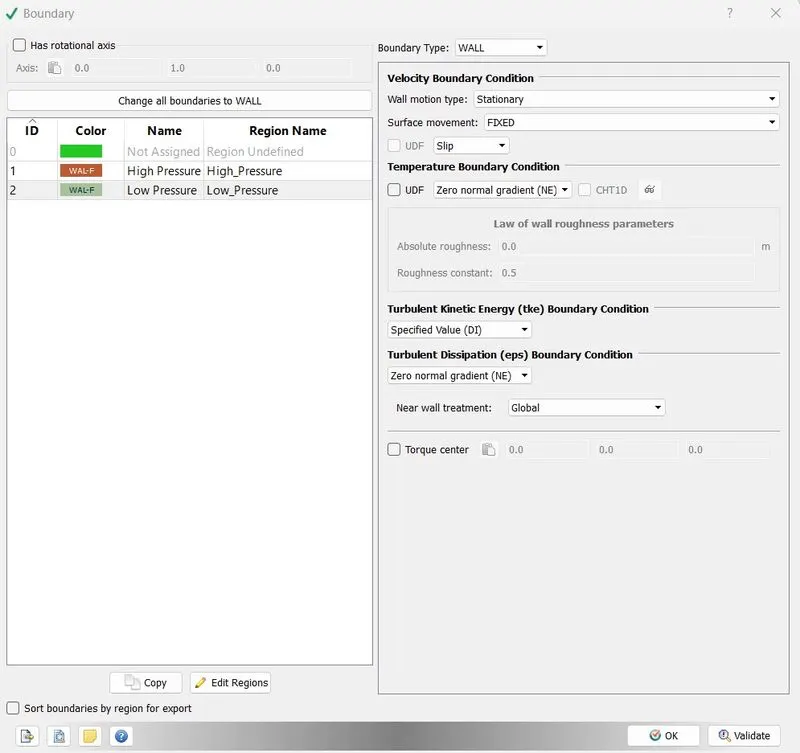
- Then assign the boundary flags, driver section as "High Pressure" and driven section as "Low Pressure".
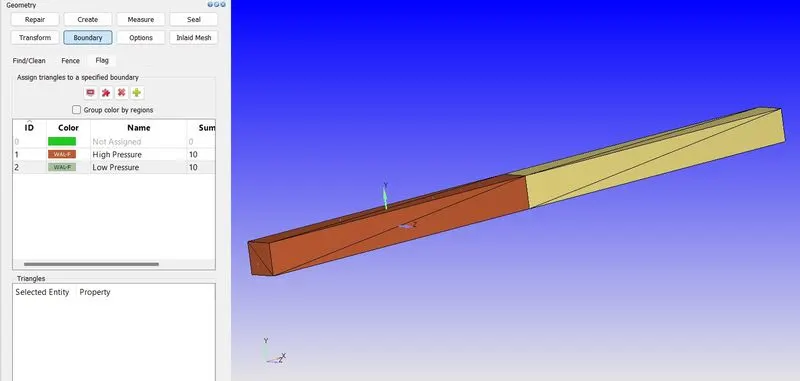
- Check the normals and make sure that they are towards the geometry so that we can analyse the inside the geometry which is the objective.
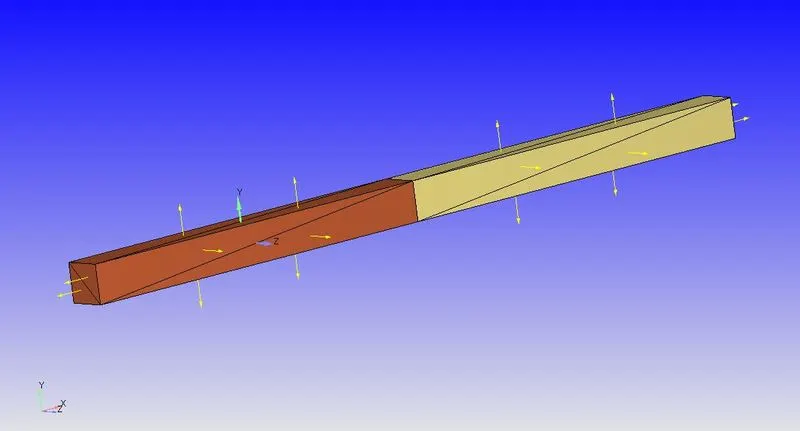
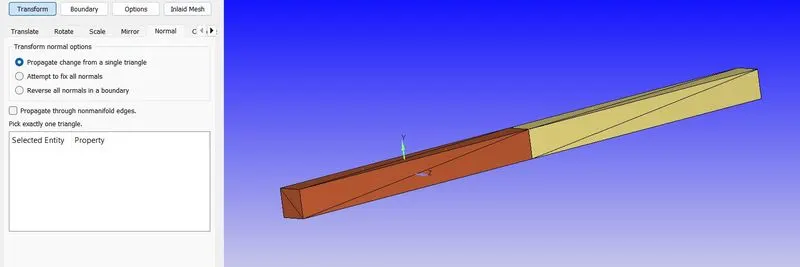
- Choose time based solver and setting up the cases one by one.
Case Setup:
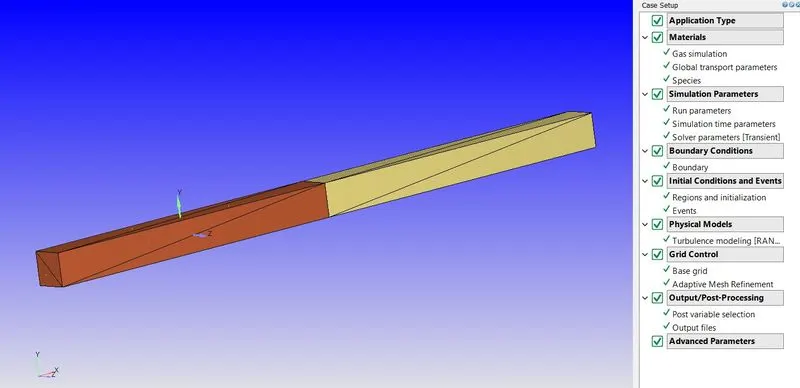
Materials:
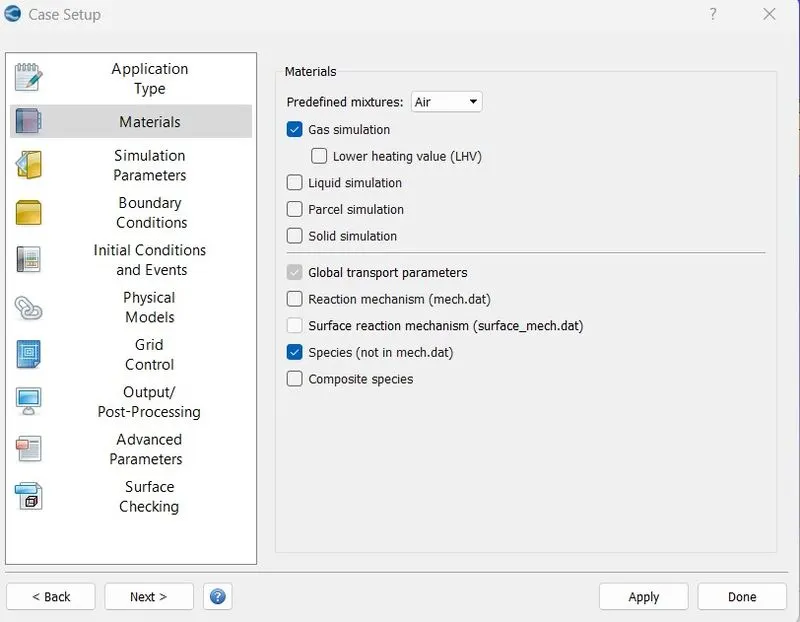
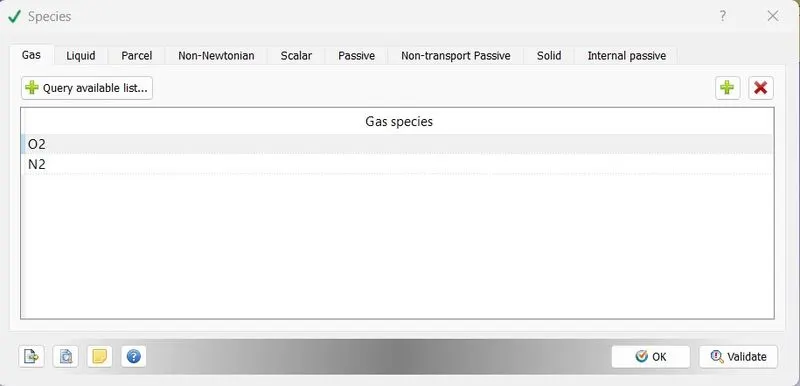
Species:
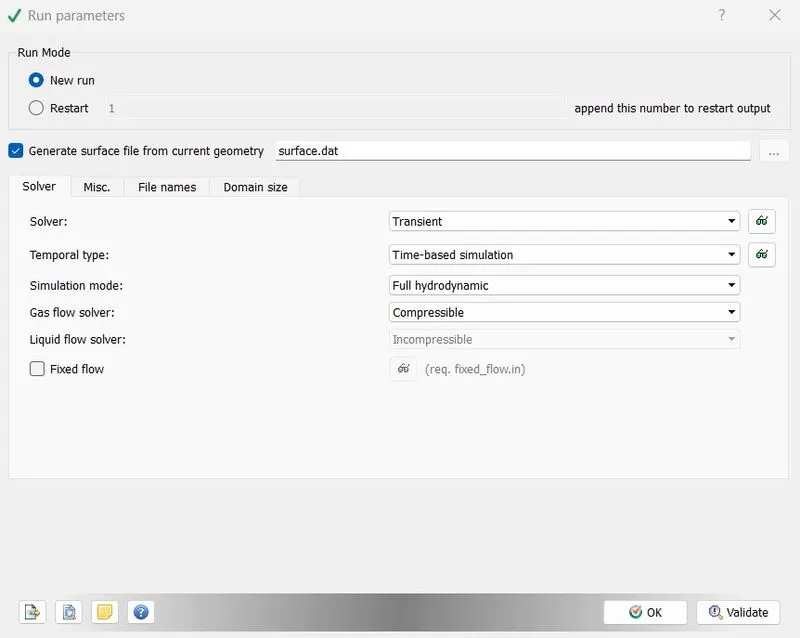
Run Parameter:
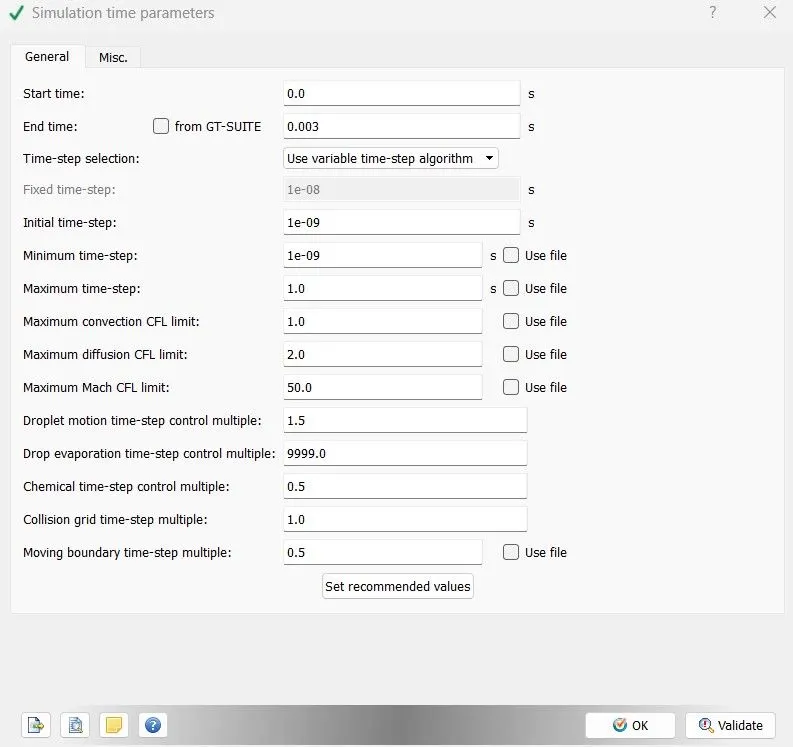
Simulation Time Parameter:
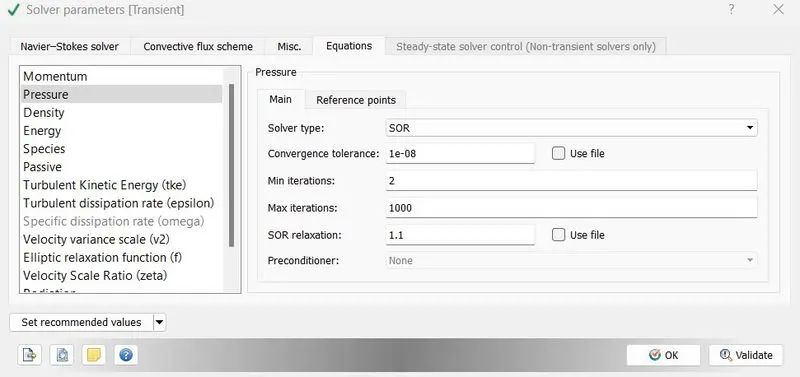
Solver Parameter:
Boundary Conditions:
High Pressure:
Low Pressure:
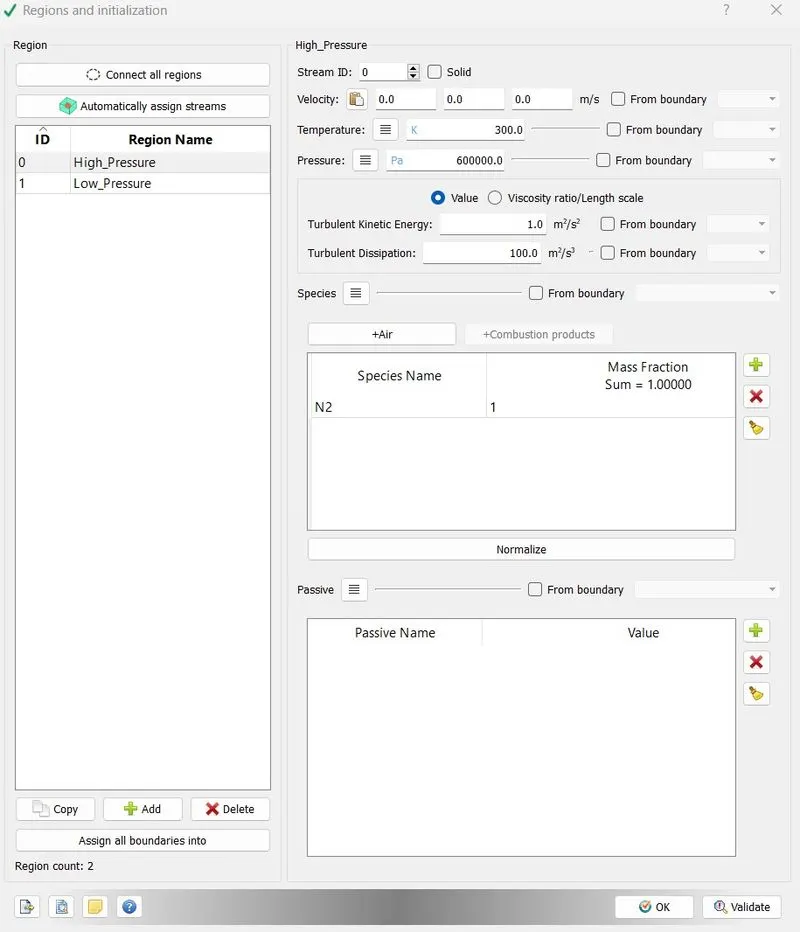
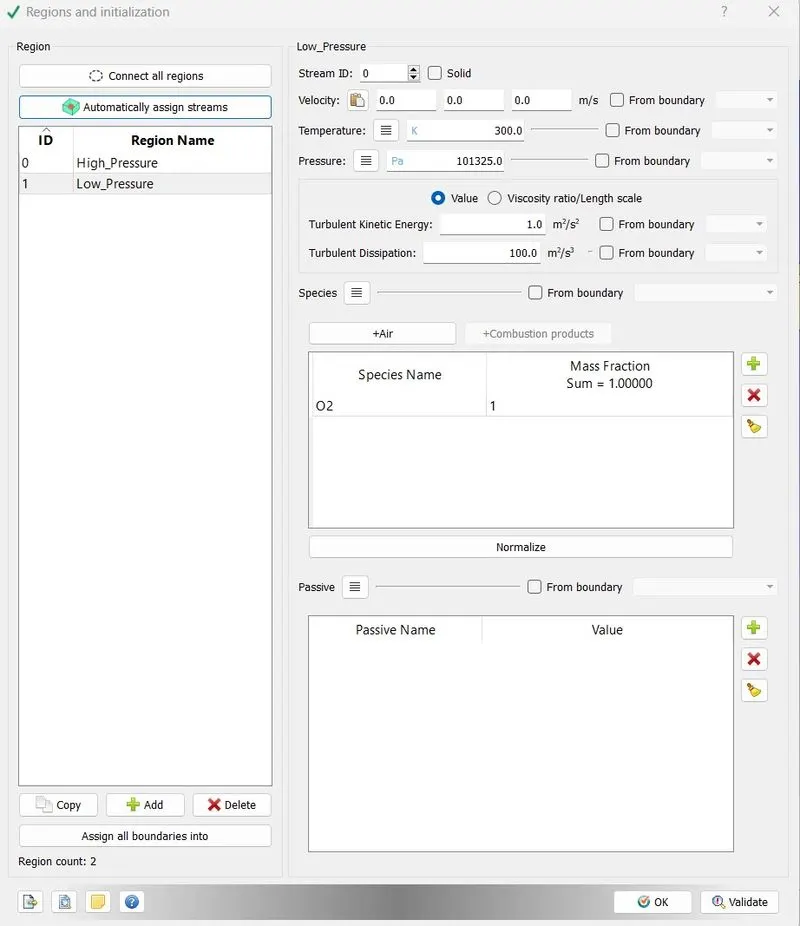
Regions:
High Pressure:
Low Pressure:
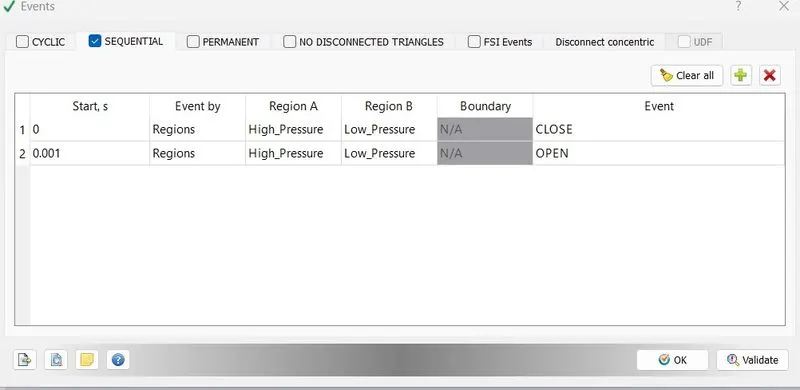
Events:
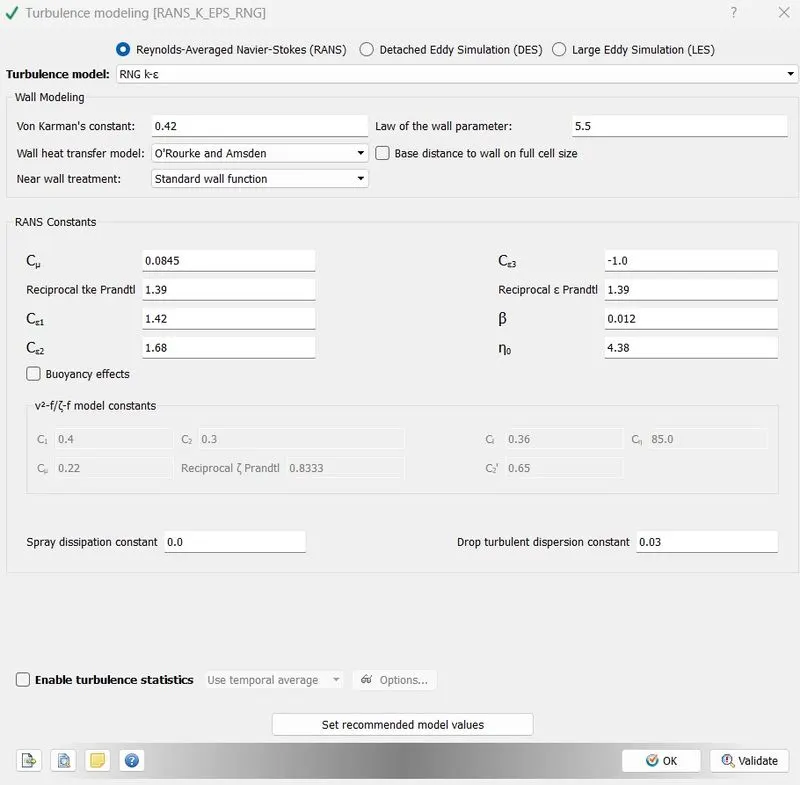
Turbulence Modeling:
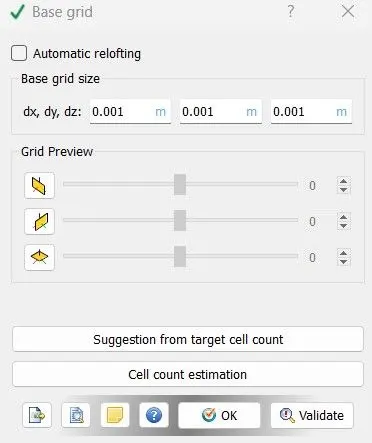
Grid:
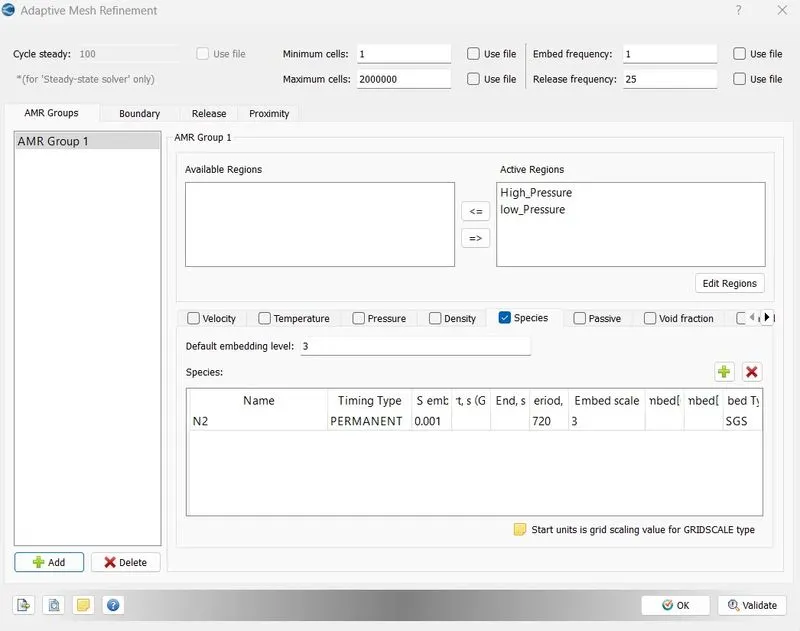
Adaptive Mesh Refinement:
Post Variable Selecting:
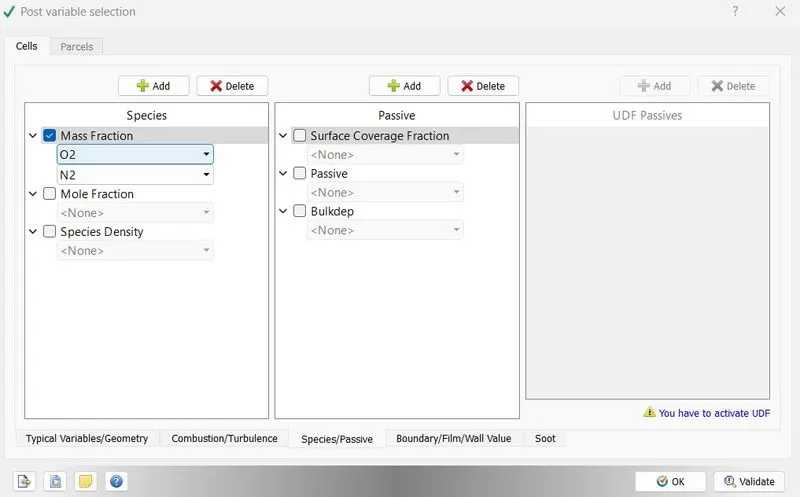
Output Files:
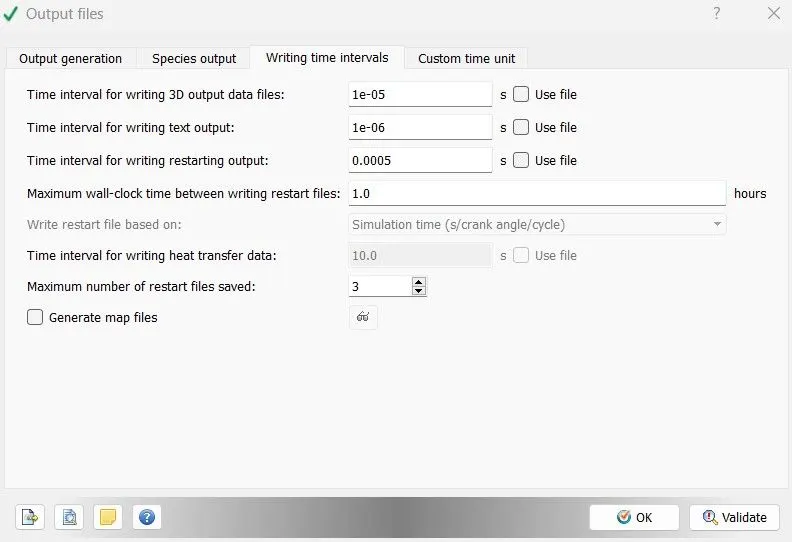
- After setting the all the cases export the input files to the certain location.
Export:
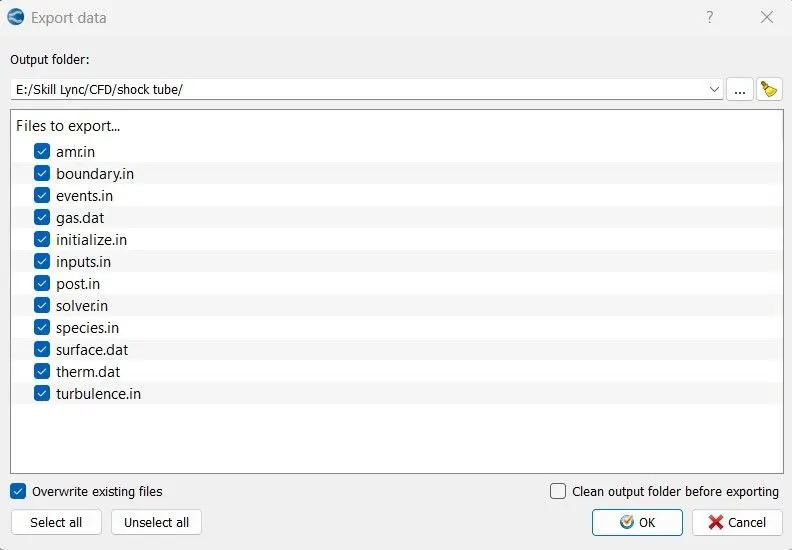
- Then open the Cygwin and navigate the location where the input files were located. Then run the simulation.
- It will take sometime to complete the simulation, after the simulation runs 100% Post convert the results using cygwin or converge so that we can analyse the results in paraview.
Post Convert:
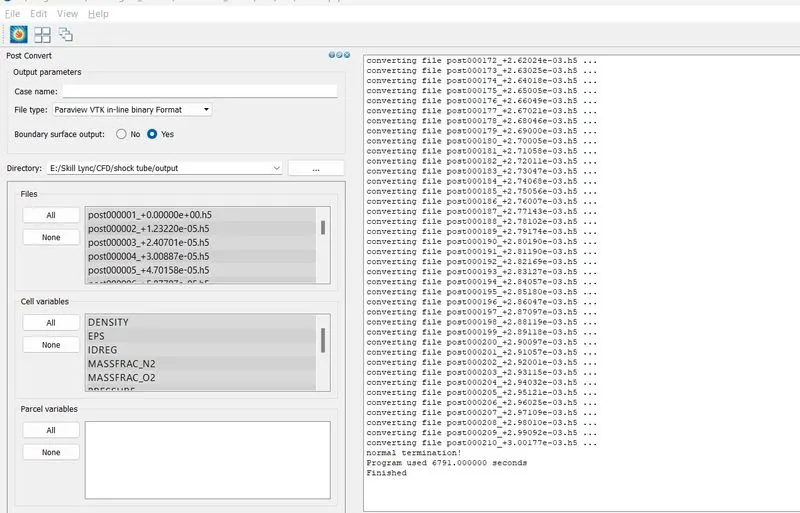
- Then create a velocity,Pressue and total cell counts in converge and create some profiles in paraview so that we can understab and anlyse the shock tube. Then create required animations.
Results:
Mesh:

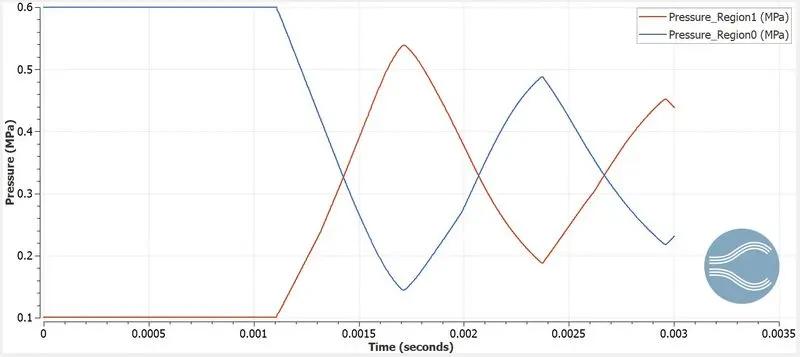
Pressure:
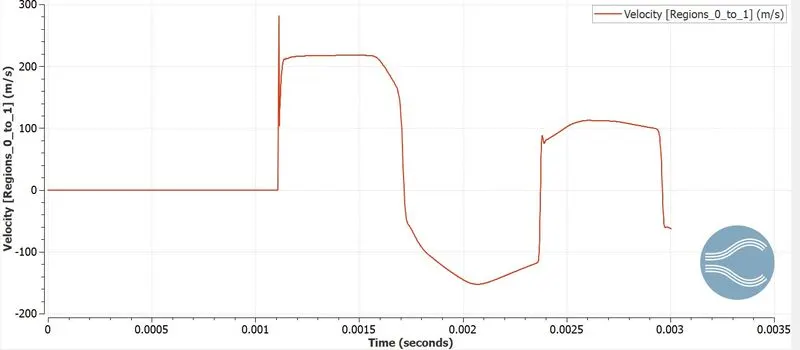
Velocity:
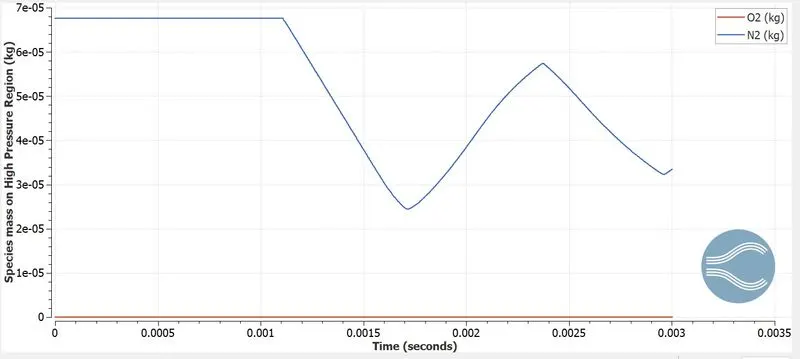
Species mass on High Pressure:
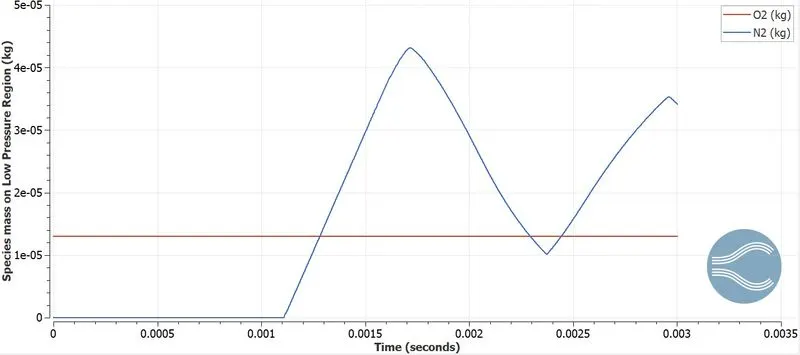
Species mass on Low Pressure:
Total cell counts:
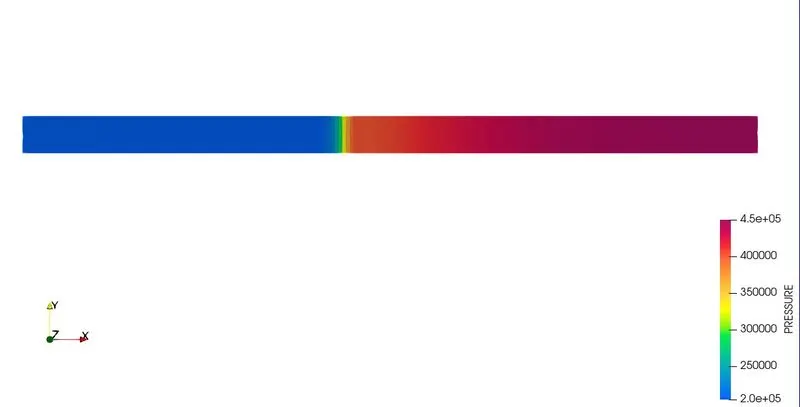
Pressure:
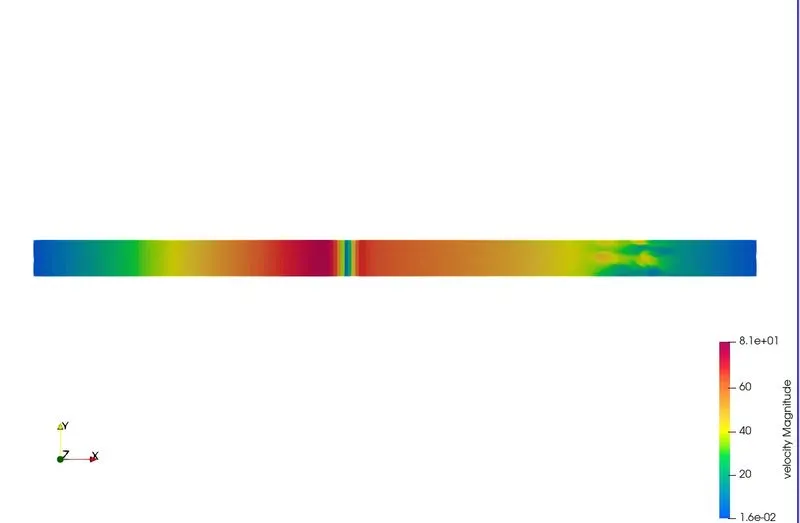
Velocity:
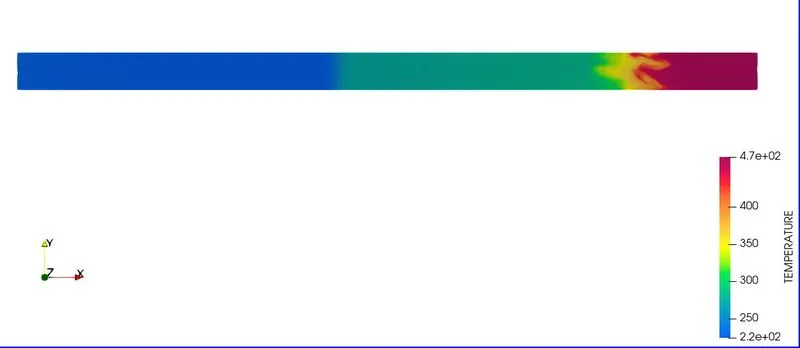
Temperature:
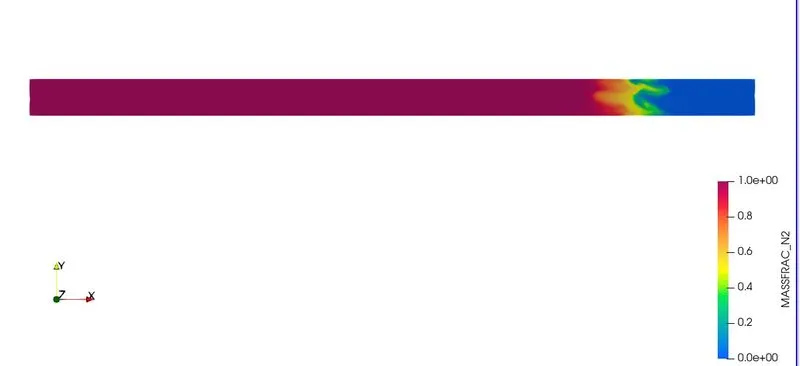
Massfraction of N2:
Animations:
Pressure:
Velocity:
Temperature:
Massfractionof N2:
Conclusion:
- From above preesure plot we can understand that as the diaphragm pops the pressure in region names as High Pressure decreases due to diffusion into the Low Pressure region and variation of pressure due to reflection of flow by the wall of the shock tube.
- From mass of species in Low Pressue region plot we can see how the N2 concentration increases in low presure region after the diaphragm is broken.
- By usign Adaptive mesh refinement criteria we can get accurate result as you can see the Toal Cell counts plot, cell counts are increased and decreased accordign to this.