Week 7: Shock tube simulation project
Aim- Shock tube simulation project
Introduction –
In this task we will study the shock tube effects in real world of fluid flow. Shock tube phenonmena is basically used for study of shock wave. which is created when fluid enter the from high pr to low pr. region. In shock tube the high pr and low pr zone is seprated with diaphragm. in starting as fluid flow due to diaphragm restriction . pr increases in first region . as diaphragm is
brusted due high pr. the fluid enter from 1st half to 2 nd half of tube and pushes the gases present in that region. which reults in the shock waves. This experiment helps in better study of combustion process of engine like iginition delay etc.
Steps –
- Geometry
- Define the boundary
- Case setup
- Simulation
- Post processing
- Outputs
- Conclusion
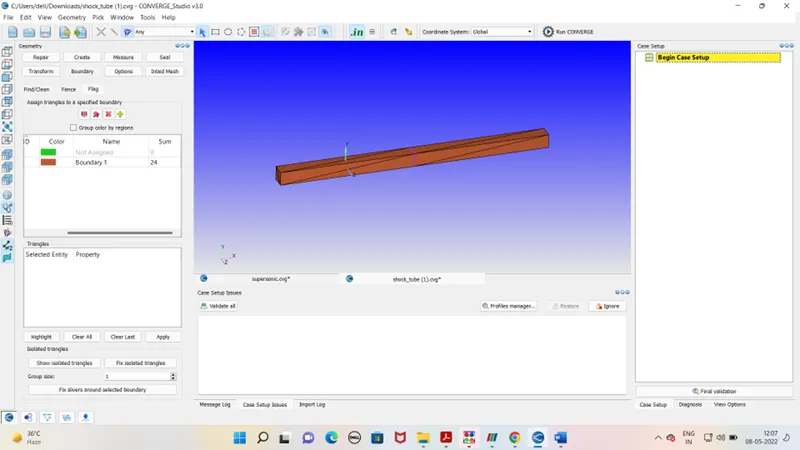
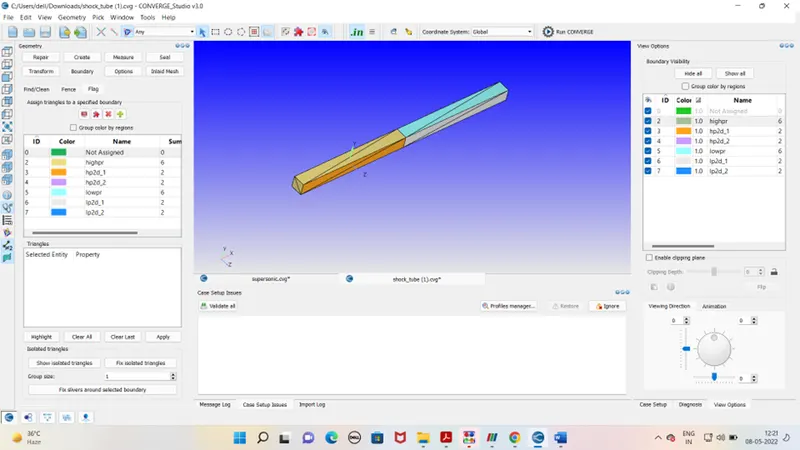
Geometry – Import the geometry . assign the boundary for high pr. and low pr . respectively. After that do diagnosis for any error in the geomtery. once it done go ahead with case setup .
Case setup –
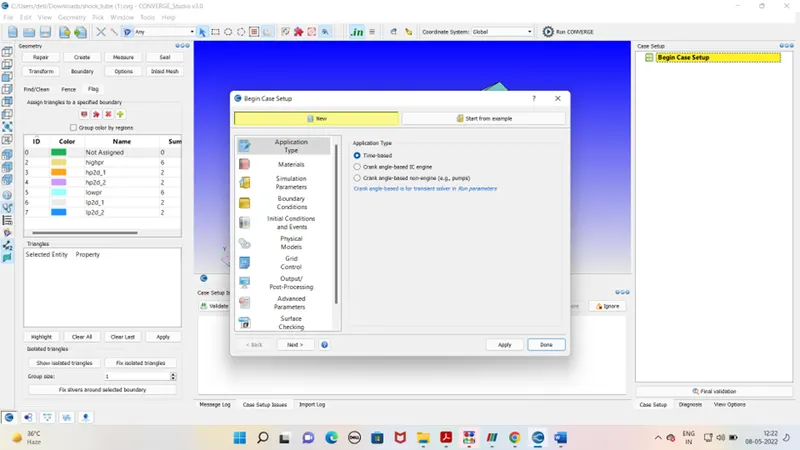
Application type –
Pre defined mixture - Air
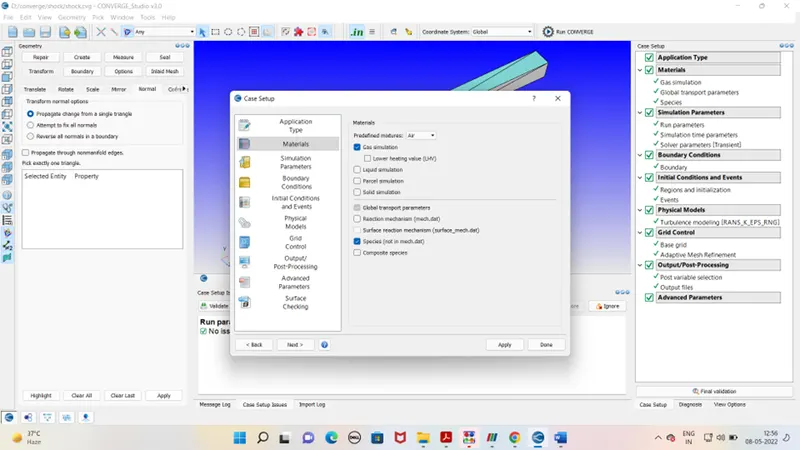
Gas simulation –
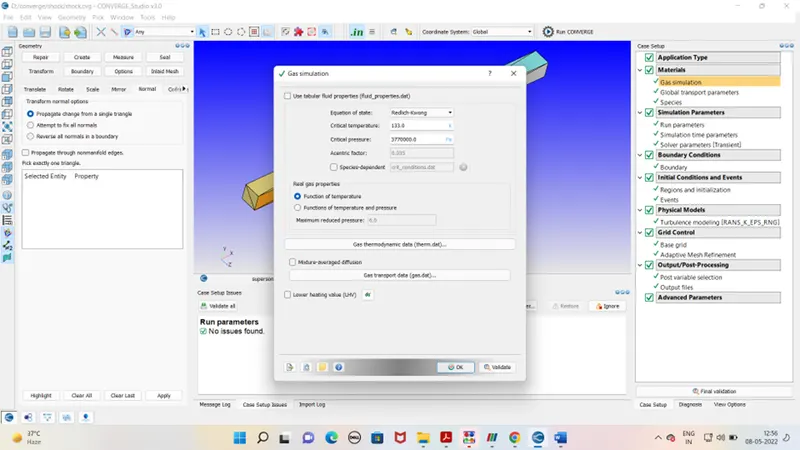
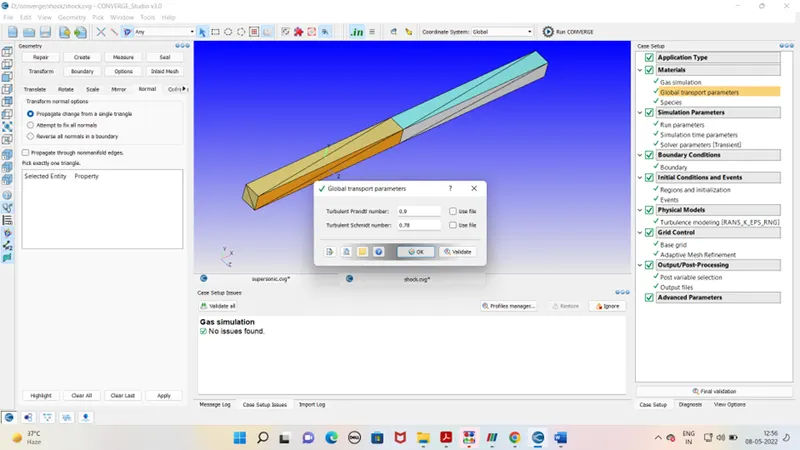
Global transport parameter –
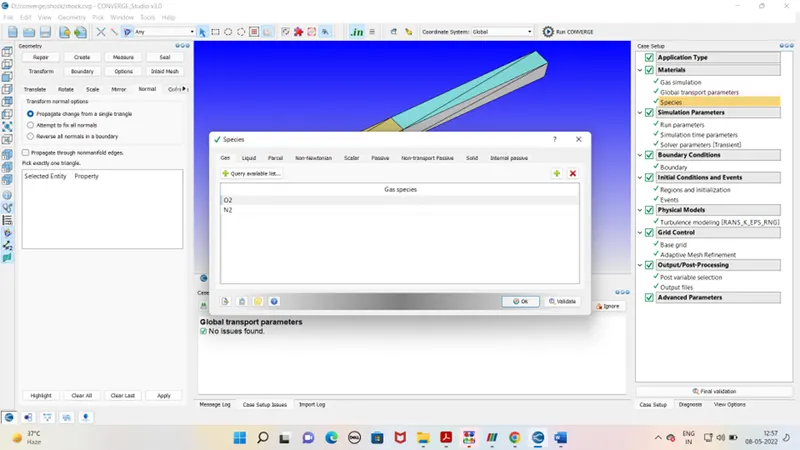
Species –
Simulation Parameter –
Run parameter –
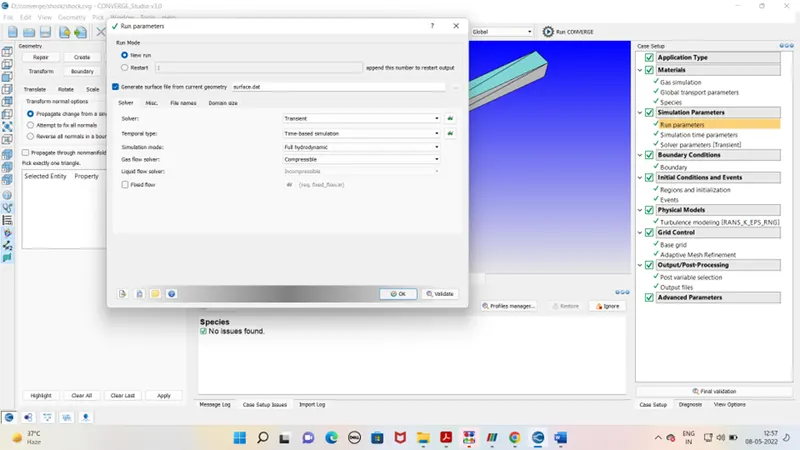
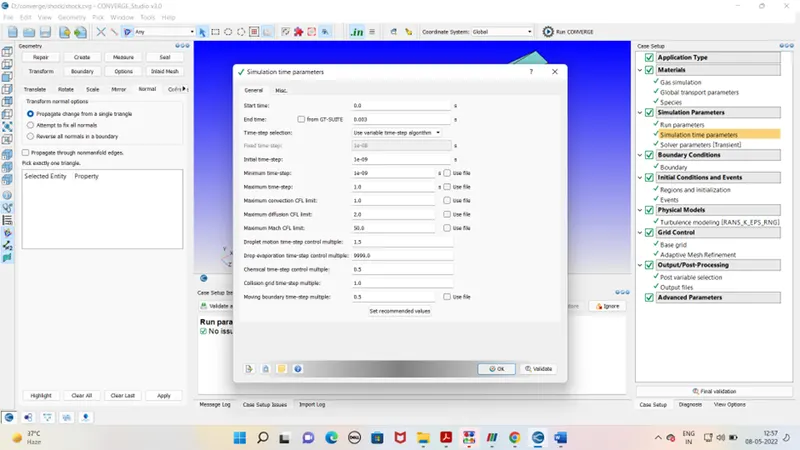
Simulation time parameters-
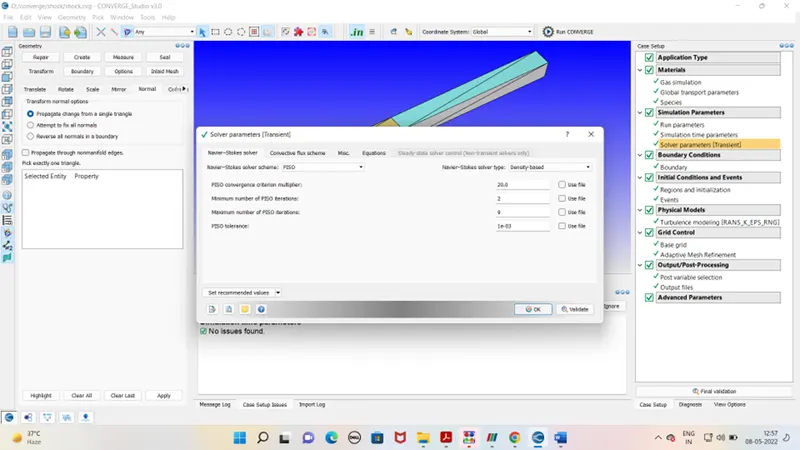
Solver parameters-
Boundary condition –
High pr
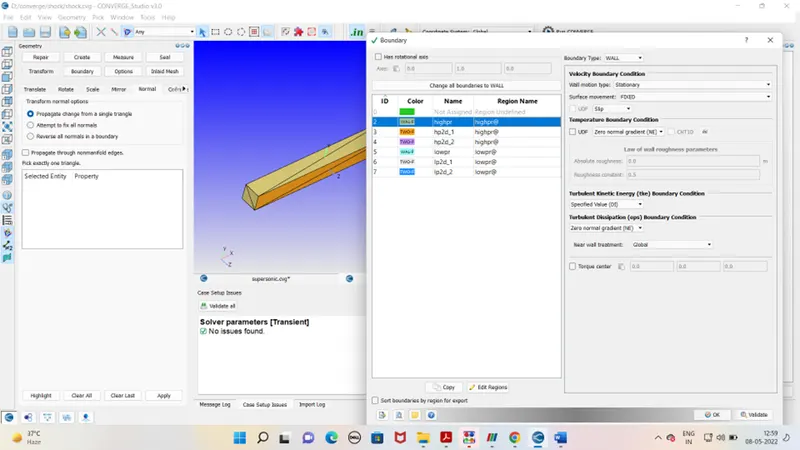
High pr 2d _1 – 2D boundary type
High pr 2d _2 - 2D boundary type
low pr
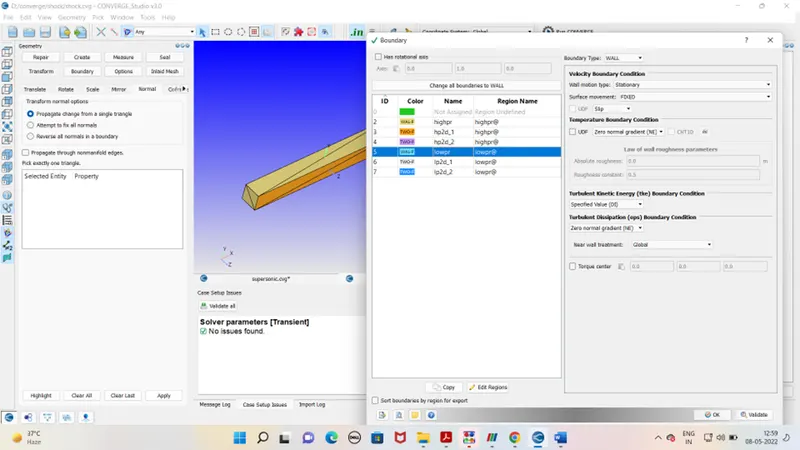
low pr 2d _1 - 2D boundary type
low pr 2d _2 - 2D boundary typ
Intial condition and events –
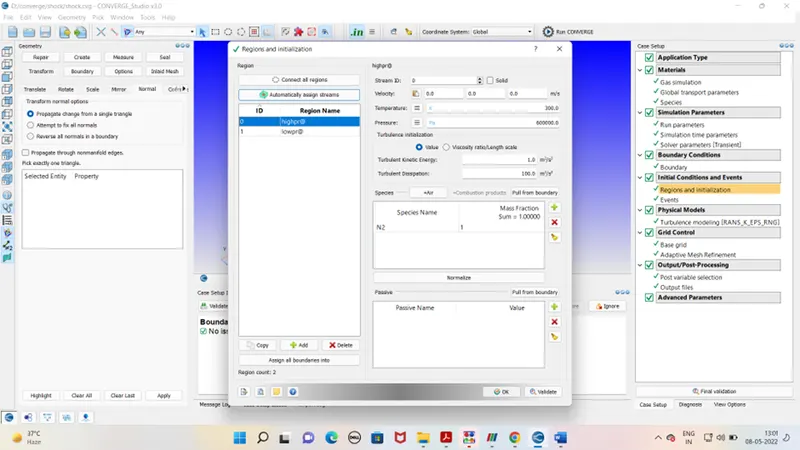
High pr region
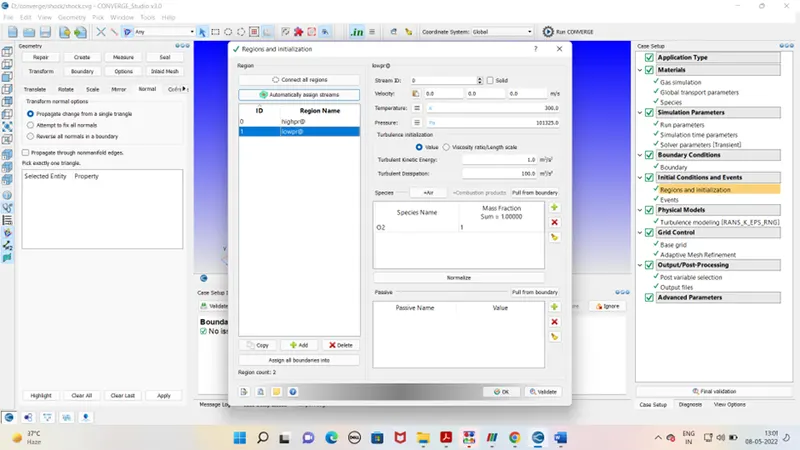
Low pr region
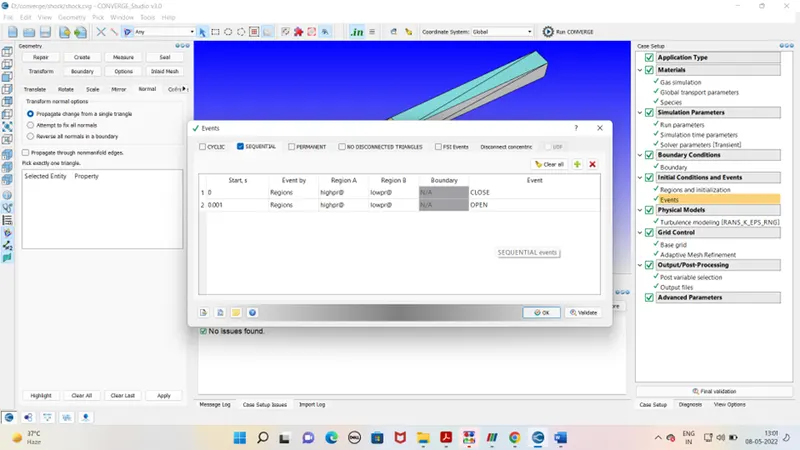
Events
In starting both the region will be separated from each other. @.001 time delay the diaphragm will be removed.
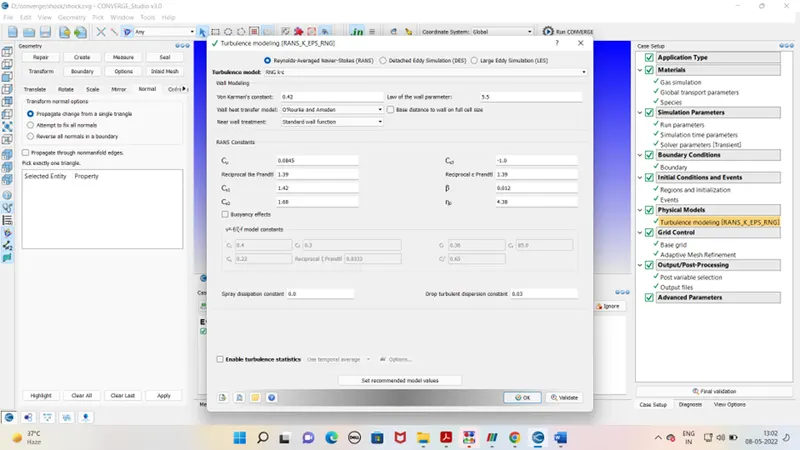
Physical models –
Grid control –
Base grid – dx - 0.003 dy –0.003 dz – 0.003
AMR-
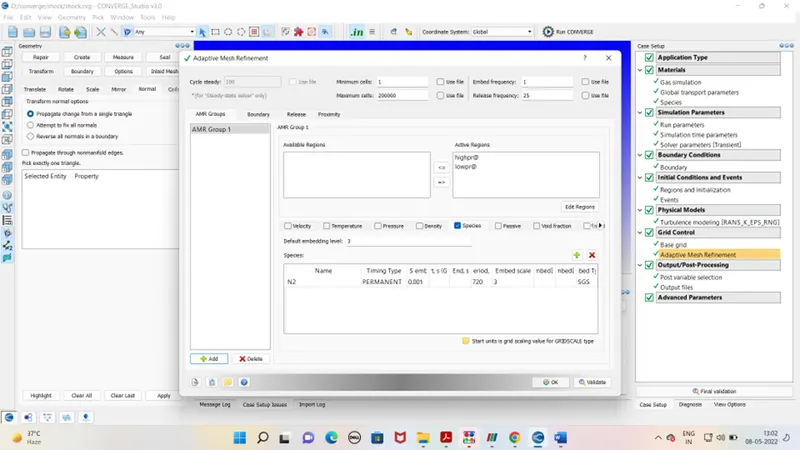
Output processing Advanced parameter –
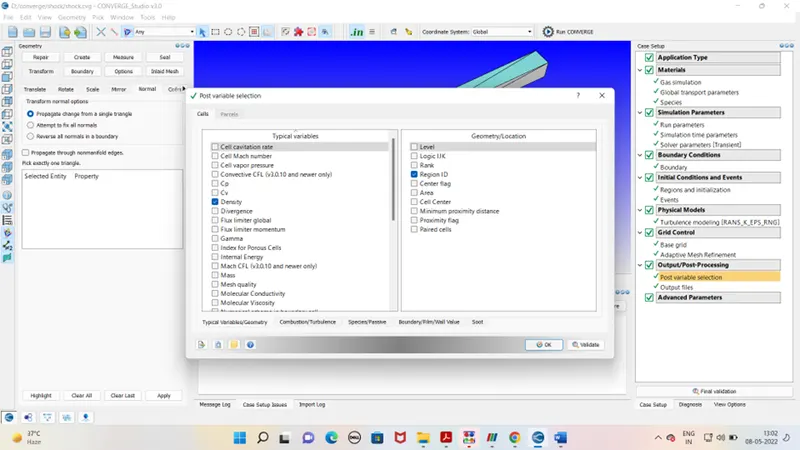
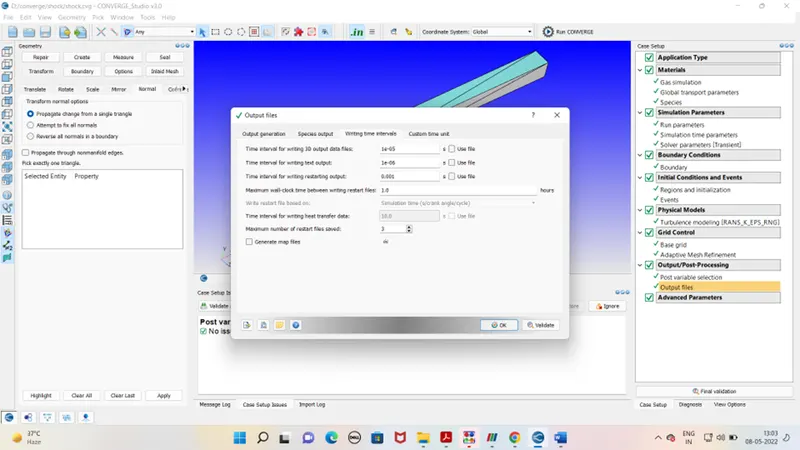
After case set up exports the file to defined folder. Run the simulation in the Cygwin. Generate the output files. As output file is generated run the post processing in Cygwin again. Open the output file in paraview for the mesh view and contours. For excessing pressure , velocity and mass flow rate use line plotting tab.
Outputs –
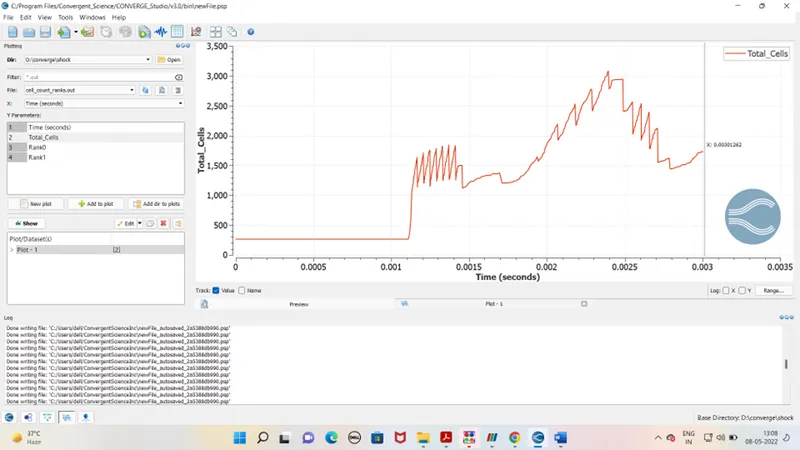
Cells counts
Temprature –
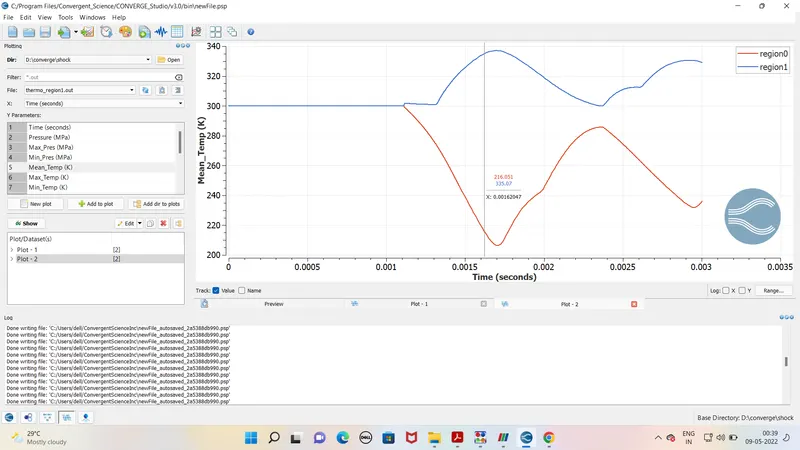
From trmp graph plots it is seen that temp was constant in starting but as the fluid enter to the low pr region there is drop in pr. which resulted the dec in temp as well in low region. As shock waves are created the pr in low pr zone increases rapidly and reulted the inc in temp as well.
Pressure plot –
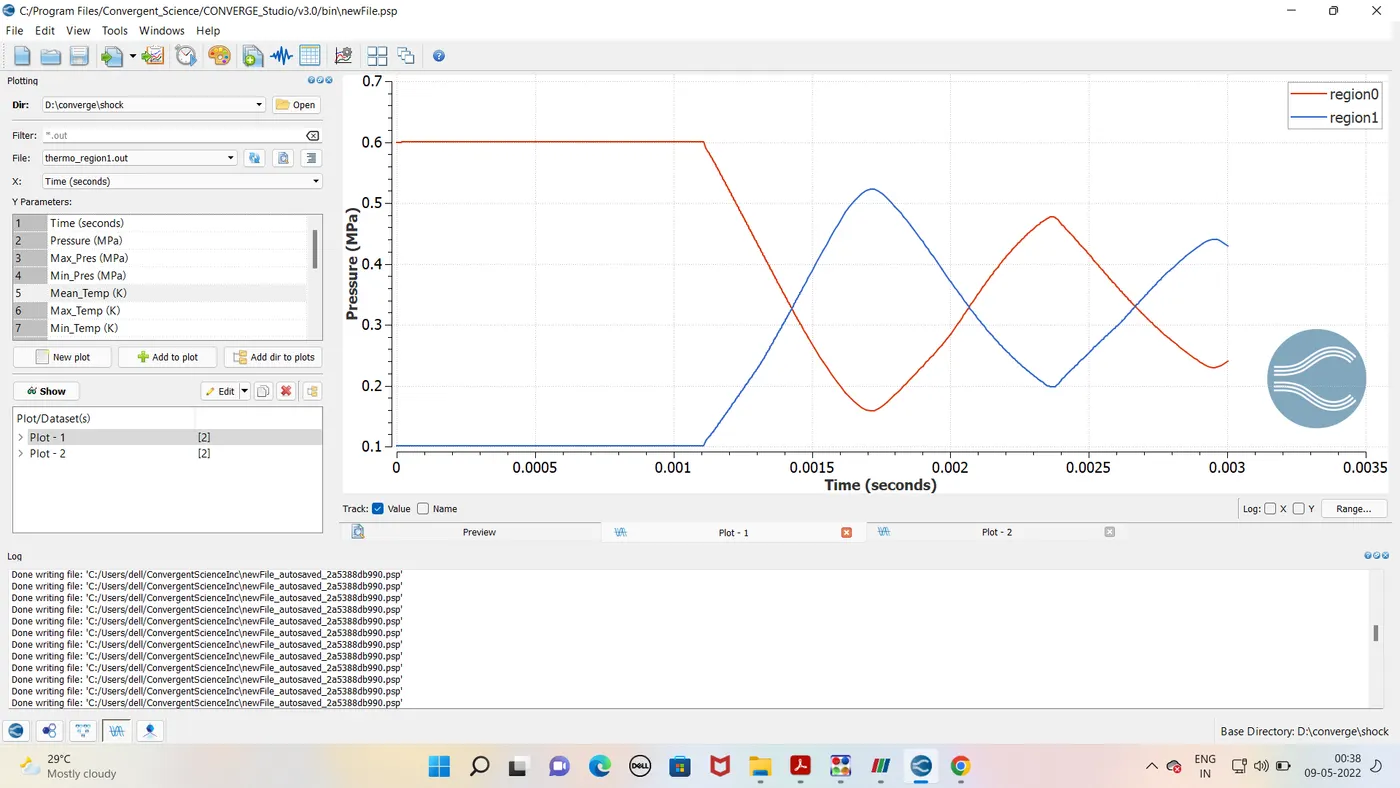
As it is seen that pr difference there in both region of tube. as fluid enter the low pr. zone from high pr zone. the shock waves resulted drop in pr in high zone due to expansion and inc in pr is noticed in second half of tube due to compression of gases. the two and fro motion as gases strike the walls. and variation in pr noticed for both region .
Mesh –
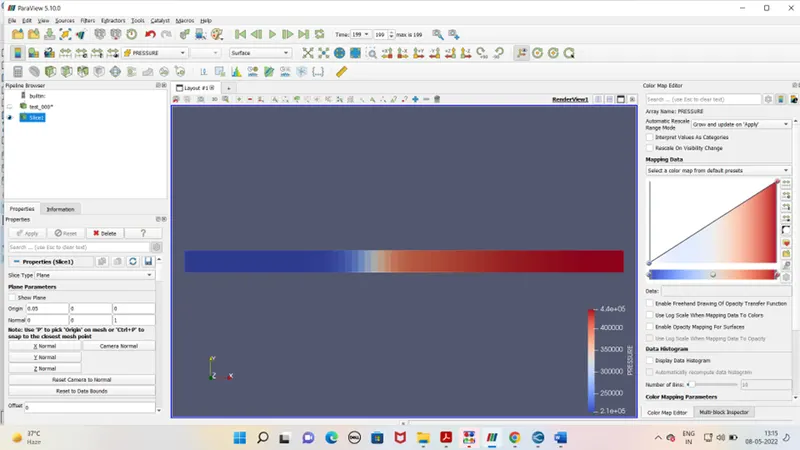
Pressure contour
Velocity contour –
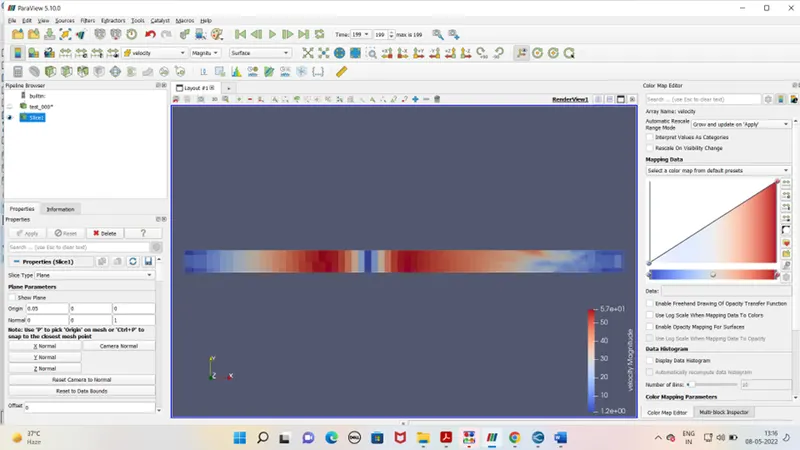
Conclusion -
It is noticed that when high pr fluid enter th elow pr region the fluctuation in pr is noticed which results in shock waves . Pressure and temp for both the species varies as per defined events .
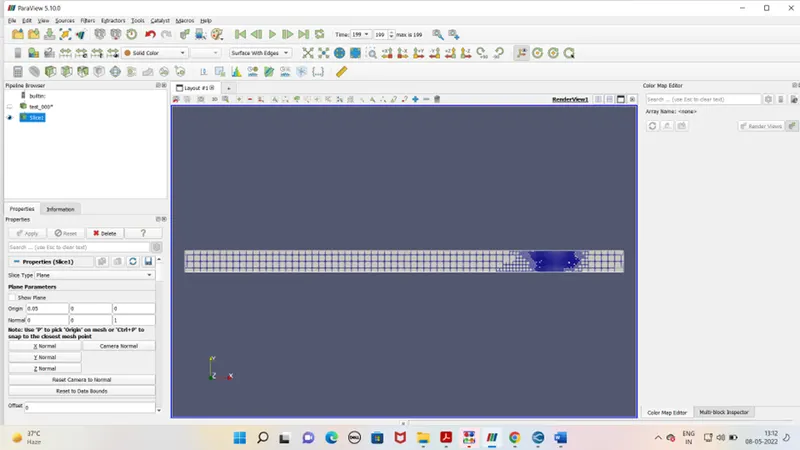
AMR concept is also obsevred in region when n2 enter the low pr region. finer mesh is observed in region where is sudden drop in pr is noticed. This concept that why plays major role in analysis of combustion process of engine.