Week 7: Shock tube simulation project
Aim:
The major objective of this project was to set up Transient Simulation in a Shock Tube using Converge CFD. A shock tube that has a diaphragm in between and the tube is one side filled with high-pressure Nitrogen where the other side is filled with low-pressure Oxygen.
- Setup a transient shock tube simulation
- Plot the pressure and temperature history in the entire domain - Explain the result
- Plot the cell count as a function of time
Introduction
The report contains a detailed description of the Shock tube Simulation problem using converge CFD software, solving it using CYGWIN, and post-processing the result using ParaView. This Case Study contains a rectangular duct that has two sections along with a diaphragm in between. A high-pressure reservoir is connected to the low-pressure section
A shock tube is a device for studying shock waves. Prior to starting an experiment, a diaphragm inside the tube blocks any flow, we can increase the pressure on one side, such as with a compressor, and then
start the flow by rupturing the diaphragm. The gas expands down the other half of the tube.
Lets Downlod the geometry and modifey it
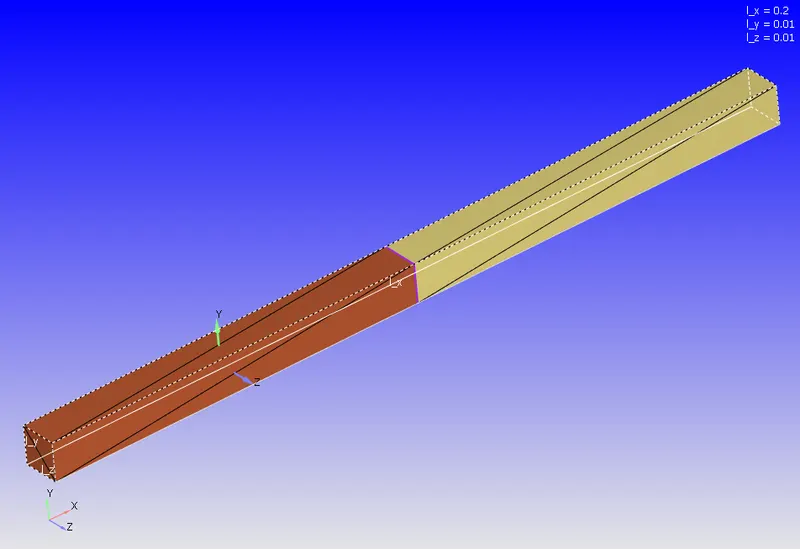
create the geometry, the geometry was uploaded from the different CAD software package. Then the geometry clean up was done along with High-pressure regions and Low-pressure regions patch creation for a boundary tagging, All the normal vector were painting out for this geometry, so we wanted it to point inside and normal to each surface. Normals point the direction of the fluid region generally. The command "Transform" was used to make the normal inside pointing the direction of the fluid region.
CASE SETUP :
Gas simulation
Globel transport simulation
speices are same as O2,N2
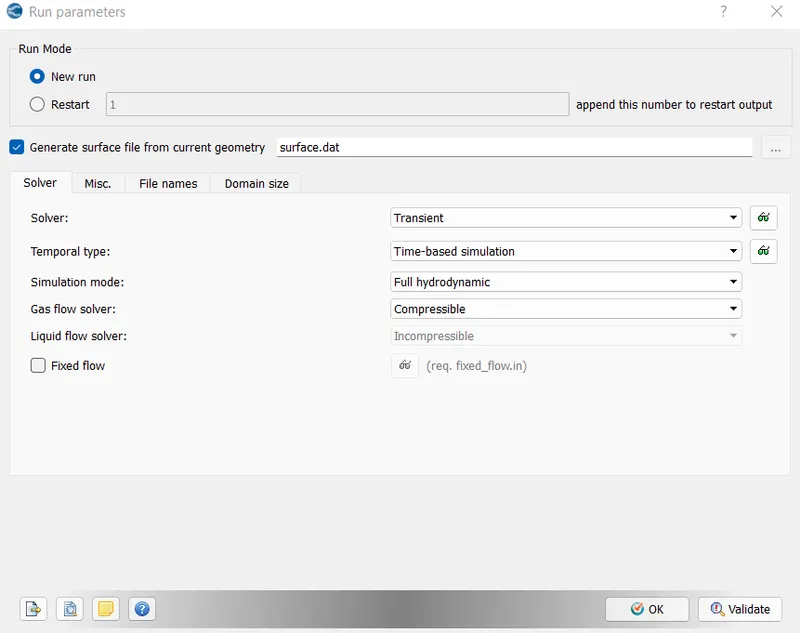
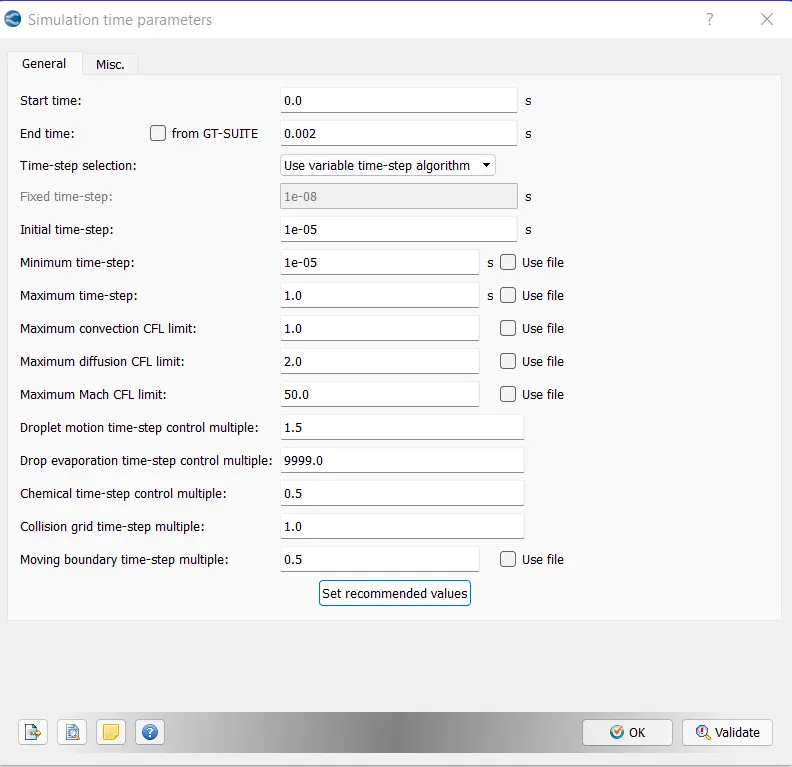
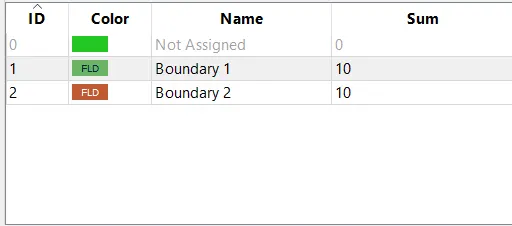
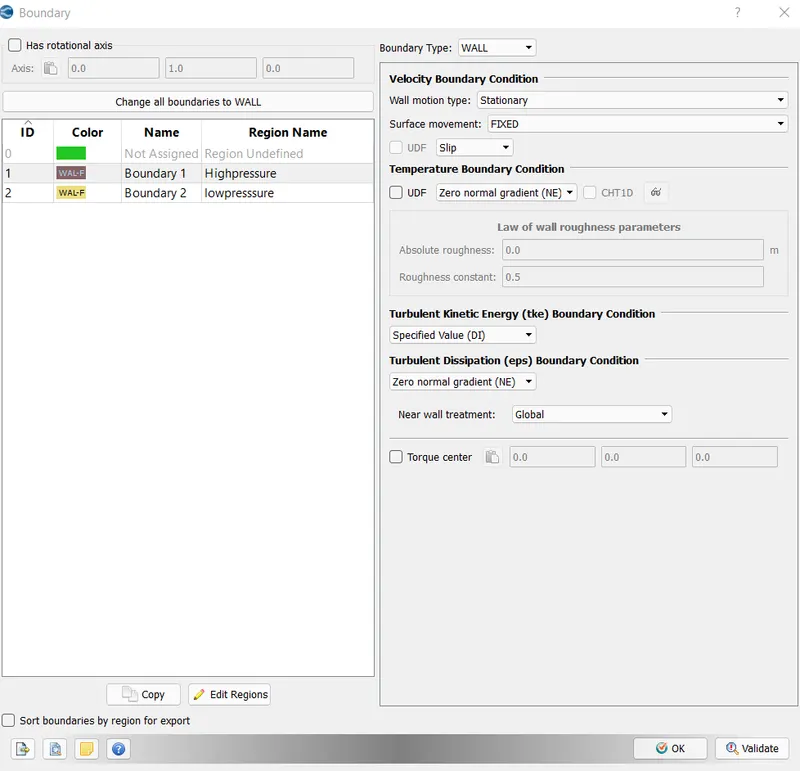
Case setup for boundary 2 same as boundary 1
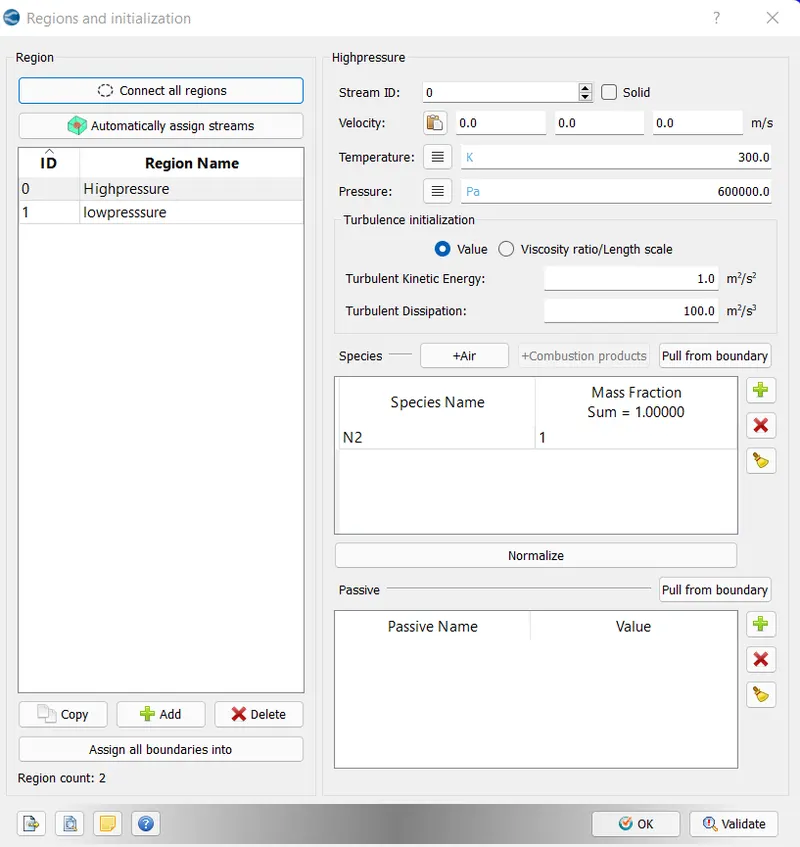
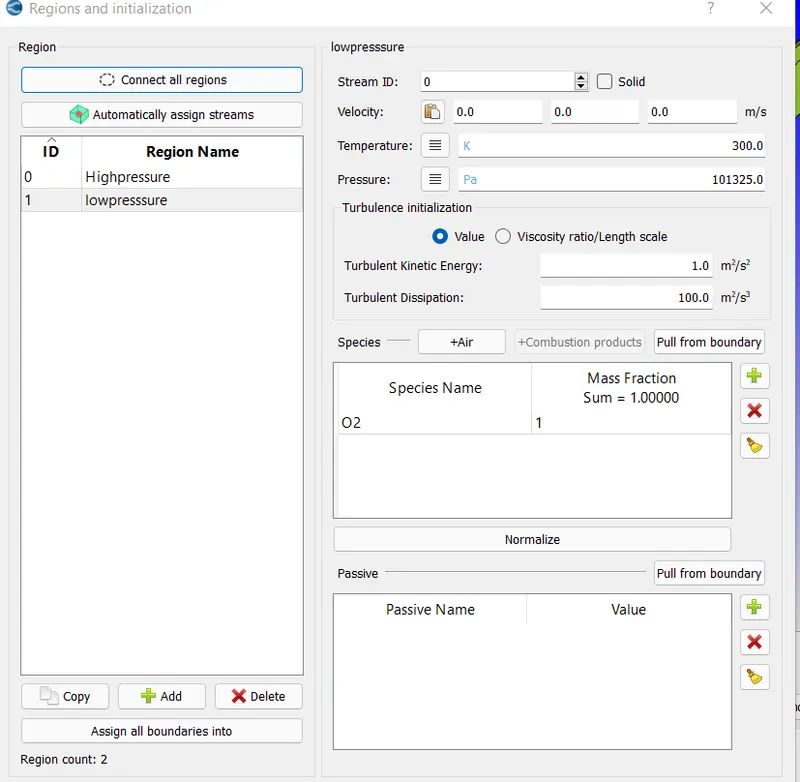
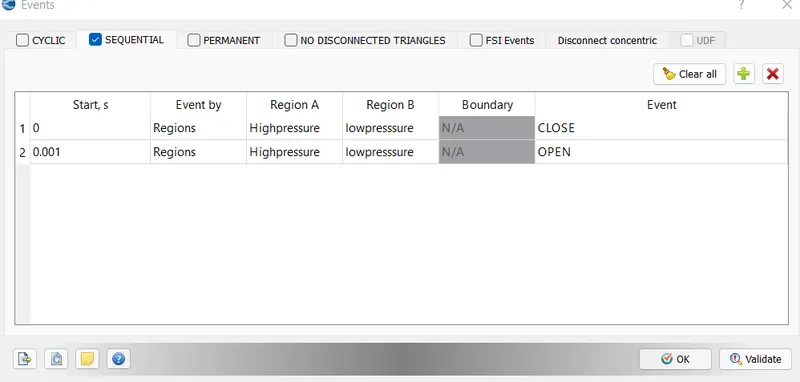
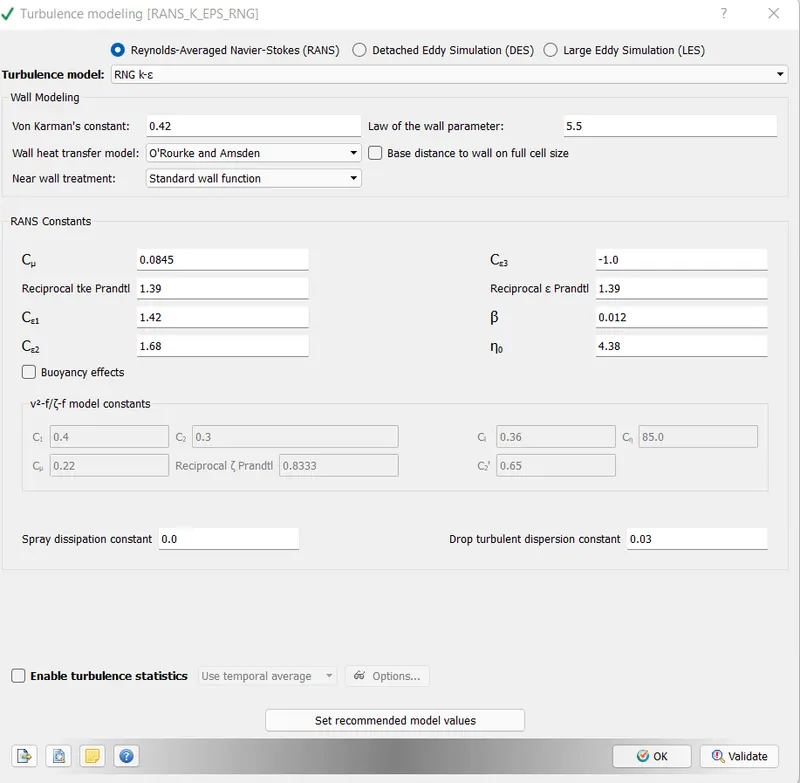
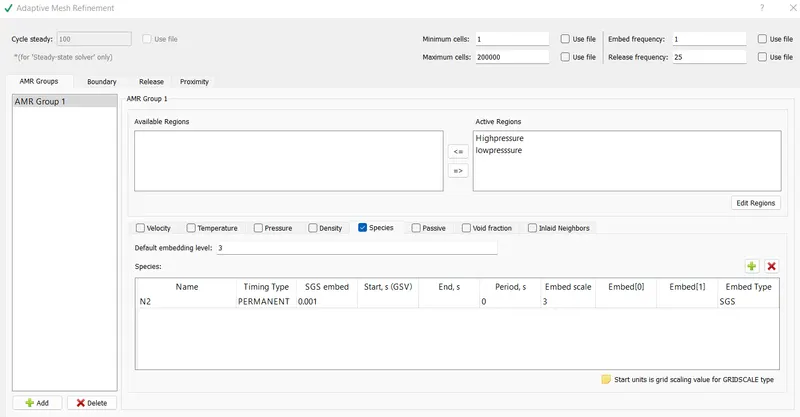
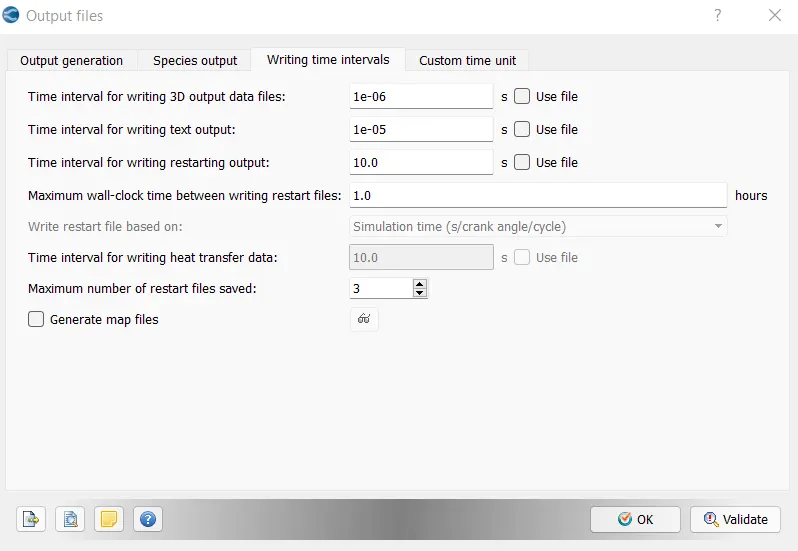
Export all the inputs files to a certain folder and run the command in the CIGWIN command
When the run is normal termination post process the results and extract in the paraview software
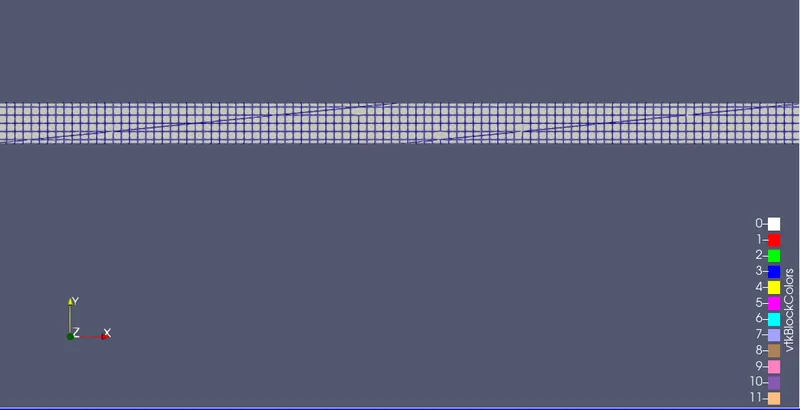
Meshing grid 0.03
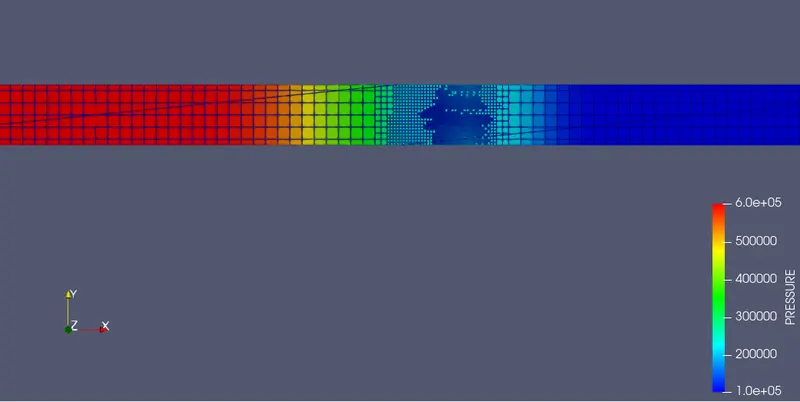
Pressure plot
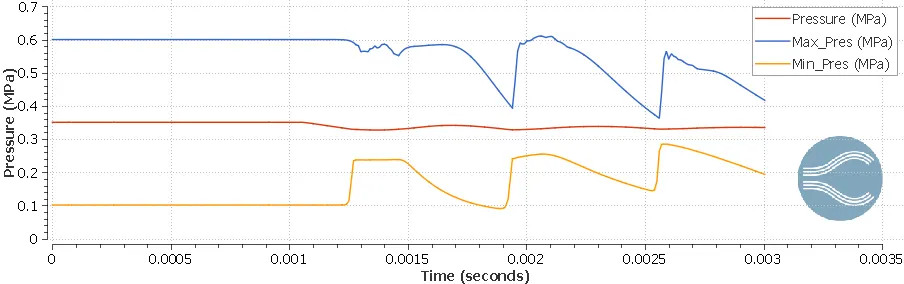
As we see, mean pressure within the whole domain decreases initially due to convective flow dominance, when the diaphragm is ruptured we encounter shocks and high velocity flow between high pressure and low pressure zones causing decrease in static pressure, however along with the time marching the convective flow is decreased because the process is trying to establish equilibrium. finally mean pressure.
Temprature plot
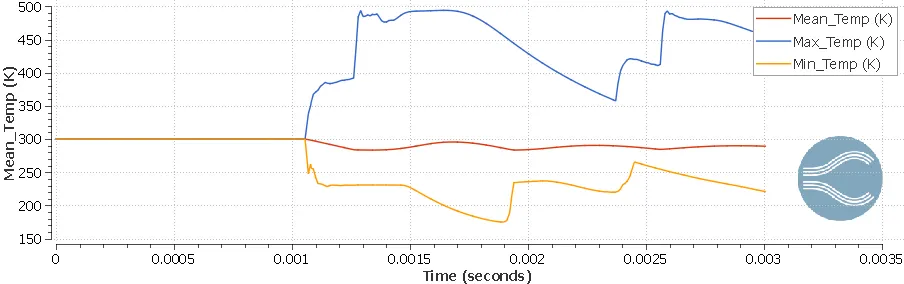
As we see temperature in high pressure zone is decreased, it is caused because of the flow generation in the low pressure zone direction, meaning, Initially in the high pressure zone static pressure is 6bar and when the diaphragm is opened flow is derived from high pressure to low pressure, according to the enegry conservation, due to increase in flow (dynamic pressure) and decrease in static pressure in the High pressure zone, temperature should also decrease.
Total cell count
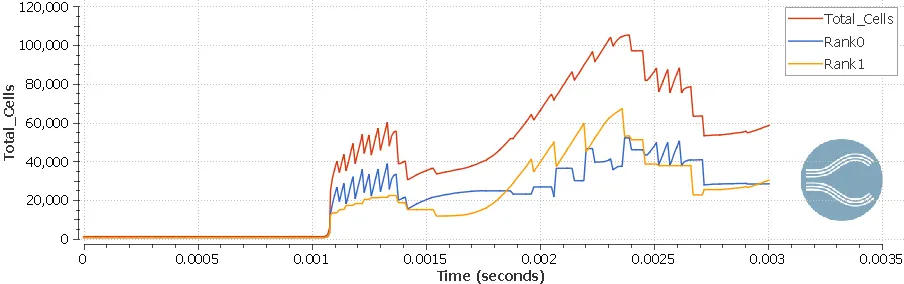
YouTube links for animation
Conclusion
We simulated shock tube successfully, learnt the working principle of the shock Tube