Week 7 - Minor Project
Aim: To set up a domain for analysis over NACA 0012 airfoil at the subsonic and supersonic regimes. The airfoil should be analyzed at different angles of attack and lift and drag coefficients for all the cases should be compared.
Angles of attack to be analyzed:
- Setup simulation for subsonic and supersonic regimes at (0, 5, 10, 15,20 angles of attack )
Need for the analysis of airfoil:
Airfoil structures are the reason for the lift in airplanes, space launch vehicles, jets, etc. Airfoils need to be studied for not only lift but also drag force which is the area where a significant amount of the fuel energy is spent on. An advanced study suggests the use of shark skin structures that are in the flow direction of the fluid will reduce the drag by creating turbulence. Many advancements have happened in the airfoil shapes and designs to improve the efficiency of the airfoil. this is possible from the number of experiments and simulations performed. In this study, the effect of angles of attack and stalling need to be analyzed.
Introduction:
Lift theory: Air flowing around the airfoil is attached to the airfoil. The point at which the air first hits the airfoil is called the stagnation point as the velocity of air comes to rest and pressure is buildup. the flow separates at the leading edge of the airfoil and attached flow happens. The flow of fluid attaches to the surface near to it and follows the surface and this is called the Coanda effect. The fluid with high velocity has low pressure and vice versa this law is called Bernoulli's principle. The airfoil shape is in such a way that the lower part is concave and the upper part is convex, when the airfoil is kept in airflow the air above will have higher velocity than the air flowing below, this is because the convex shape decreases pressure and concave shape increases pressure( towards the trailing edge). The particles of the fluid above and below the airfoil will never meet as the velocity of the particle above is always greater than the particles below. The airflow is directed downward at the trailing edge soo according to Newton's third law of motion or mass conservation principle the downward motion of air creates upward force lift. This can be also explained as there will be higher pressure below and lower pressure above the airfoil this creates net upward force lift according to Bernoulli's principle.
Drag Theory:
Drag is the backward force on the airfoil. Drag consists of two types Surface drag and pressure drag. Pressure drag occurs when there is negative pressure at the trailing edge which opposes the forward motion. pressure drag increases when flow separation occurs earlier. Surface drag is related to the surface of the body according to no-slip condition the velocity of the fluid layer attached to the surface has zero velocity and increases gradually away from the body until it becomes free stream velocity. This gradient of the velocity of fluid around the surface of the body is called the boundary layer. This created deceleration forces on the body. Drag force is
Stalling: A stall is a condition in aerodynamics and aviation such that if the angle of attack is increased beyond a certain point, then lift begins to decrease. The angle at which this occurs is called the critical angle of attack. This angle is highly dependent upon the airfoil section or profile of the wing, its platform, its aspect ratio, and other factors, but is typically in the range of 8 to 20 degrees relative to the incoming wind for most subsonic airfoils. Stalling is caused by flow separation, the flow separation starts at the tip of the trailing edge and as the angle of attack increases grows towards the leading edge, and at the critical angle of attack, the flow separation is high enough to create a stalling effect.
NACA 0012: NACA 0012 is a symmetric airfoil that will not create any lift for zero angles of attack. NACA stands for National Advisory Committee for aeronautics. In NACA 0012 the first two digits tell about the camber in the airfoil, the first digit expresses the camber in the percentage of the chord,(chord length is the length of the airfoil) the second digit gives the location of the maximum camber point in tenths of a chord, and the last two digits give the thickness in the percentage of the chord.
In the following study, NACA 0012 airfoil is used.
Procedure:
- A bounding box of C-shaped front and rectangular back called a C bounding box is created with the height of 20c as the chord length. and length of 10c.
- Then the surface is created from edges and by using boolean operator the airfoil surface is removed as we need to study the fluid that is around the airfoil.
- Lines are drawn to dived the face into different parts for the structured meshing. Then the lines are projected onto the face.
- Then the design is saved and meshing is opened and proper edge sizing is given and face meshing is done. The first layer thickness around the airfoil edge should be less than or equal to the calculated first layer thickness.
- Naming for the Inlet, Airfoil, and outlet is given. The top and bottom of the enclosure can be named as far-field or can be named as inlet along with the arc.
- Import the mesh model created into the fluent and check for the mesh quality and improve it if any improvements can be made.
- Setup the solver.
- Give the boundary conditions. The inlet flow direction is changed for changing the angle of attack and y components are given for inlet velocity and lift and drag coefficient calculation.
- define lift and drag coefficient plots and create contours for pressure and velocity.
- Change convergence criteria if needed or uncheck the boxes to see the complete iterations to be performed.
- Initialize with hybrid initialization and perform steady-state simulations for around 1000 iterations or until solutions are converged.
- The plots and contours are obtained and the angles of attacks are changed for two velocities.
Solver setup:
Solver: Pressure based solve for incompressible flow, density-based solver for compressible flow
Viscous model: Spalart Allmaras(1 eqn) model is selected as it is specifically designed for airfoils and provides good results for the attached flows.
Energy: ON for Compressible flow, OFF for Incompressible flow
Methods: Coupled scheme
Pseudo transient is turned off
700 to 1000 iterations are performed depending on the stability attained.
Initialization: Hybrid
Boundary conditions:
Compressible flow:
Inlet velocity : 273 m/s
Inlet: velocity inlet
Airfoil: No-slip condition
Outlet: pressure outlet (gauge press 0)
In Compressible flow:
Inlet velocity : 52.15 m/s
Inlet: velocity inlet
Airfoil: No-slip condition
Outlet: pressure outlet (gauge press 0)
Plots and Contours:
Compressible flow:
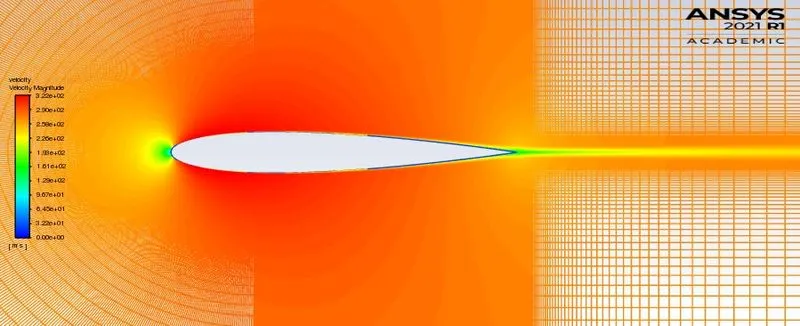
The flow is compressible as the match number is around 0.8 as the inlet velocity is 273m/s.
Velocity contour 0 deg angle of attack:
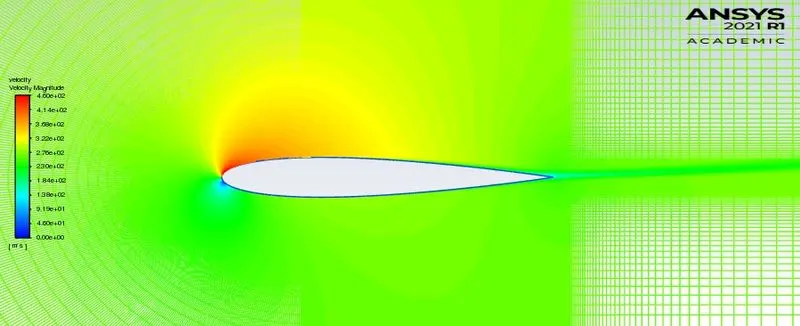
Velocity contour 5 deg angle of attack:
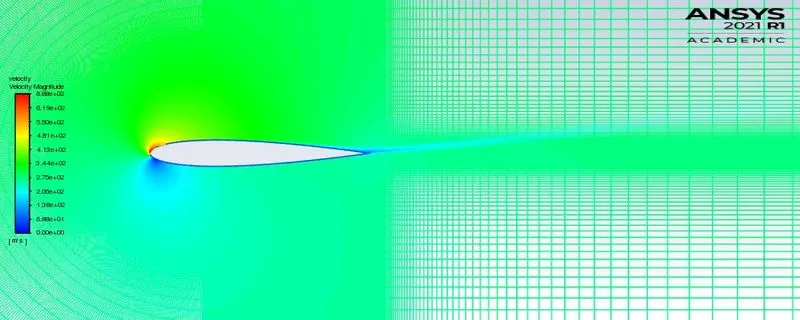
Velocity contour 10 deg angle of attack:
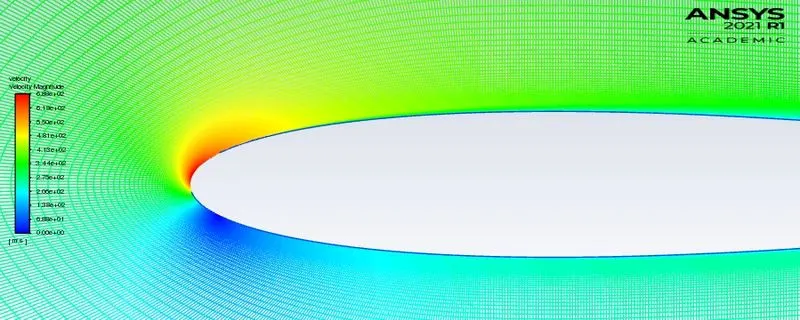
Velocity contour 15 deg angle of attack:
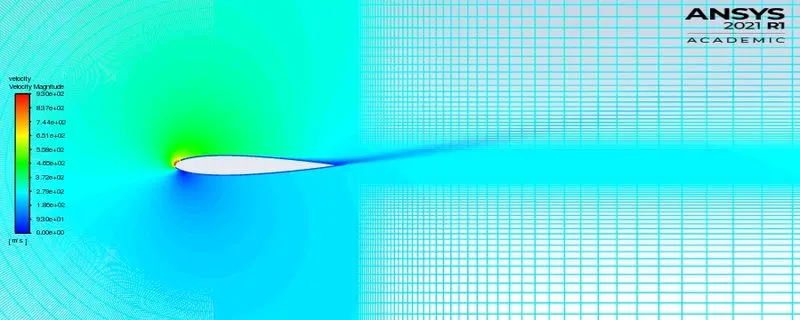
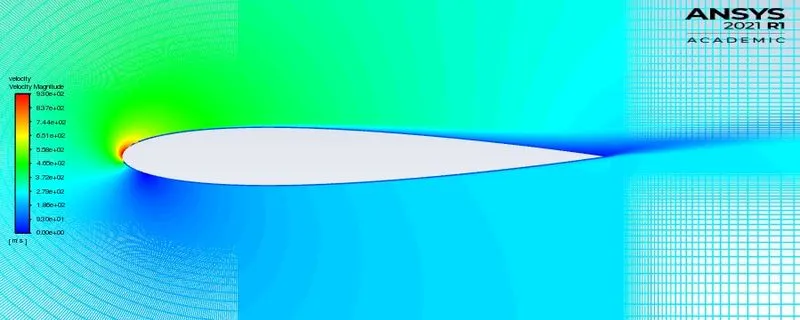
Velocity contour 20 deg angle of attack:
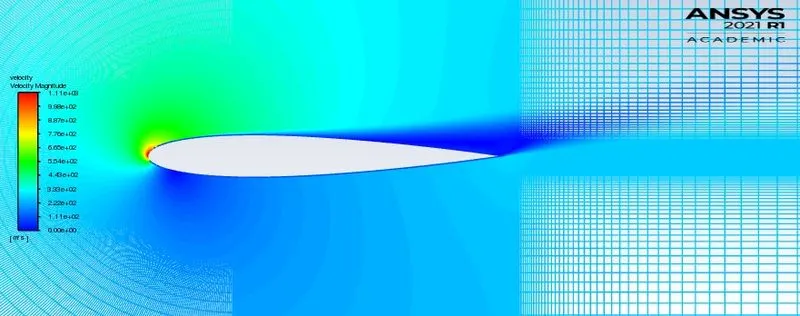
- It can be seen that for 'zero' angle of attack there is the same velocity of air below and above the airfoil, as it is a symmetric airfoil.
- For the small angle of attack, the velocity on the top of an airfoil is more.
- Stagnation point occurs at a point where the airflow first meets the airfoil, this point travels toward below the airfoil as the angle of attack increases.
- The velocity of the flow increases with the increase in the angle of attack.
- It can be seen that the flow separation is more for the angle of attack 20 deg.
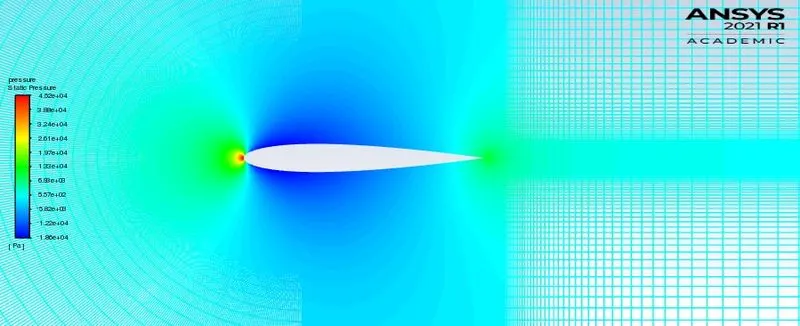
Pressure contour 0 deg angle of attack:
Pressure contour 5deg angle of attack:
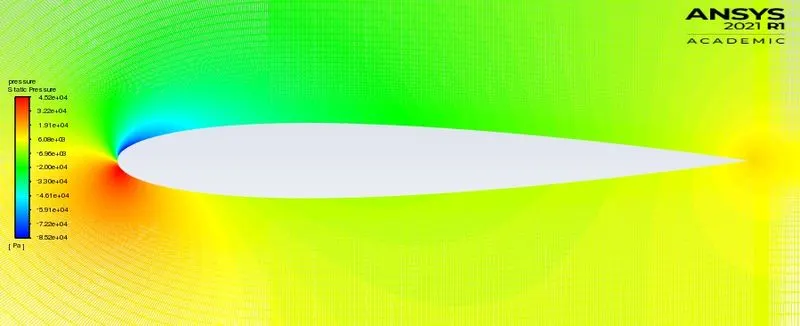
Pressure contour 10 deg angle of attack:
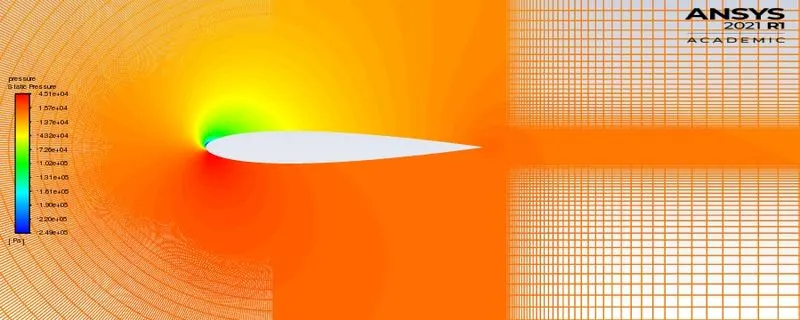
Pressure contour 15 deg angle of attack:
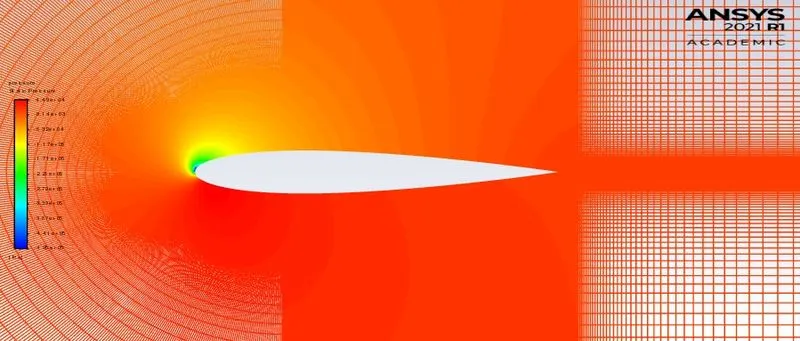
Pressure contour 20 deg angle of attack:
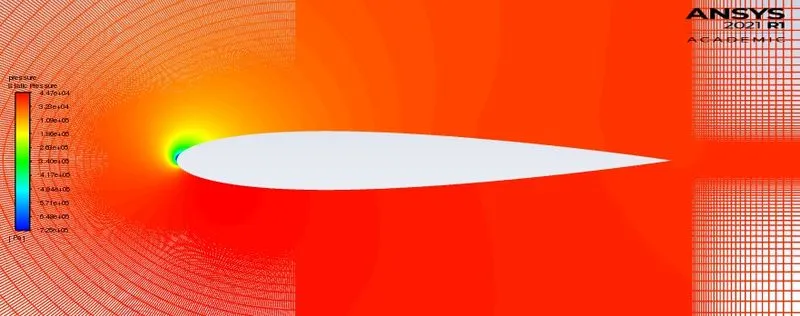
- Velocity is inversely proportional to the pressure as the pressure increases velocity decreases and vice versa.
- the point at which there is high pressure the velocity is less. The point where the velocity becomes zero where the air first meets the airfoil is called stagnation point and the pressure is called stagnation pressure.
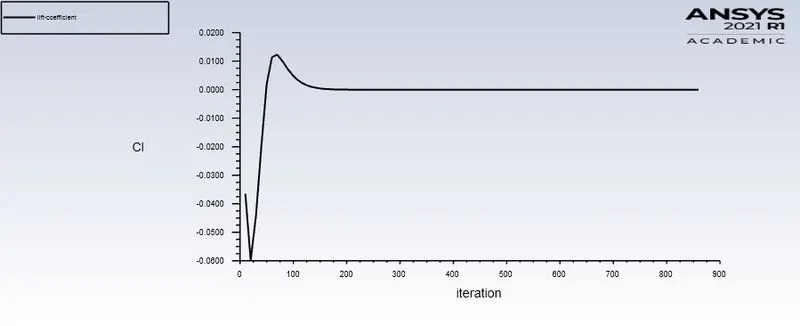
Lift coefficient plot at 0 deg angle of attack:
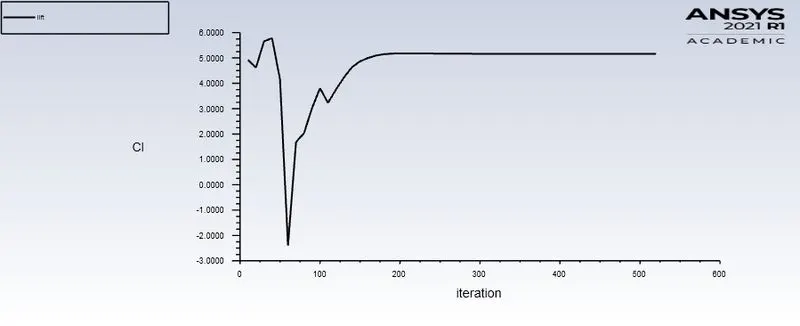
Lift coefficient plot at 5 deg angle of attack:
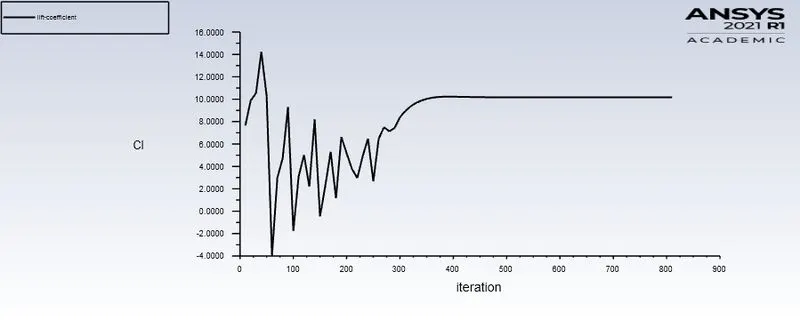
Lift coefficient plot at 10 deg angle of attack:
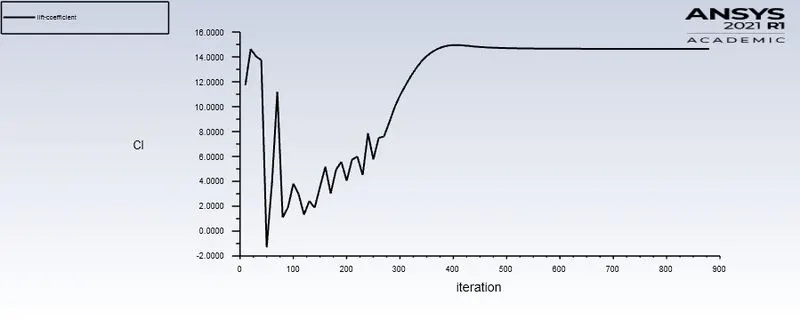
Lift coefficient plot at 15 deg angle of attack:
Lift coefficient plot at 20 deg angle of attack:
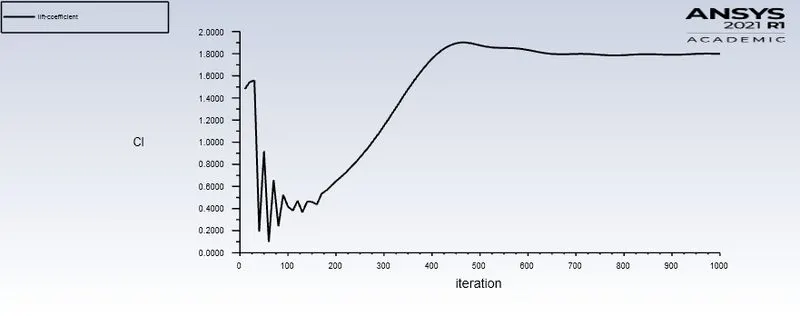
It can be seen that the lift coefficient increases with the increase in the angle of attack and increase till the critical angle of attack where the max lift is attained. After the critical angle of attack the lift coefficient drops. This is called stalling. The max lift is attained around an angle of attack 15 deg.
drag coefficient plot at 0 deg angle of attack:
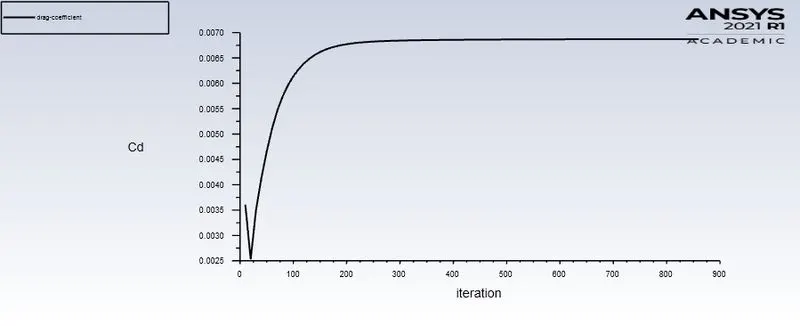
drag coefficient plot at 5 deg angle of attack:
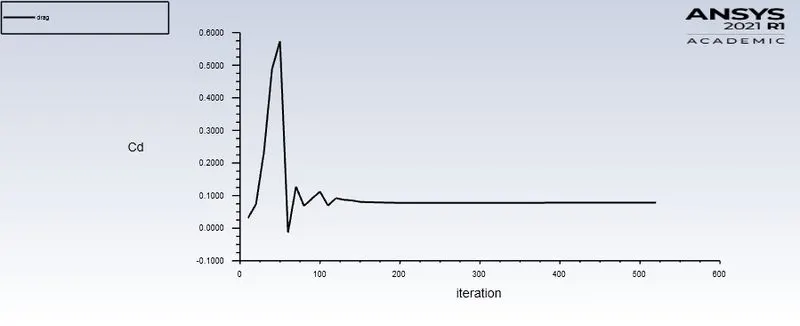

drag coefficient plot at 10 deg angle of attack:
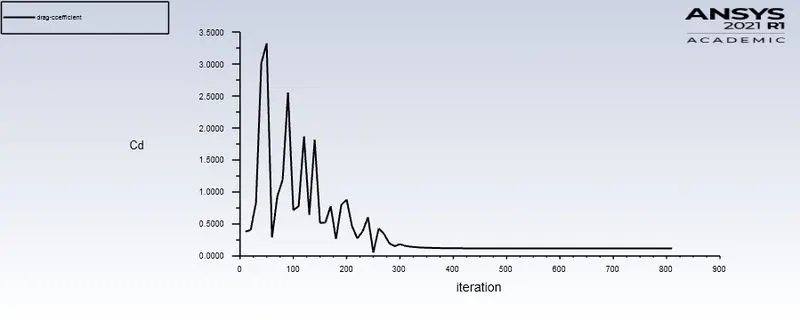

drag coefficient plot at 15 deg angle of attack:
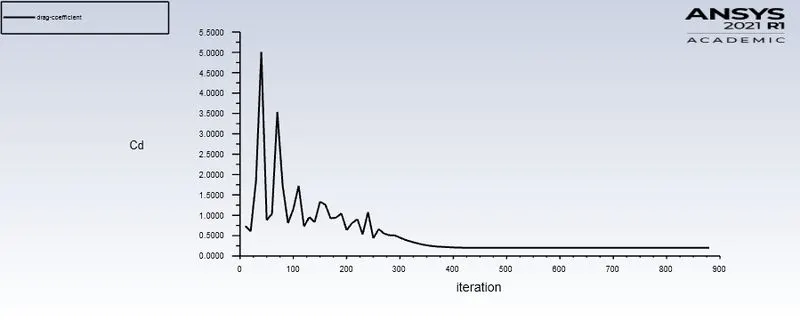

Lift and drag coefficient at 20 deg angle of attack:

The drag coefficient increases with the angle of attack as the flow separation increases.
Incompressible flow:
The flow is compressible as the match number is around 0.3 as the inlet velocity is 52.15m/s.
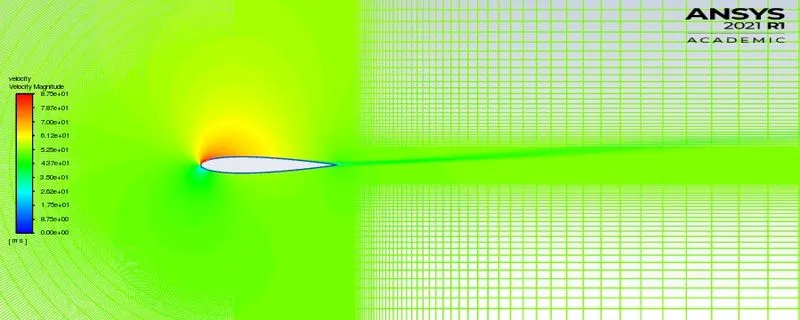
Velocity contour 5 deg angle of attack:
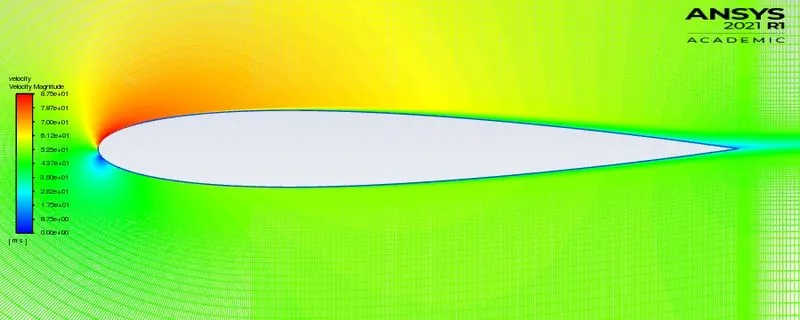
Velocity contour 10 deg angle of attack:
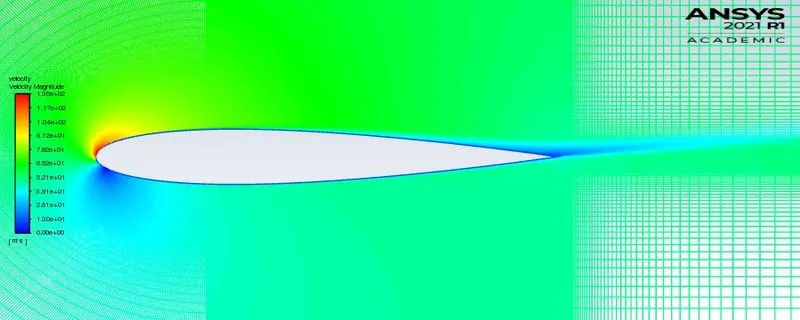
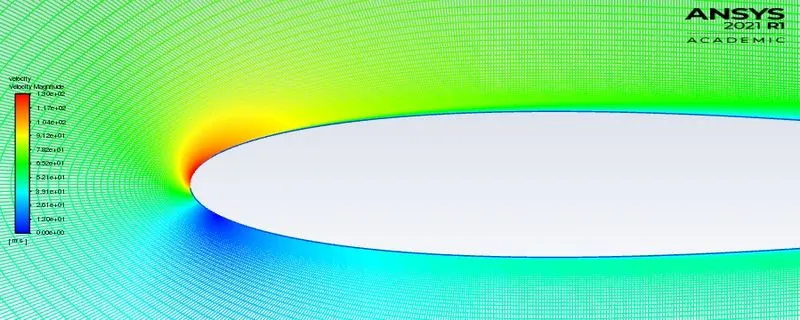
Velocity contour 15 deg angle of attack:
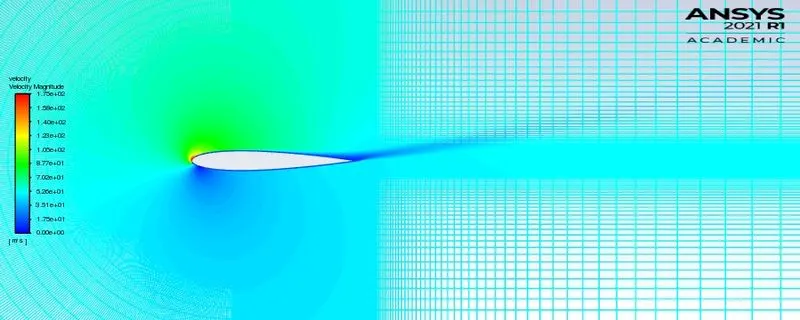
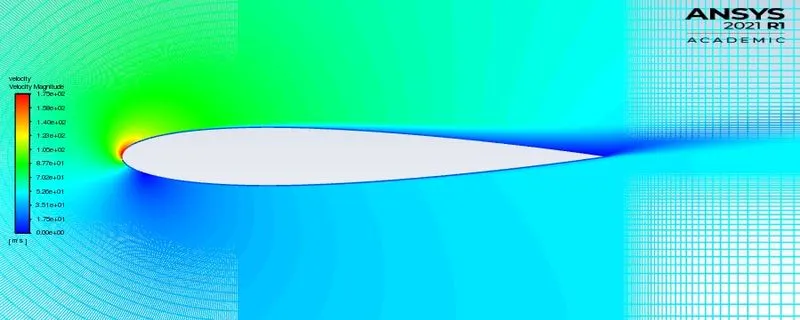
Velocity contour 20 deg angle of attack:
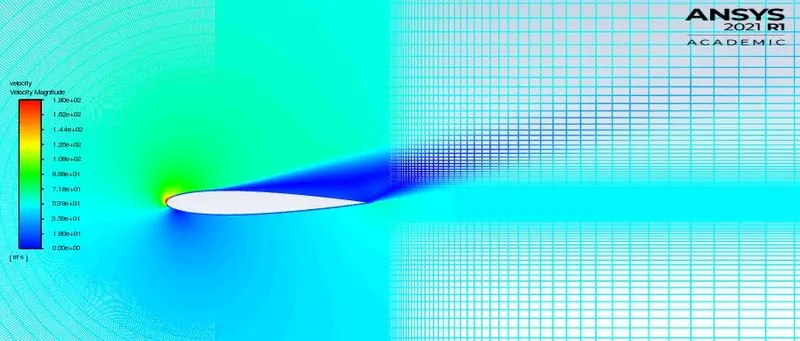
In the incompressible flow, the flow velocity and pressure will not vary much with the increase in the angle of attack, but this is significant. This is because the inlet velocity is low.
- It can be seen that the flow separation is more for the angle of attack 20 deg. Stalling occurs around this angle.
Pressure contour 5 deg angle of attack:
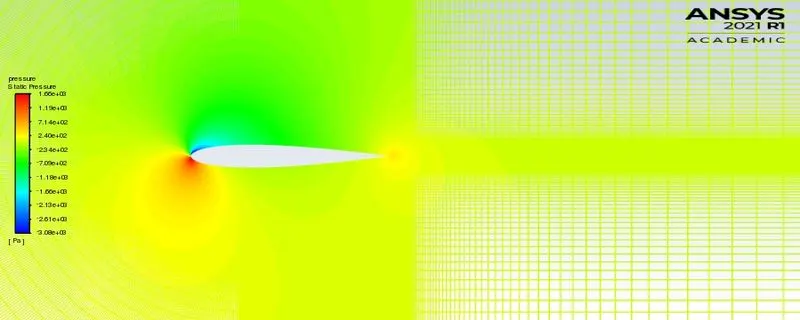
Pressure contour 10 deg angle of attack:
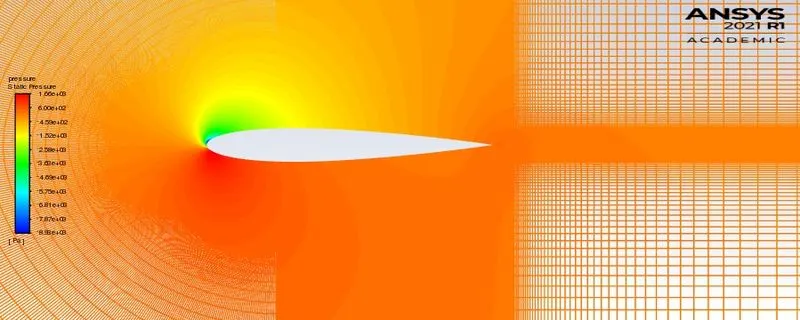
Pressure contour 15 deg angle of attack:
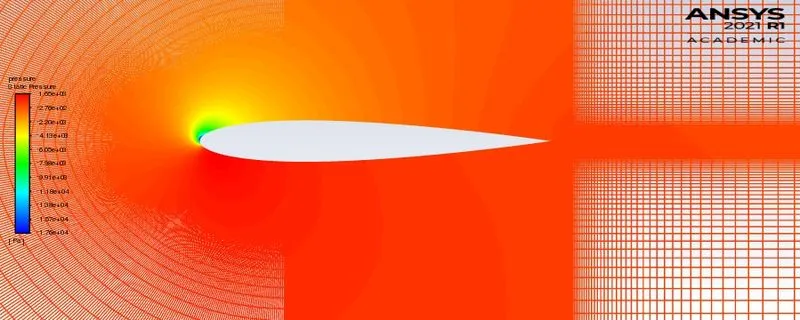
lift coefficient plot at 5 deg angle of attack:
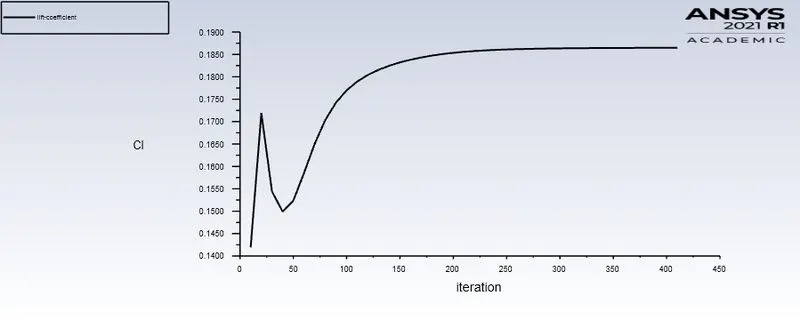
lift coefficient plot at 10 deg angle of attack:
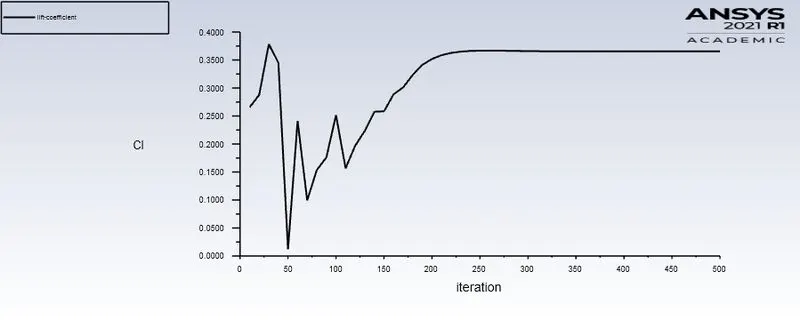
lift coefficient plot at 15 deg angle of attack:
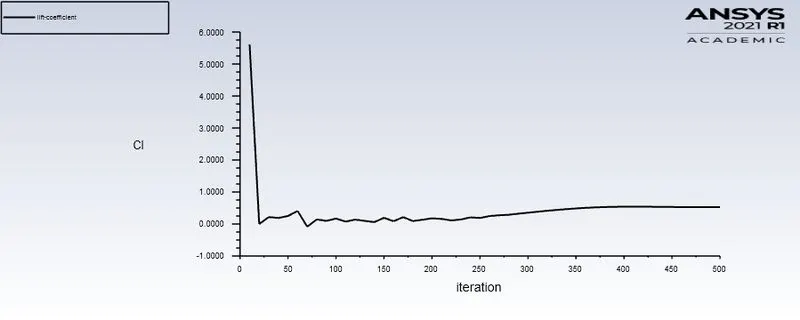
lift coefficient plot at 20 deg angle of attack:
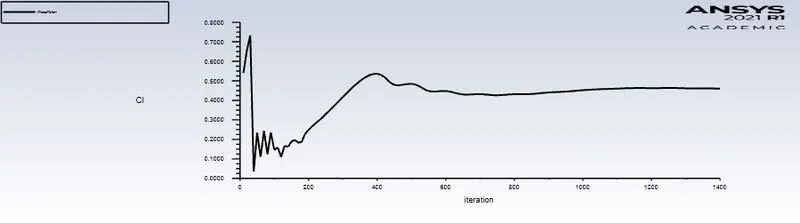
It can be seen that the lift coefficient increases with the increase in the angle of attack and increase till the critical angle of attack where the max lift is attained. After the critical angle of attack the lift coefficient drops. This is called stalling. The max lift is attained around an angle of attack 15 deg. The lift obtained from the compressible flow when the velocity is 273 is more compared to the incompressible flow.
drag coefficient plot at 5 deg angle of attack:
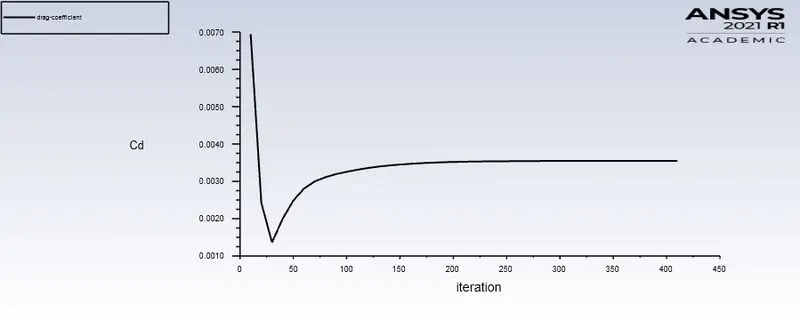

drag coefficient plot at 10 deg angle of attack:
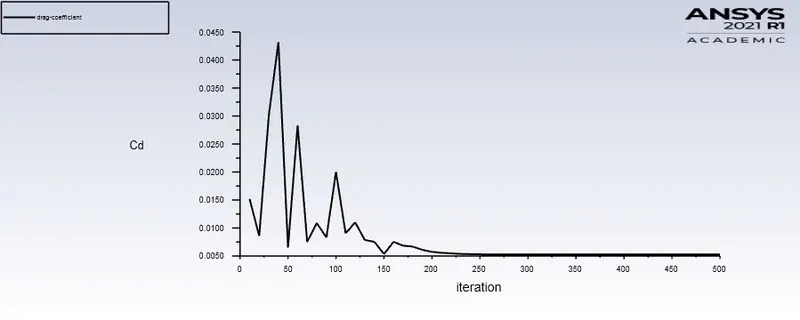

drag coefficient plot at 15 deg angle of attack:
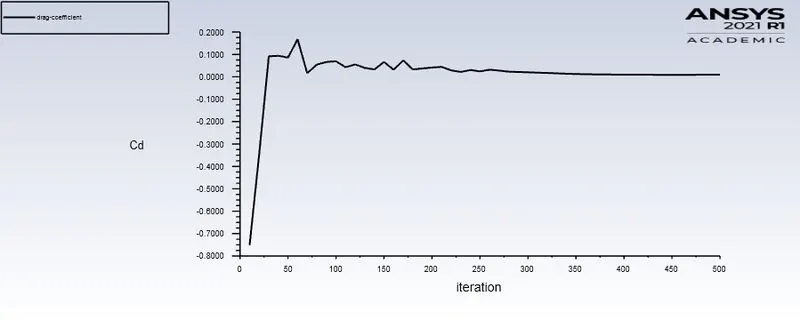

drag coefficient plot at 20 deg angle of attack:
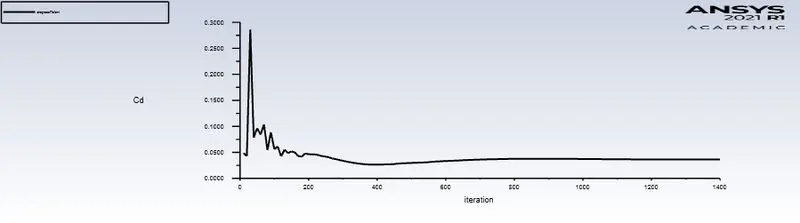

The drag coefficient increases with the increase in the angle of attack as the flow separation increases. The drag is increased with the angle of attack as the flow separation means the increase in the turbulence region.
|
Parameters |
Compressible Flow |
In-compressible Flow |
||||||||
|
Angle of attack |
0 deg |
5 deg |
10 deg |
15 deg |
20 deg |
0 deg |
5 deg |
10 deg |
15 deg |
20 deg |
|
Coefficient of Lift |
0(almost) |
5.165 |
10.163 |
14.65 |
1.789 |
0(almost) |
0.1865 |
0.365 |
0.5244 |
0.459 |
|
Coefficient of Drag |
0.0068 |
0.078 |
0.1196 |
0.203 |
0.049 |
0.0030 |
0.0036 |
0.0053 |
0.0091 |
0.0365 |
Conclusion:
The following conclusions were made from the simulations performed and plots obtained:
- There will be zero net lift at zero Eagle of lift as the airfoil is symmetrical.
- The lift coefficient increases with the increase in the angle of attack. but this increase is until a critical angle of attack is reached.
- The lift and drag coefficients are more for the compressible flow when compared with the incompressible flow.
- Stall occurs as the critical angle of attack is reached it can be known as the lift starts to drop suddenly. It happens to be less than 20 deg for this airfoil.
- The stalling takes place as the flow separation (turbulence region) starts to grow towards the leading edge from the trailing edge.
- The drag coefficient increases with the increase in the angle of attack. As the flow separation creates more drag.
- The Critical angle of attack is independent of the flow velocity of the fluid as it is the same for the different velocities which is around 20 deg.