Week 7 - Mid-term Project - Natural Convection
AIM: Simulate cooling of Low Voltage Panel using natural convection heat transfer.
Introduction:
Low voltage panels are used to distribute power from main power source to different branches. Main components of a typical electrical panel are listed below:
- Housing / Enclosure : It houses all the components of the panel. Generally it is made up of steel material. Grills are used to circulate air through the enclosure. Heat transfer from the enclosure takes place by radiation and convection.
- Busbars : Busbars are used to distribute power between different circuit breakers. It is generally made up of material with high electriccal conductivity. Also, cross section of the busbar is made larger to reduce the electrical resistance.
- Circuit breakers : Circuit breakers are used to distribute power to different branches at desired time and of required amount.
- Cables: Cables are used to supply power to the different components from circuit breakers. It is also made up of high electrical conductivity material to reduce power loss.
Geometry Modeling:
Circuit breakers are created with dimensions as shown below. Default material Aluminum Extruded is used. Radiation is turned on for all the components as one can not neglect it with natural convection heat transfer. Following table lists power dissipation for all the circuit breakers.
| Sr No | Name | Power Dissipation (W) |
| 1 | IG | 168.92 |
| 2 | I1 | 56.16 |
| 3 | I2 | 49.36 |
| 4 | I3 | 49.36 |
| 5 | I4 | 39.46 |
| 6 | I5 | 12.44 |
| 7 | I6 | 0 |
| 8 | I7 | 0 |
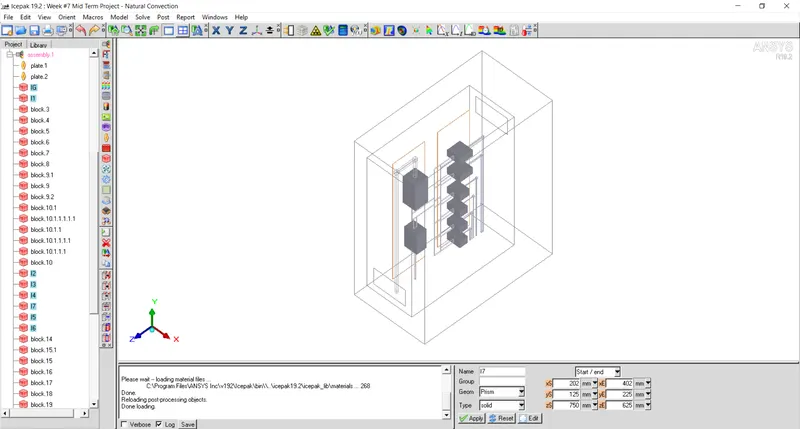
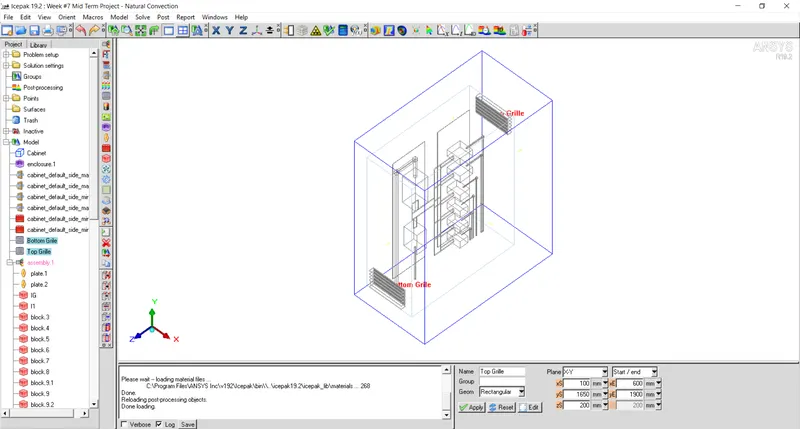
Grills are created on the two opposite sides of the panel. From bottom grille, air enters the panel takes heat from the components and it raises due to buoyancy effects. Heated air comes out from the top grille. Free area ratio is set to 0.5.
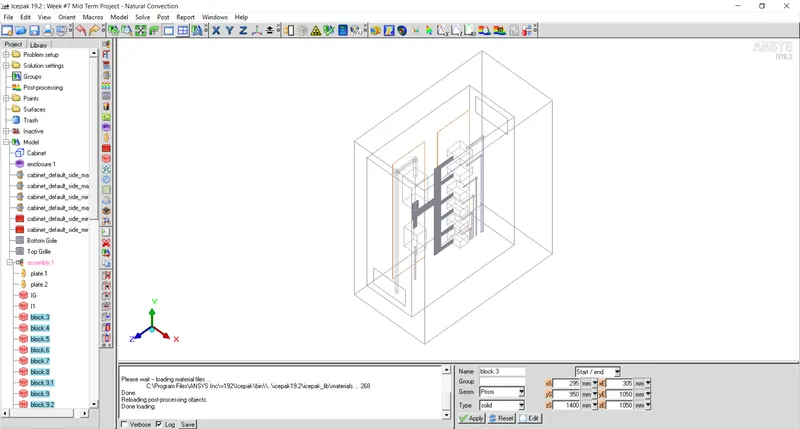
Busbars with appropriate dimensions and power dissipations are created as shown below.
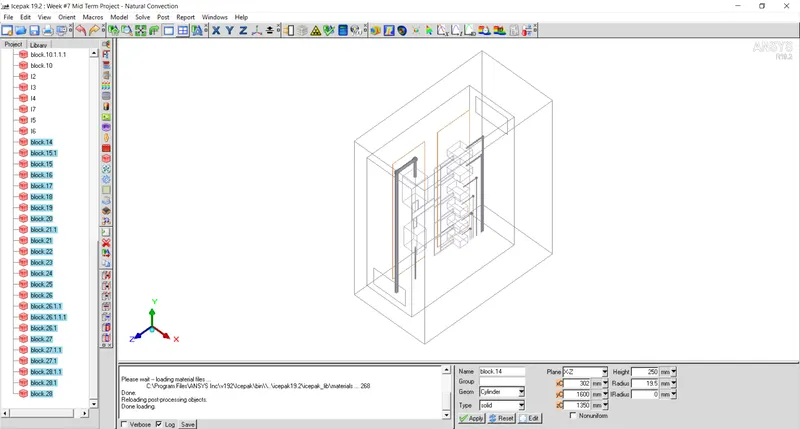
Cables are created to distribute power from busbar to the circuit breakers as shown below.
Mesh Generation
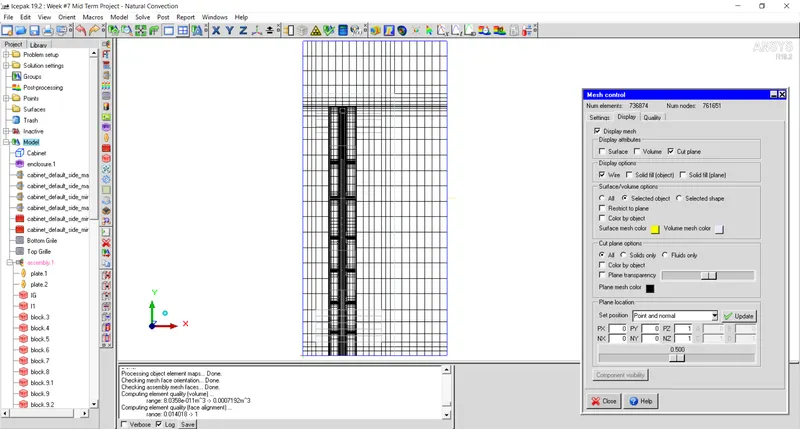
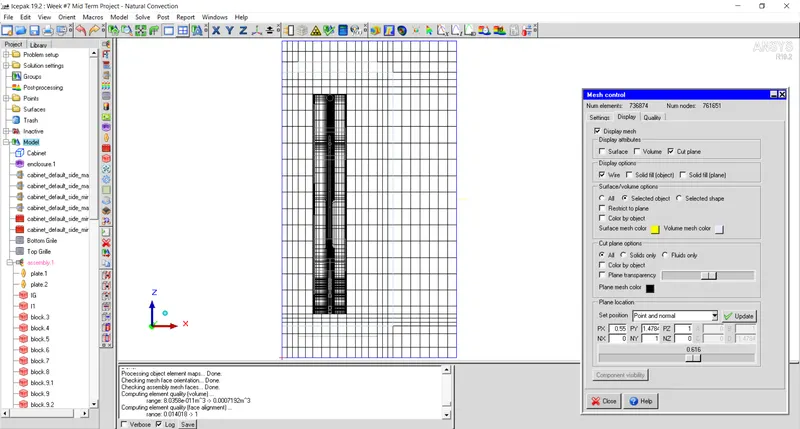
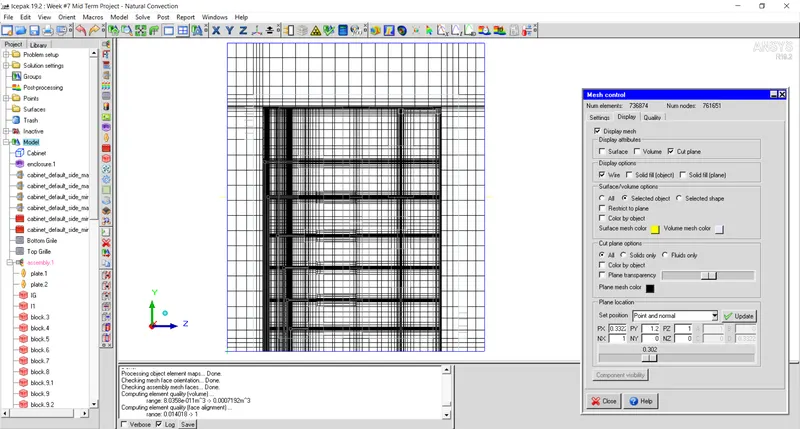
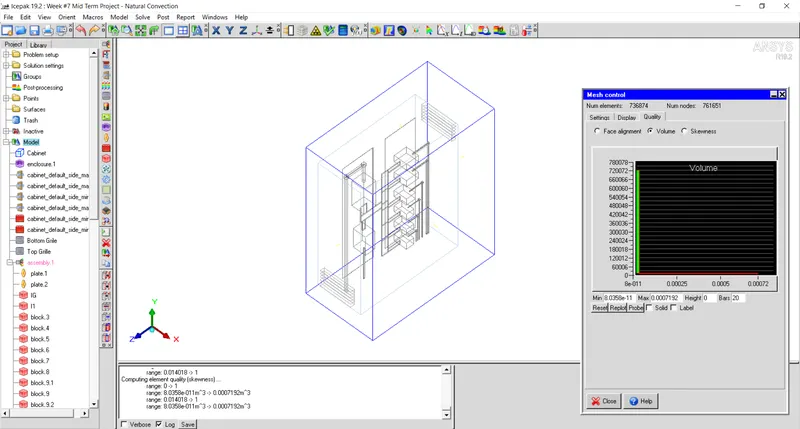
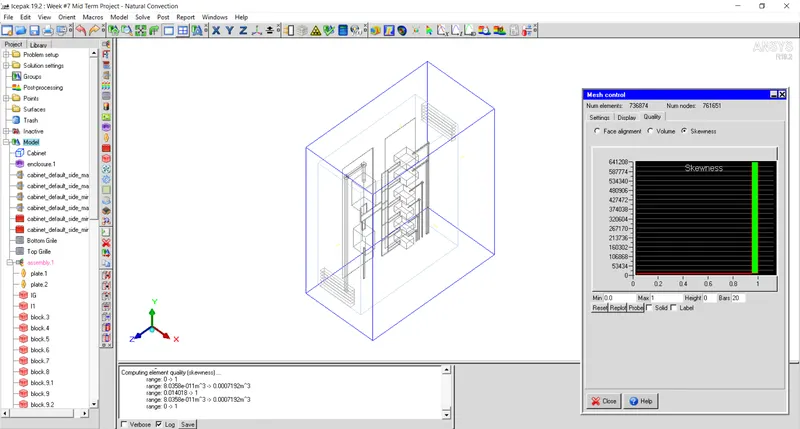
Mesh is generated using Non-conformal meshing technique. Mesh details are as given below:
No of elements : 736874
Mesh Quality:
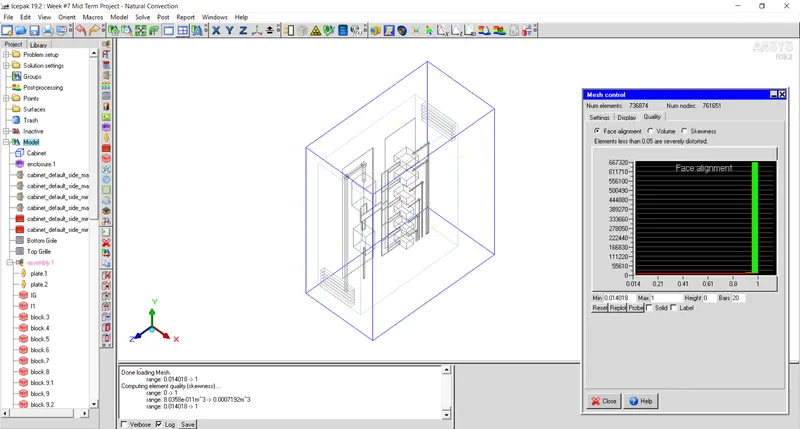
Face alignment:
Volume:
Skewness:
Solver setting:
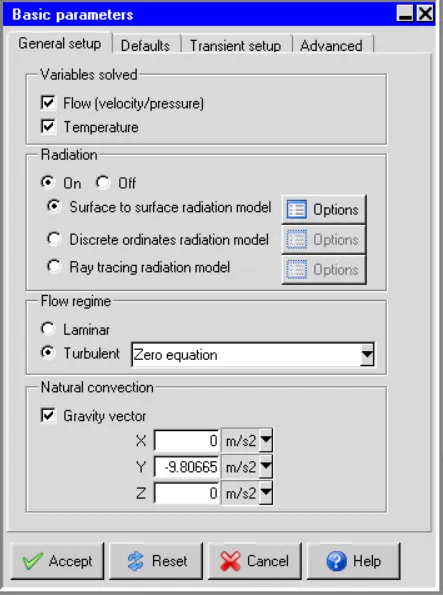
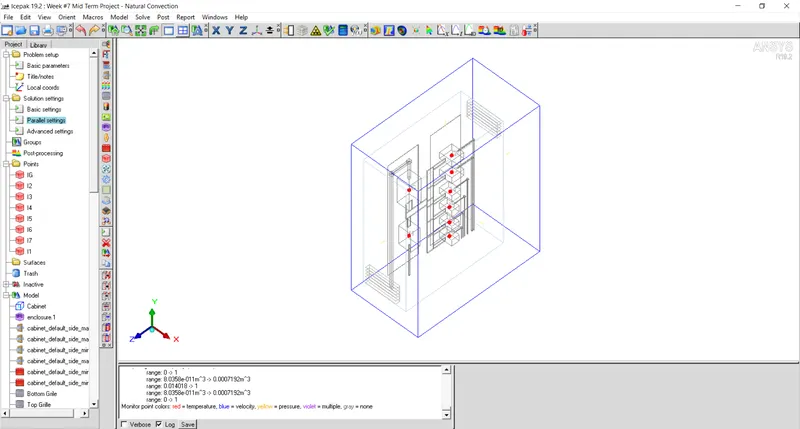
Basic parameters
Radiation is turned on as it plays significant role in heat transfer with natural convection. For first cut solution, S2S model is used to solve the problem. Gravity is enabled in -Y direction with magnitude `9.81 m/s^2`.
Ambient temperature is set to `25^oC`.
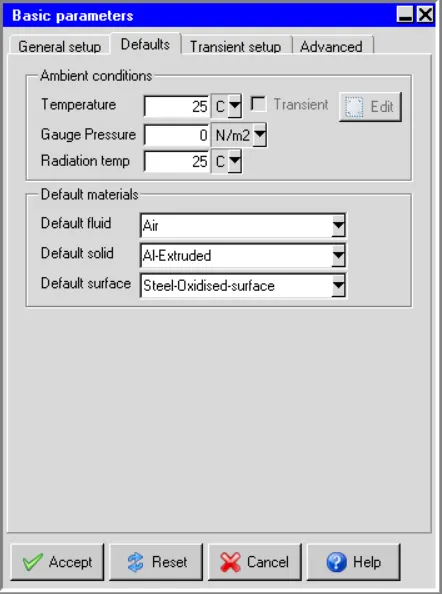
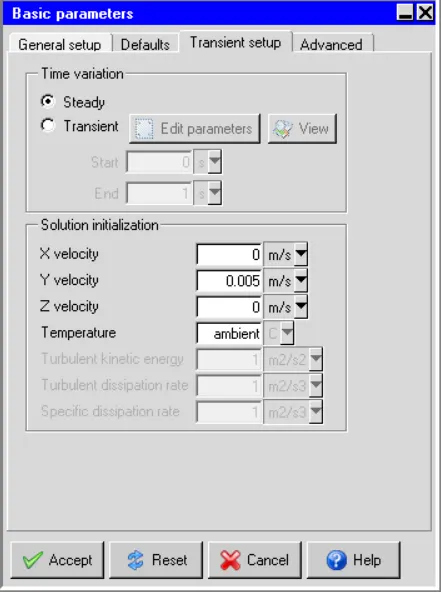
Steady state simulation is performed with initial velocity of `0.005m/s` in +Y direction.
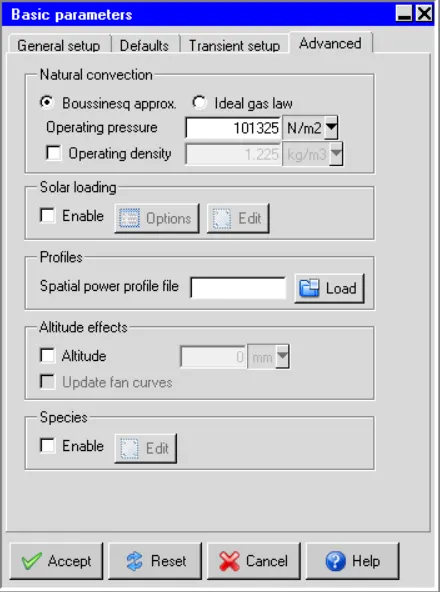
Bousinessq approximation is used for natural convection heat transfer.
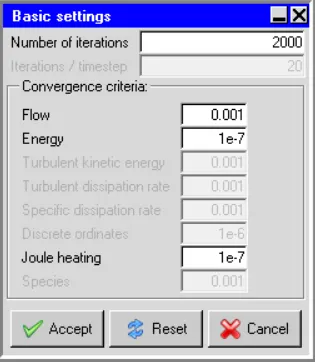
No of iterations is set to `2000`.
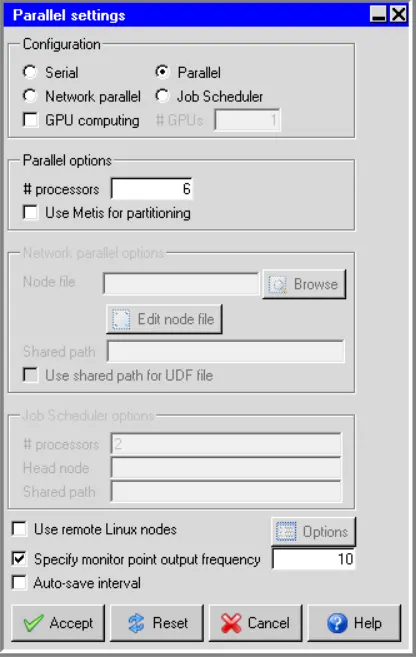
Parallel processing is used with number of processors as `6`.
Monitor points are set at the centroid of all the circuit breakers.
Convergence Plot:
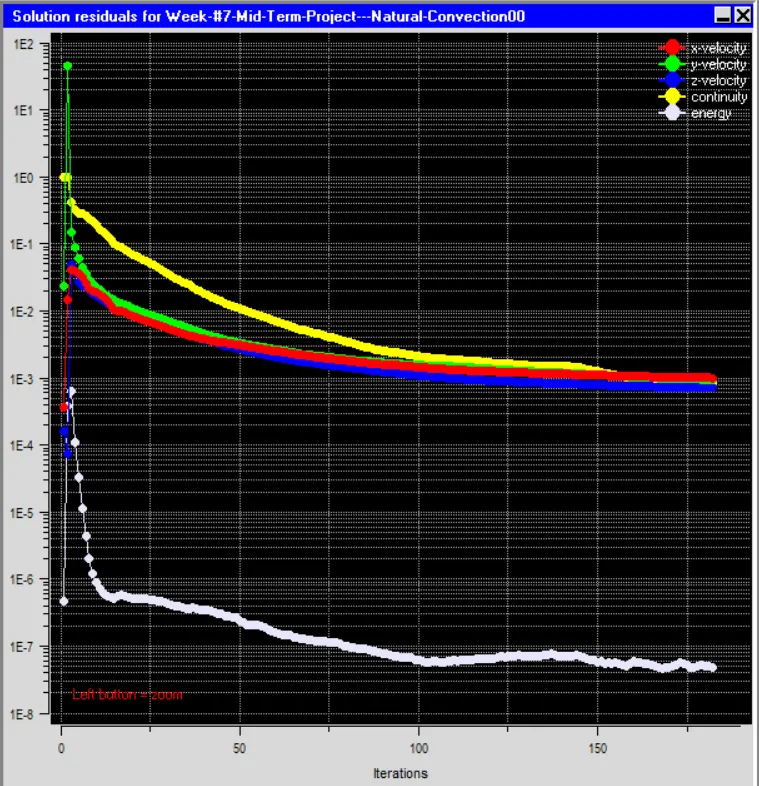
From below convergence plot, it can be observed that solution converged after `180` iterations as there is not any change in residuals pattern.
Monitor Points:
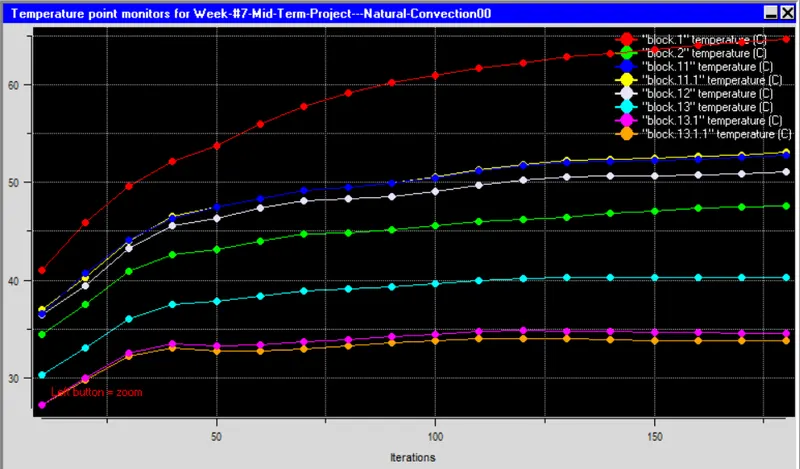
Following figure shows temperature variation of all the circuit breakers. It can be observed that solution has been converged as the temperature of monitor points are not changing with iterations.
Results and Discussion:
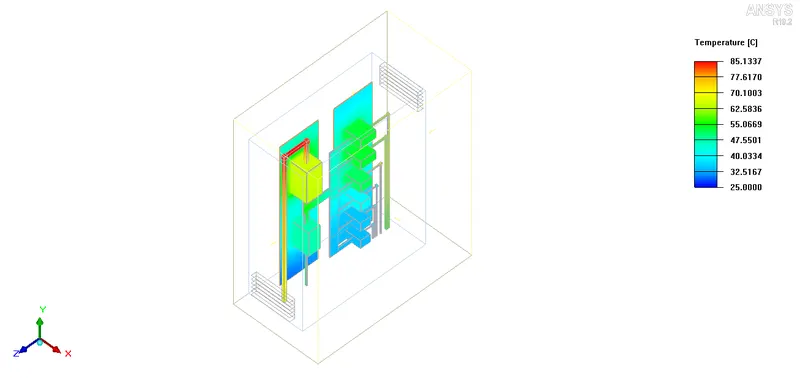
a. Temperature contour on object faces
Tempetature contoir is plotted on the face of circuit breakers, cables and busbars as shown below. It can be observed that maximum temperature of `85^oC` is observed at the main cable.
b. Temperature contour on cut plane
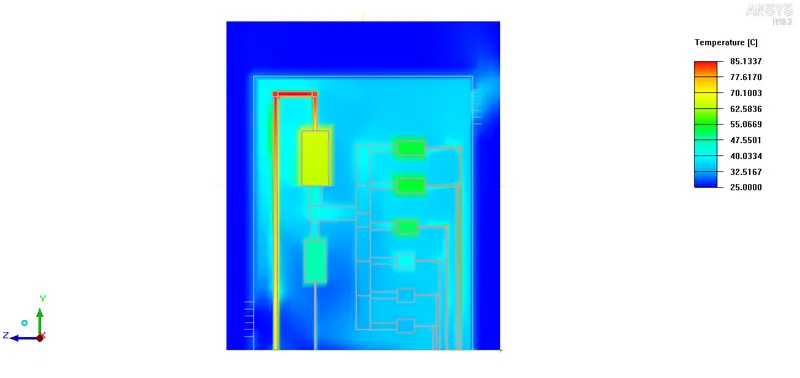
Temperature contour is plotted on the mid plane of the domain as shown below. From figure below the temperature of air can be observed along with temperature of all the components. It can be observed that air entering from the bottom grille is at lower temperature. As it comes in contact with components that generates heat, its temperature increases and rises as its density decreases. The air that comes out from top grille is at higher temperature.
c. Temperature contour on housing surface
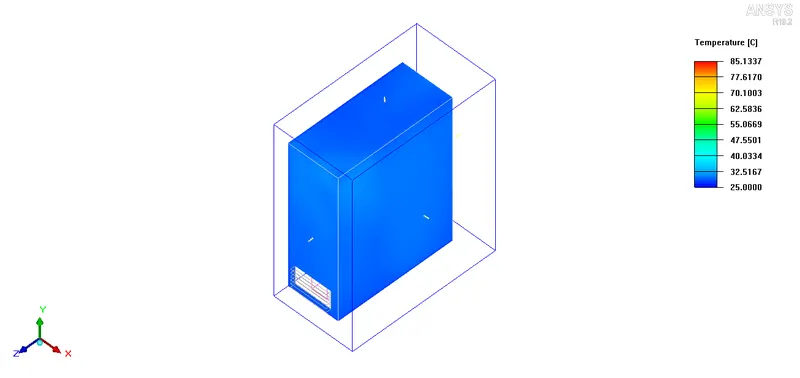
To observe temperature of panel housing, temperature contour is plotted as shown in figure below. As the air becomes hot after taking heat from the components, its temperature rises and that gives rise to the enclosure temperature.
c. Veclocity vector on cut plane
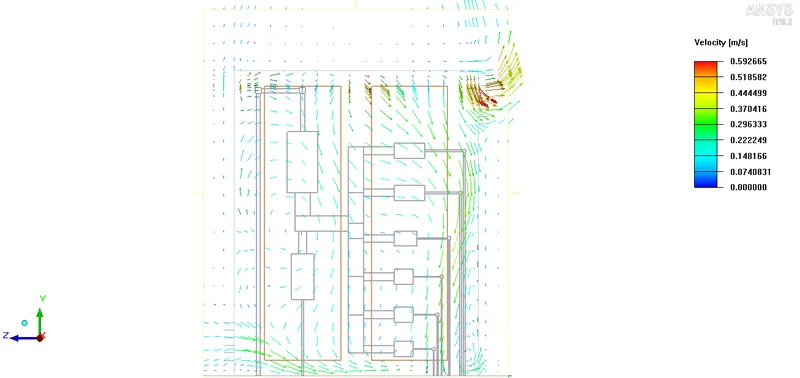
From velocity vector on cut plane it can be seen that air enters from bottom grille and comes out from top grille.
d. Velocity contour on cut plane
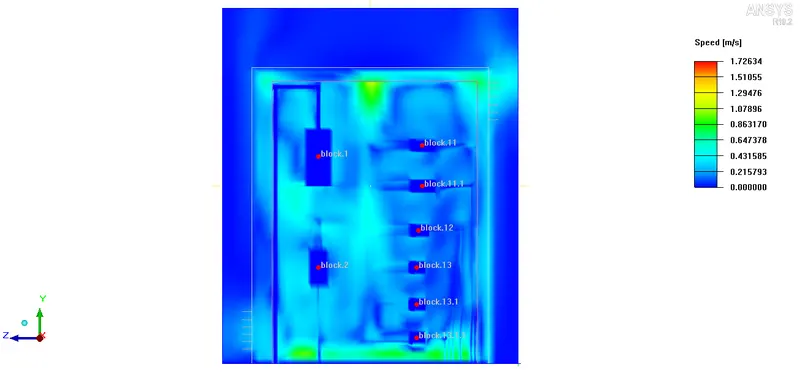
Velocity contour is plotted on the mid plane of the panel as shown below. It can be observed that air velocity increases as it gets heated. Lower velocities are observed near the walls of the housing.
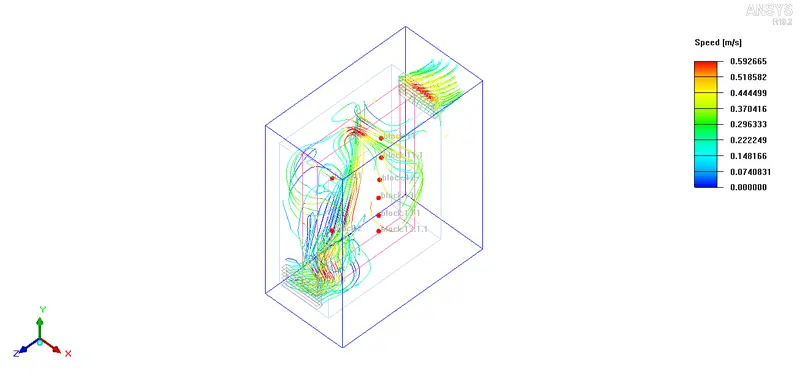
e. Particle streamlines
Conclusion:
From results it can be observed that maximum temperature of `85^oC` is attained at busbar D. The maximum temperature observed is in the acceptable range, hence the panel is safe for the operation.
Enclosure temperature increases with increase along with elevation.
Maximum air velocity of `0.592m/s` is observed due to buoyancy effect.