Week 12 - Final Project - Modelling and Analysis of a Datacenter
- Introduction to Datacenter Cooling
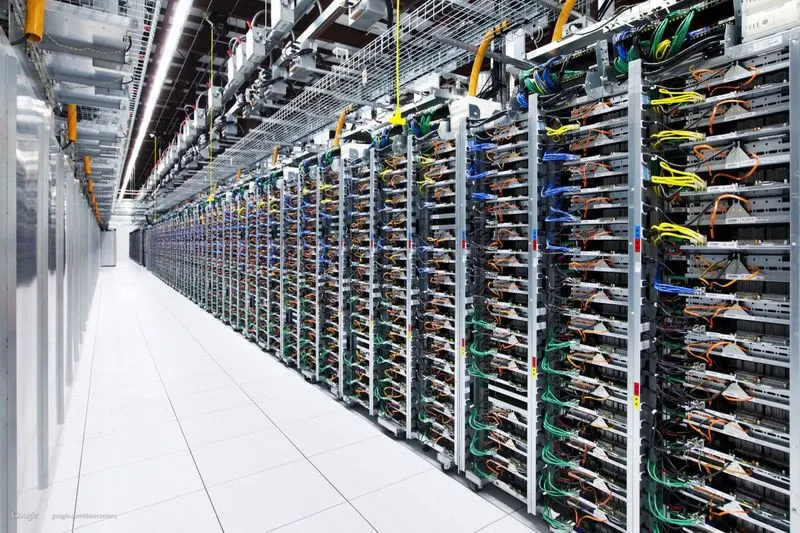
Datacenter produces large amount of heat and this gives rise to the temperature of the datacenter components. As the datacenter contains the major portion of electronic components, the performance of the electronics components and hence datacenter significantly gets impacted by operating temperature. To avoid damage to the components due to temperature rise, it is necessary to remove heat generated inside datacenter to maintain the optimum operating temperature. To maintain the desired optimum temperature within datacenter, CRAC (Computer Room Air-Conditioning) is employed. One of such datacenter is shown in the below image.
Below steps shows the procedure to carry out the thermal simulation of such datacenter using ANSYS Icepak module.
- Simulation consists of below major steps:
1. Creation of geometry,
2. Domain discretization using Meshing,
3. Solving problem using ANSYS FLuent solver,
4. Post processing the results,
5. Conclusion
> Step - 1 : Geometry modeling
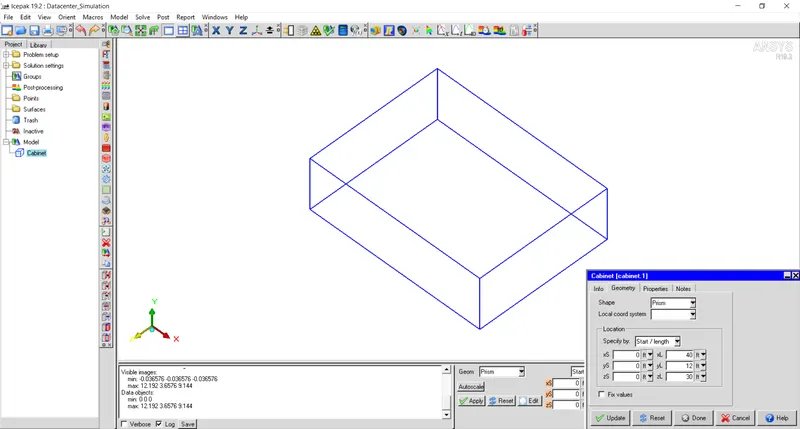
- Change cabinet size to `40ft times 12ft times 30ft`.
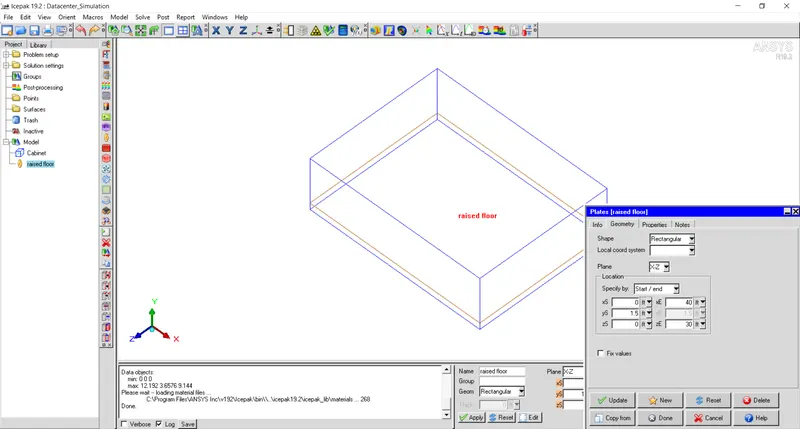
- Insert a plate in X-Z plane to create a raised floor.
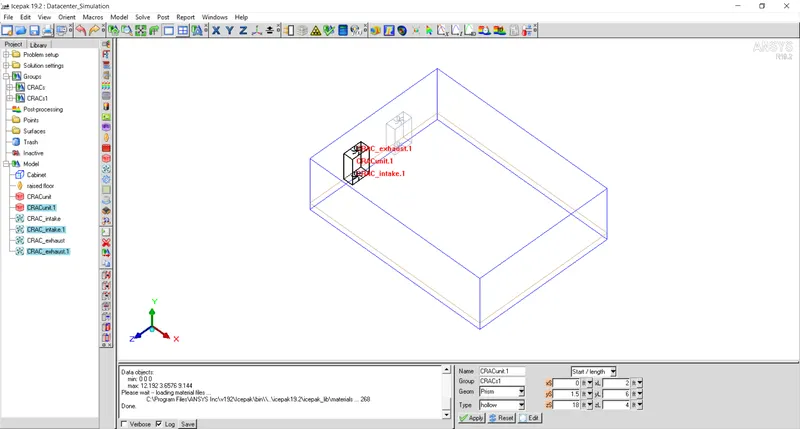
- Create a CRAC unit using Macros > Geometry > Datacenter > CRAC Unit.
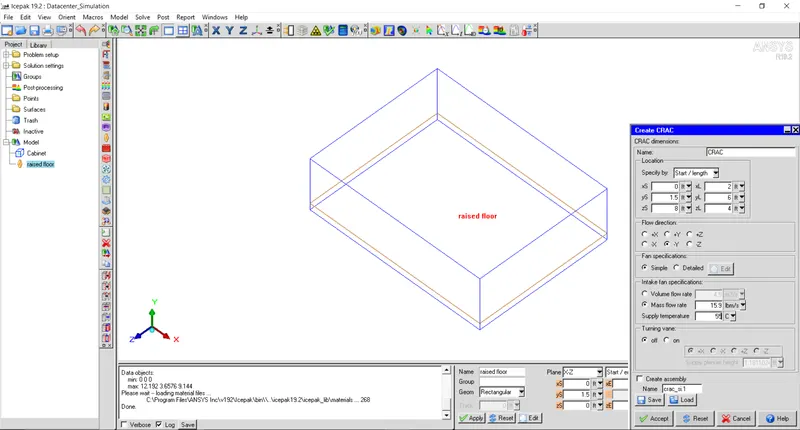
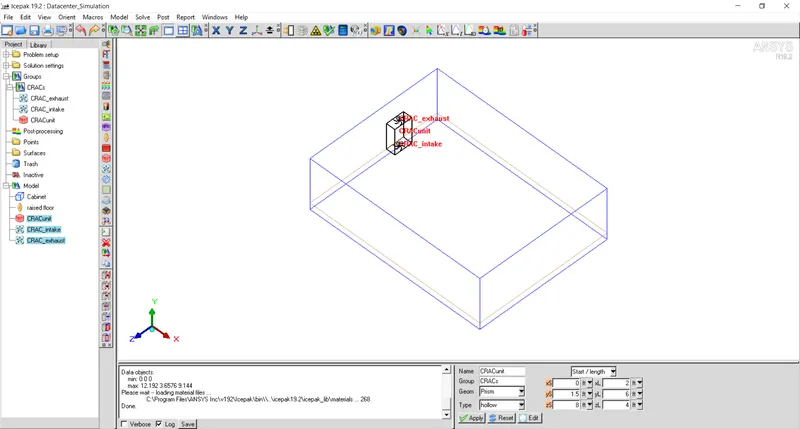
Create a group named 'CRACs' from the components of first CRAC unit.
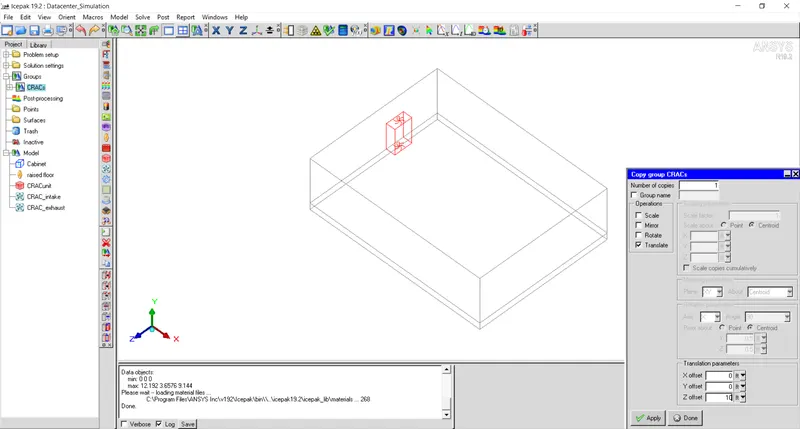
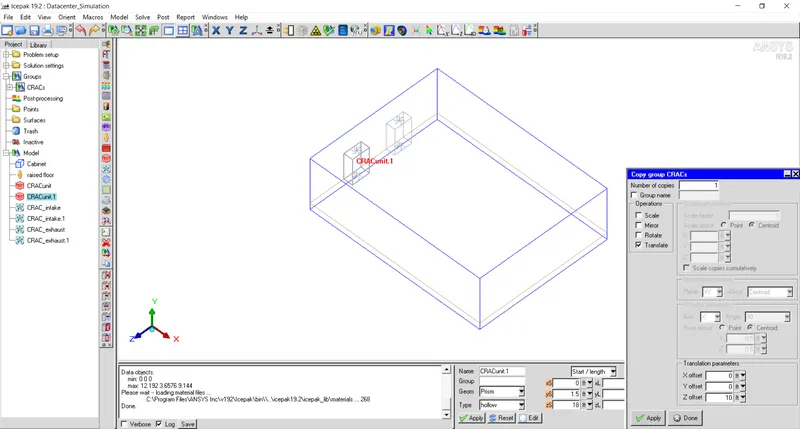
Similarly, copy the same CRAC unit in Z direction at a distance of `10ft` and create group named 'CRACs1' using components of second CRAC unit.
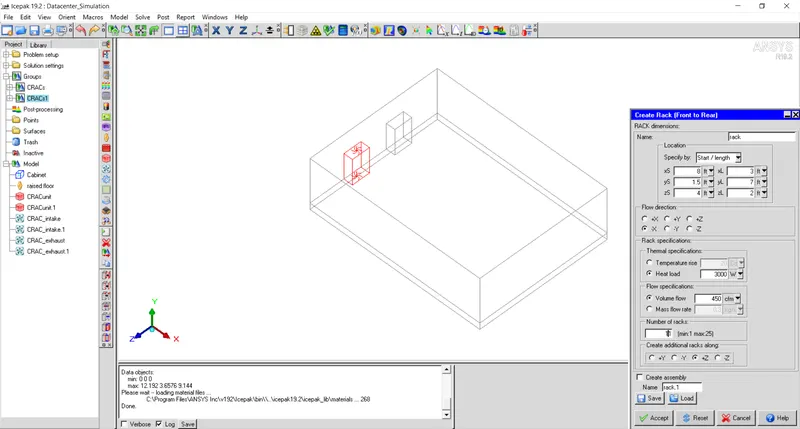
- Create first row of server racks using Macros > Geometry > Datacenter components > Front to Rear rack.
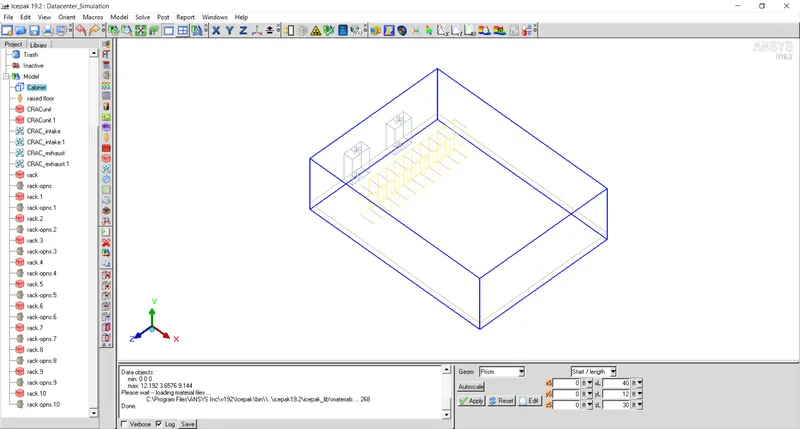
- Create a group from all the racks created and name it as 'RACKs'.
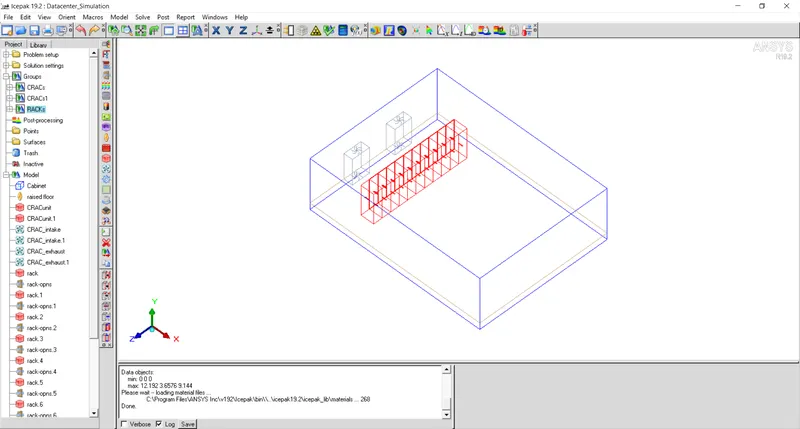
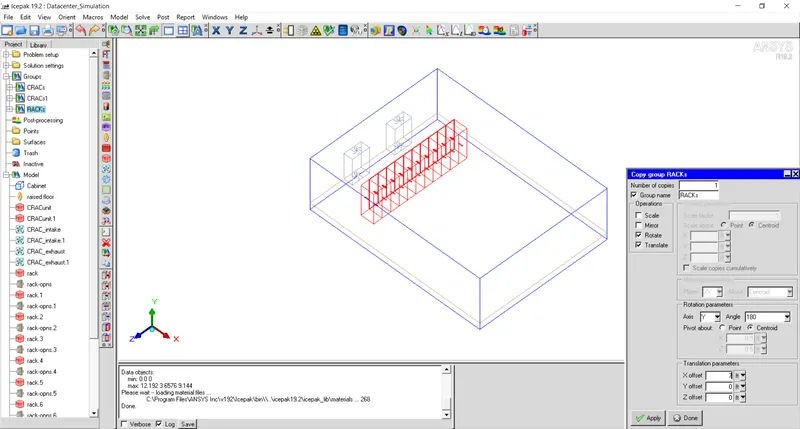
- To create another adjacent row of rack with same configurations and flow direction in +X direction, copy the group named 'RACKs' and first rotate it by 180 degrees about Y axis and then translate it in X direction by a distance of `7ft`.
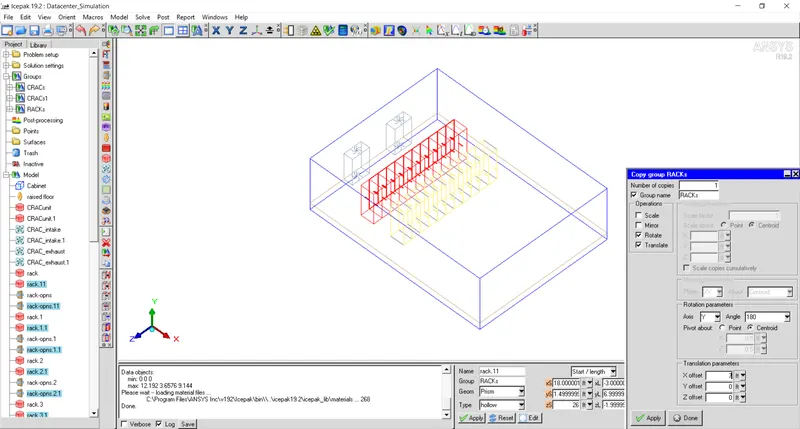
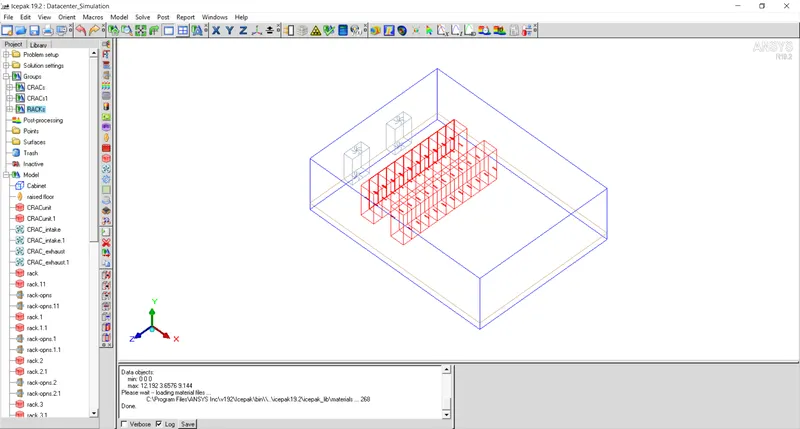
Including all the racks in the same group with name 'RACKs'
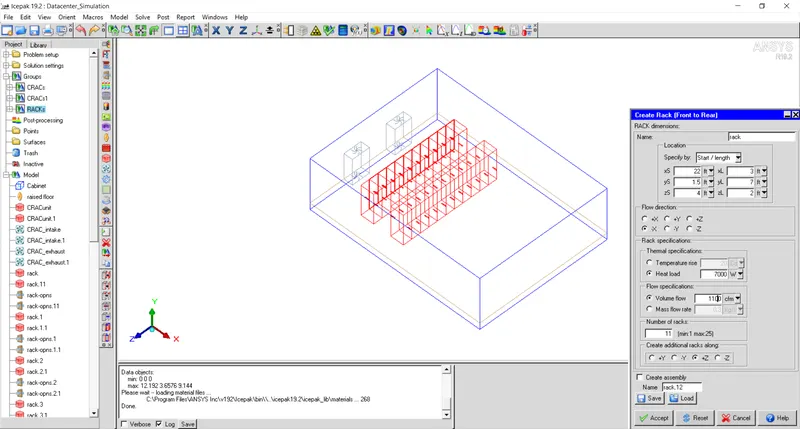
- Craete a row of high density racks with power dissipation of `7000W`.
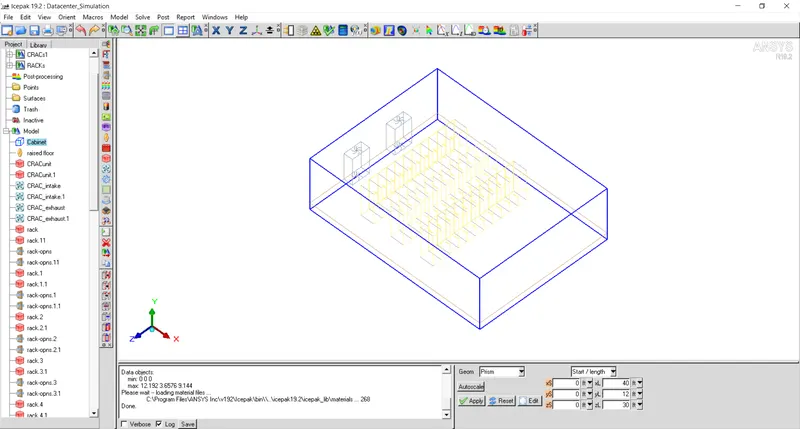
Create a group from the components of all the high density racks and name it as 'HDRacks'.
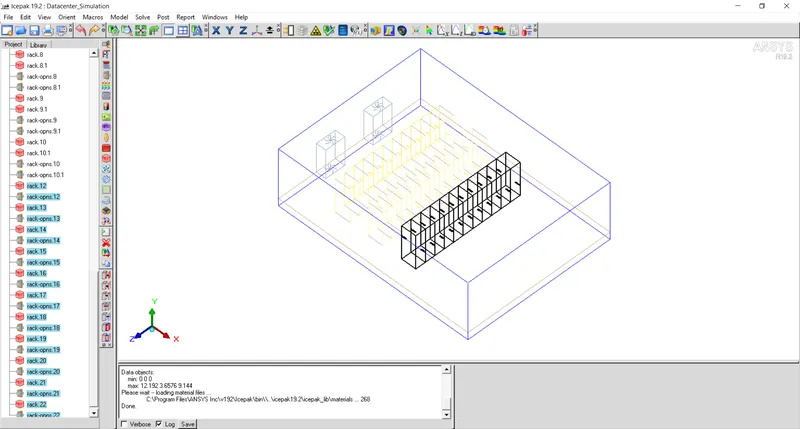
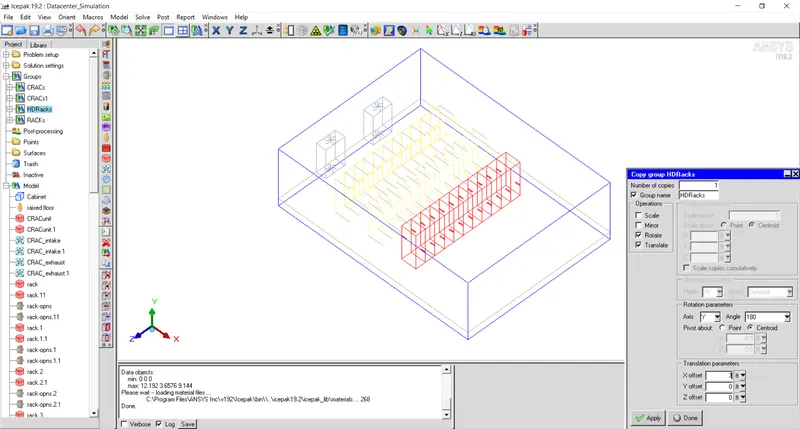
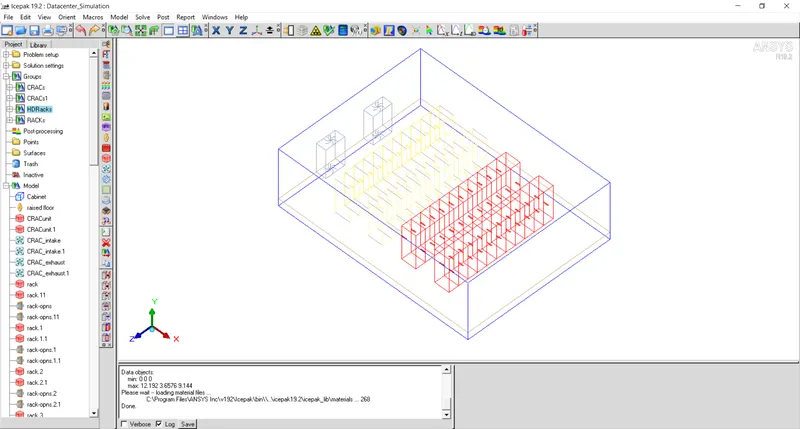
To create another row of high density racks, copy the existing row of high density rack with rotation of `180^o` wrt to Y axis and translate with the distance of `7ft` in +X direction.
Include all the components of this row, spcify same group name as 'HDRacks'.
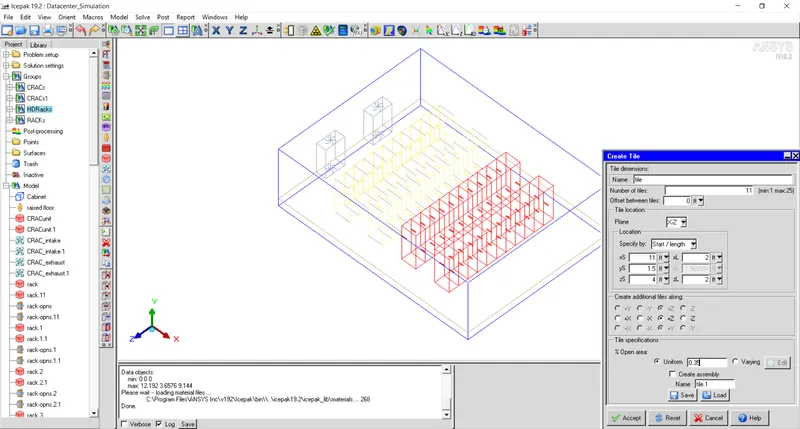
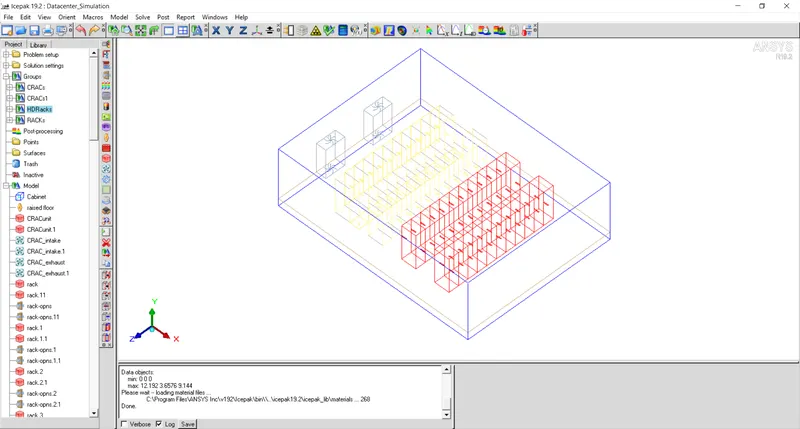
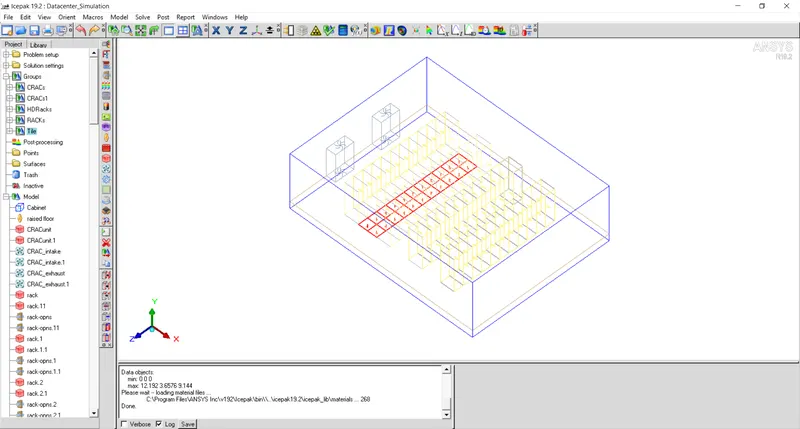
- Create a row of `11` tiles near the first row of racks with dimensions `2ft times 2ft` and specify % Open area as `0.35`.
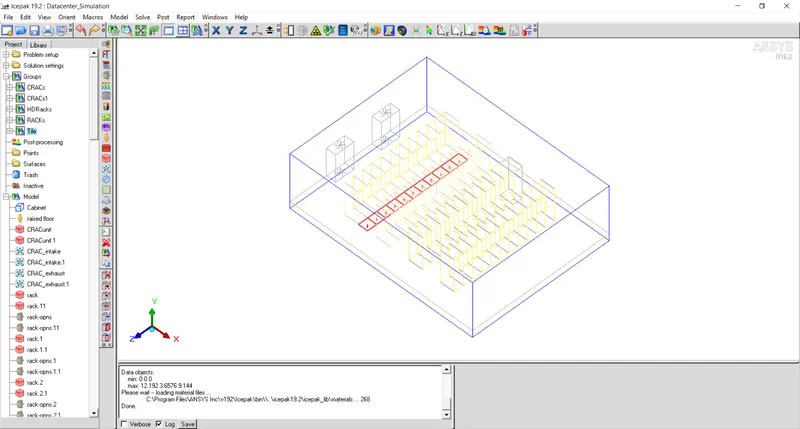
- Create a group from all the tiles and name it as 'Tile'.
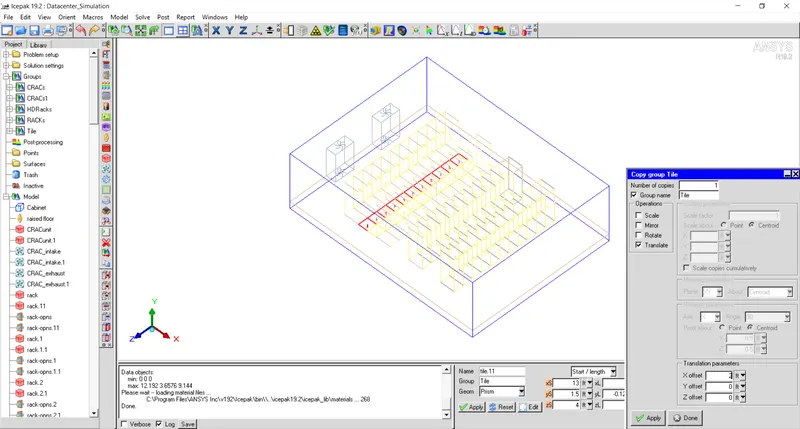
Create a copy of the tiles row in +X direction at a distance of `2ft` and include the tiles in the same group.
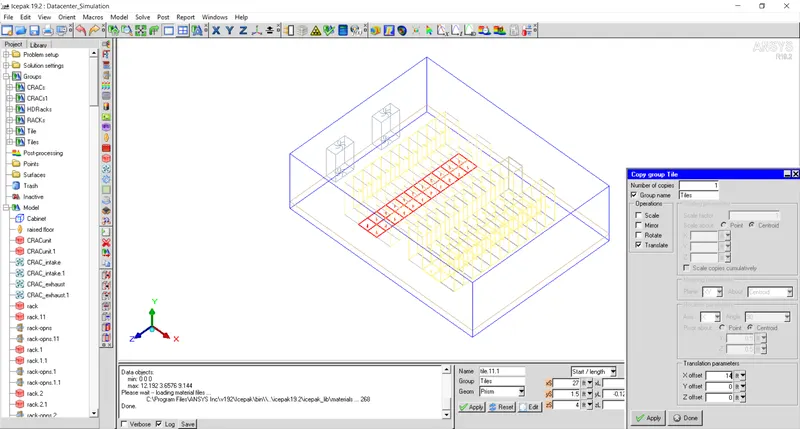
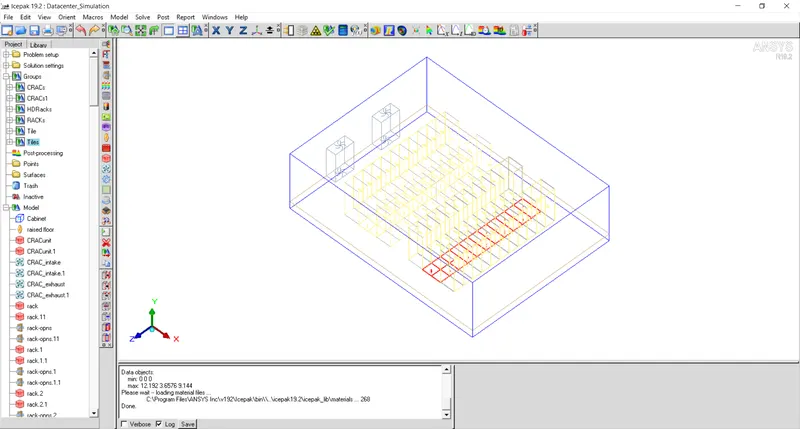
- Create a copy of both rows of the tiles in +X direction at a distance of `14ft`and include all the tiles in the same group 'Tile'.
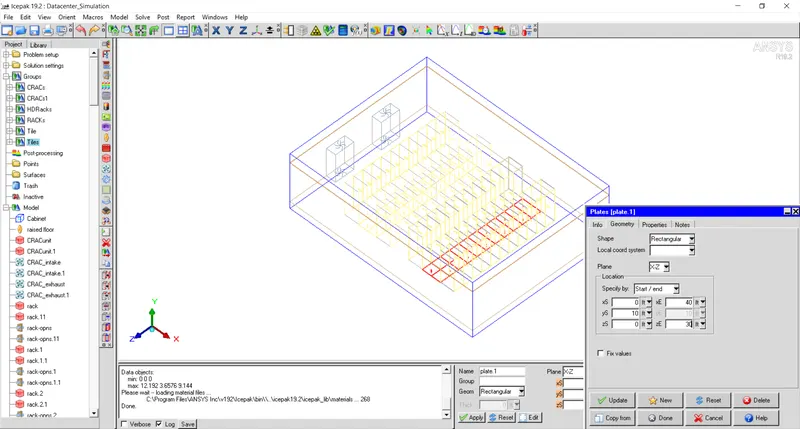
- Create a ceiling using a plate.
- Create a return grill on the ceiling.
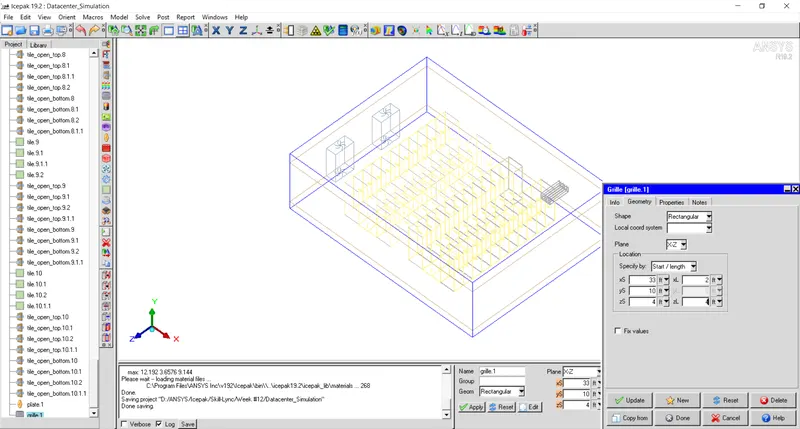
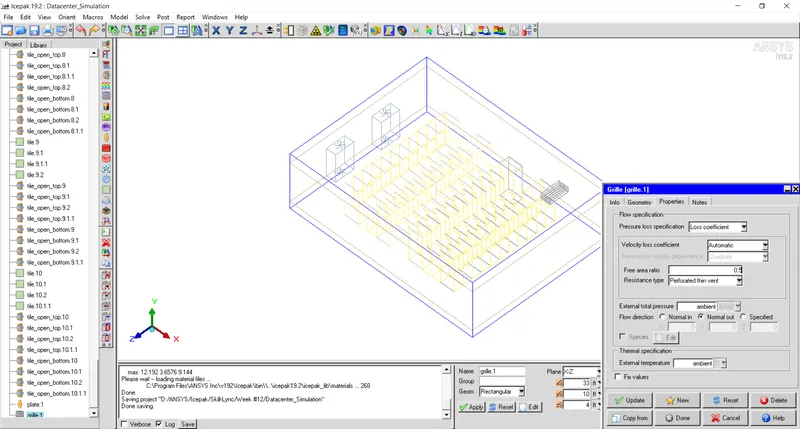
- Create two copies of the same grille in +Z direction with the distance of `9ft` between them.
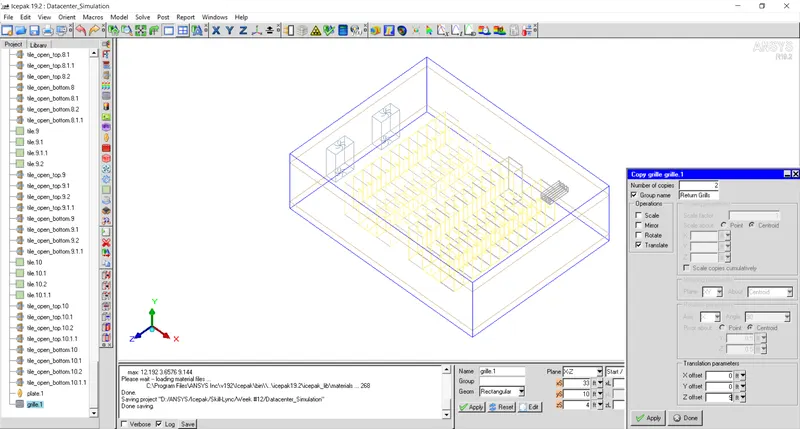
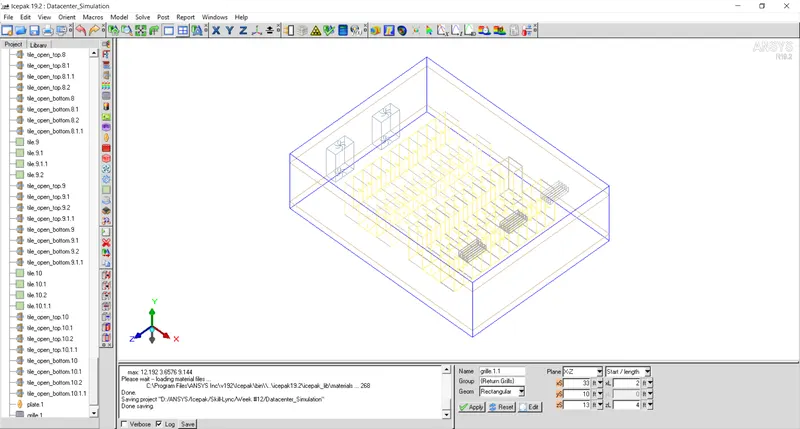
Create a group from all the three grills and name it as 'Grills'.
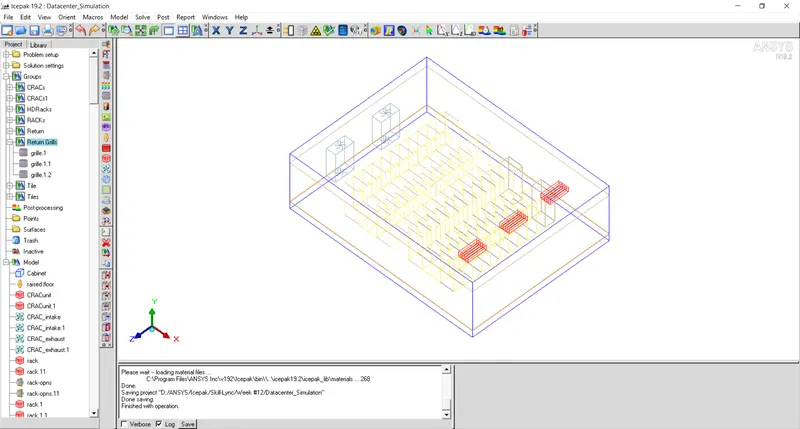
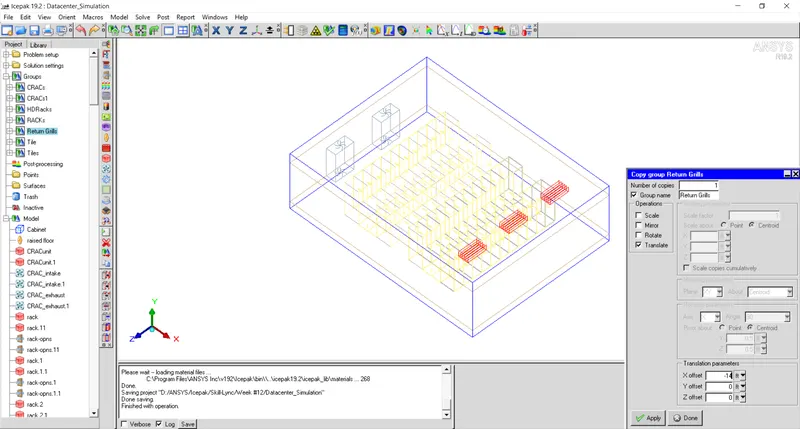
- Create a copy of the group 'Grills' in the -X direction at a distance of `14ft` and specify same group name as 'Grills'.
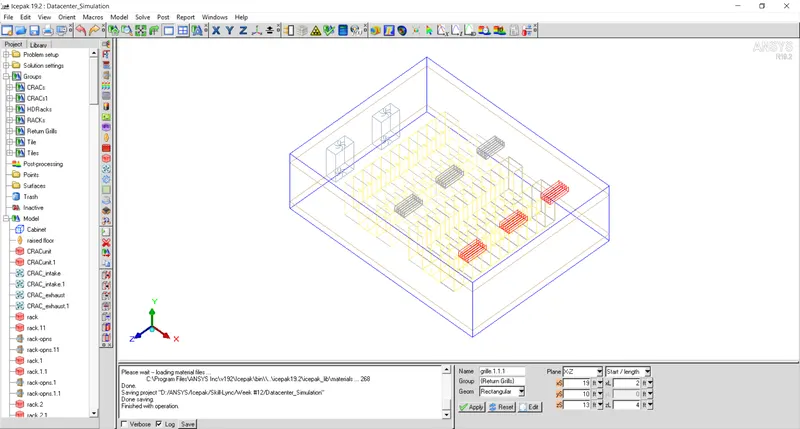
- Create a grille near to the CRAC.
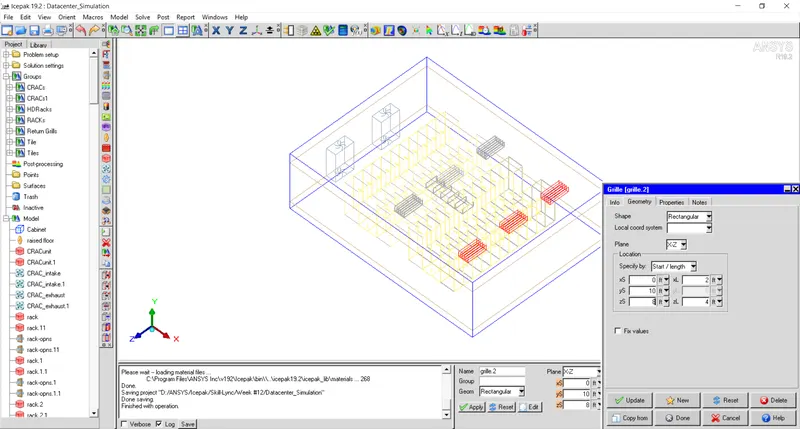
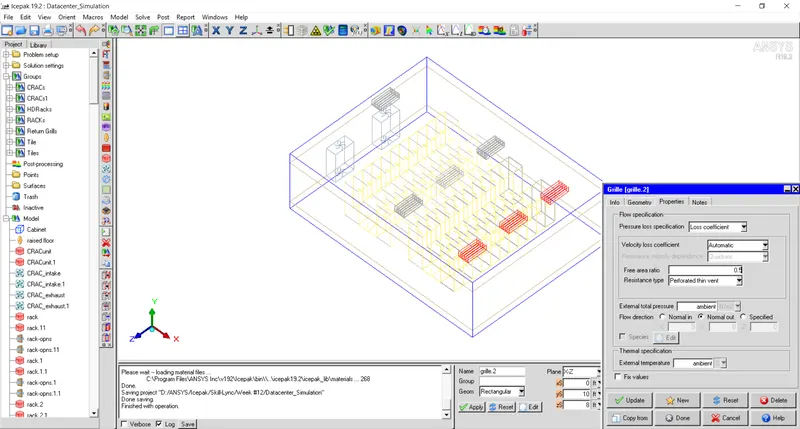
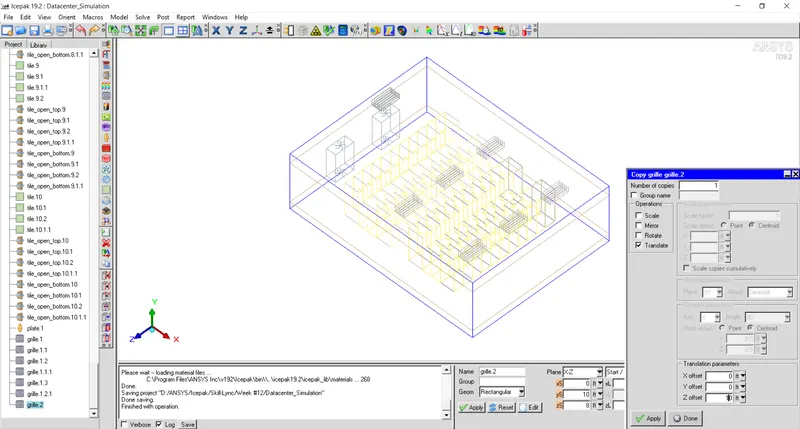
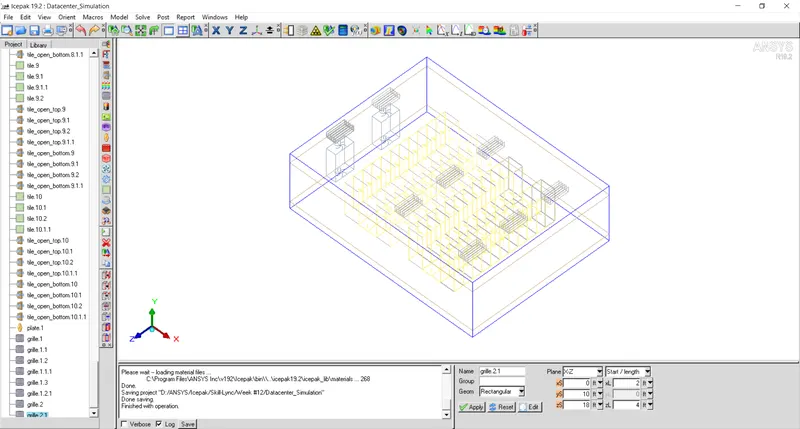
- Create a copy of the grille in +Z direction at a distance of `10ft`.
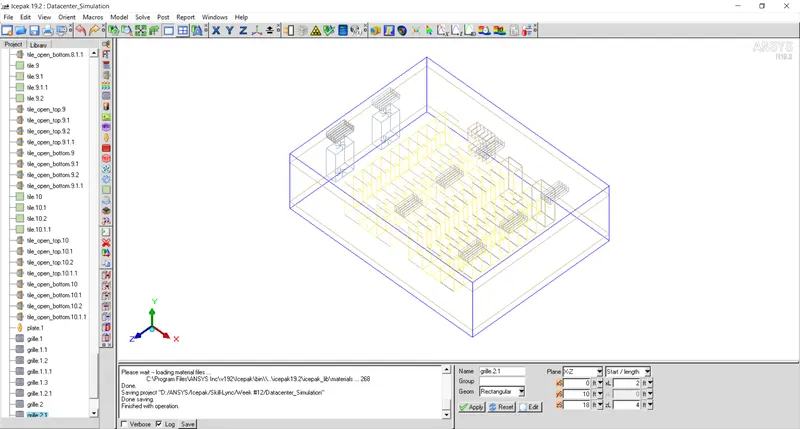
- Create a PDU using Macros > Geometry > Datacenter components > PDU.
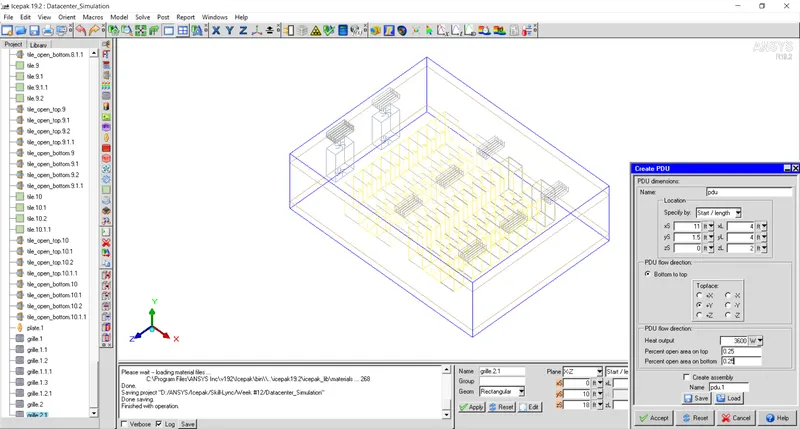
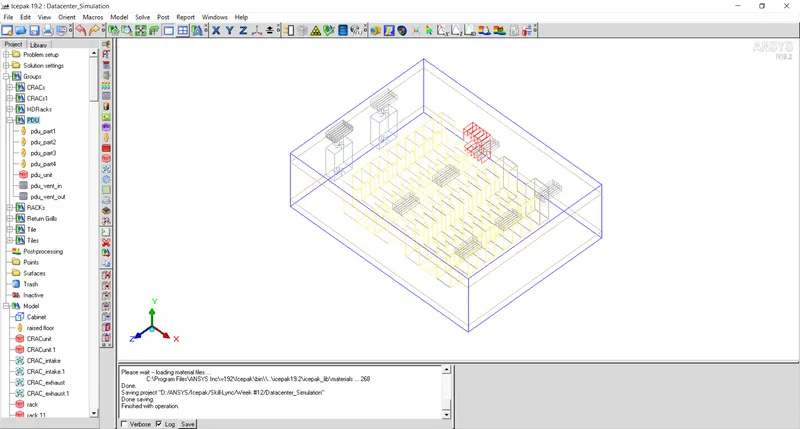
Create a group from all the components of PDU and name it as 'PDU'.
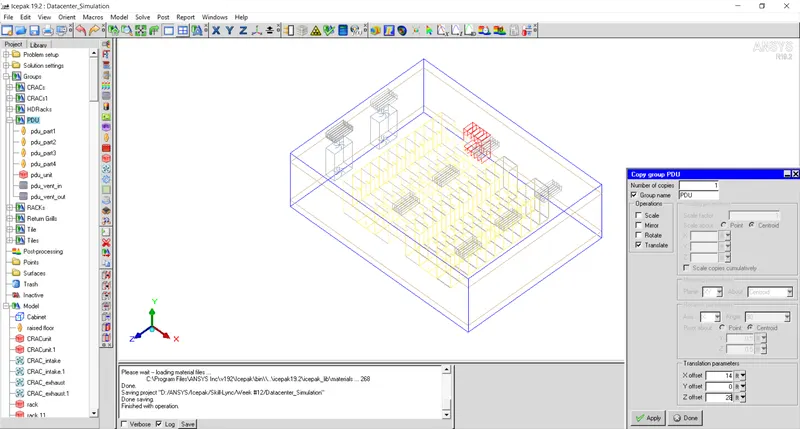
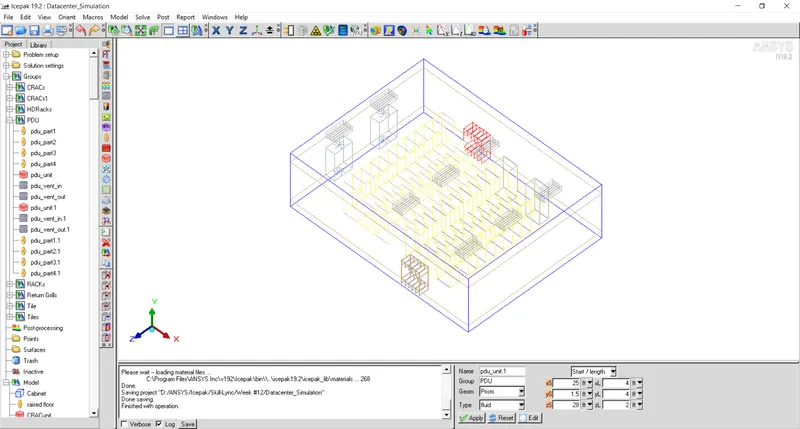
Create a copy of the same PDU and include in the same group 'PDU'.
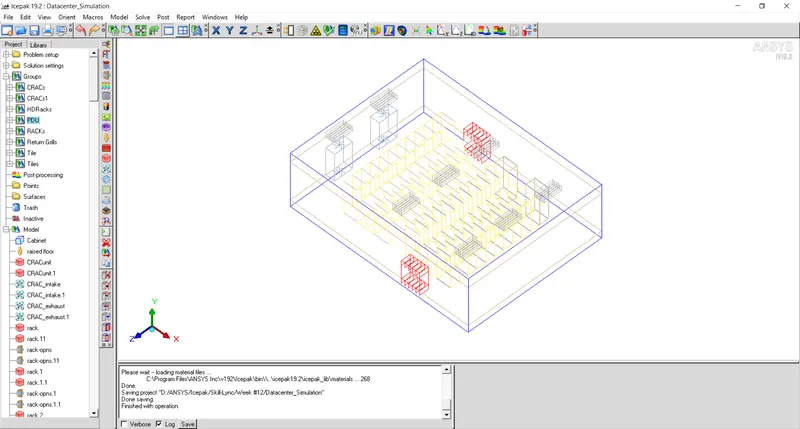
- Create a pipe below CRAC units.
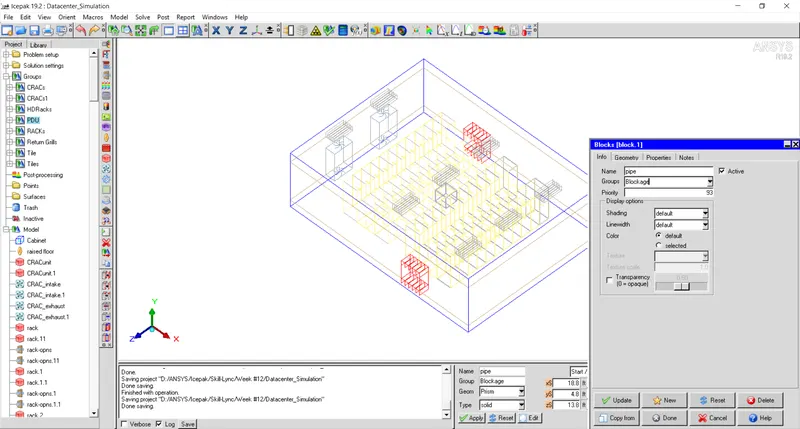
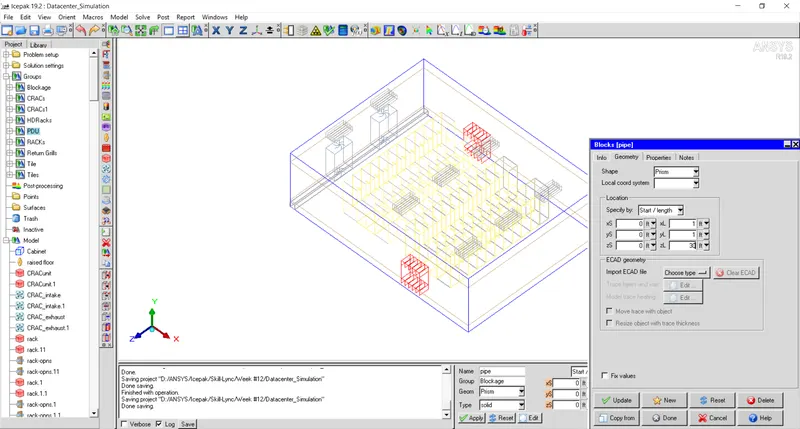
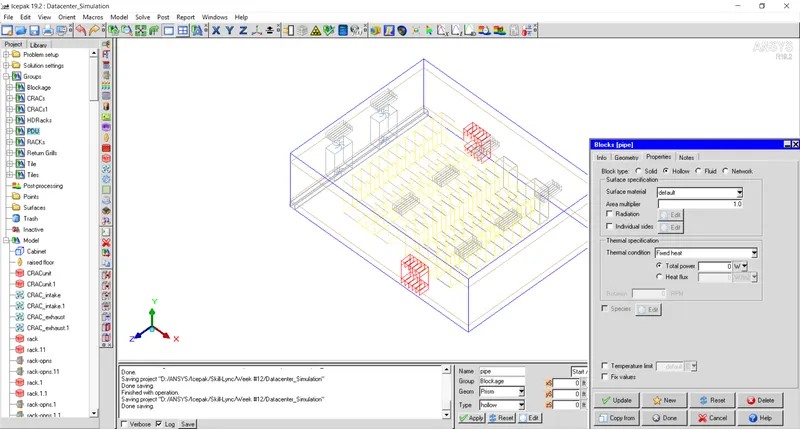
-
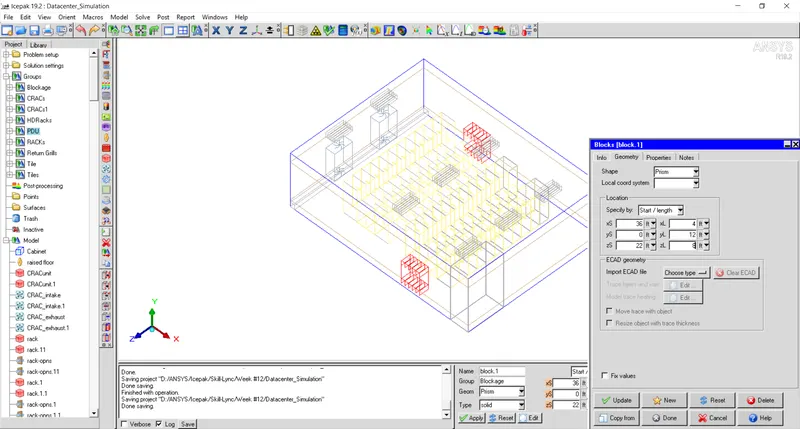
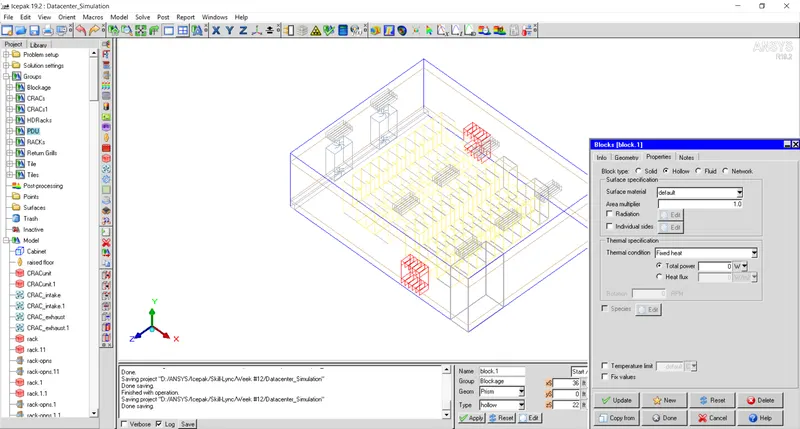
- Create a hollow space using prism block.
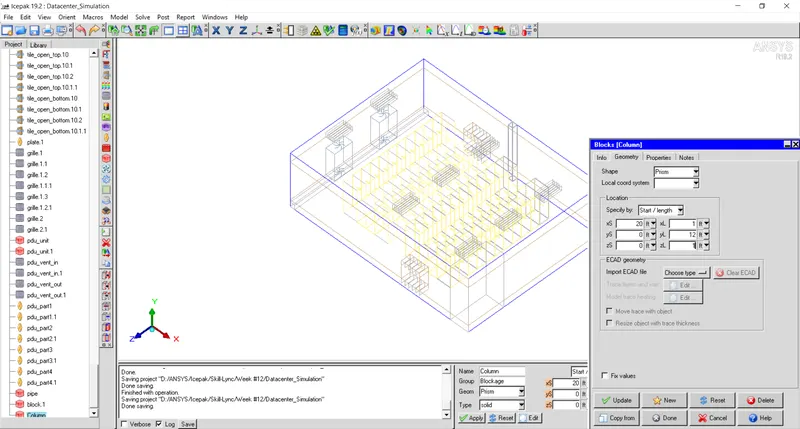
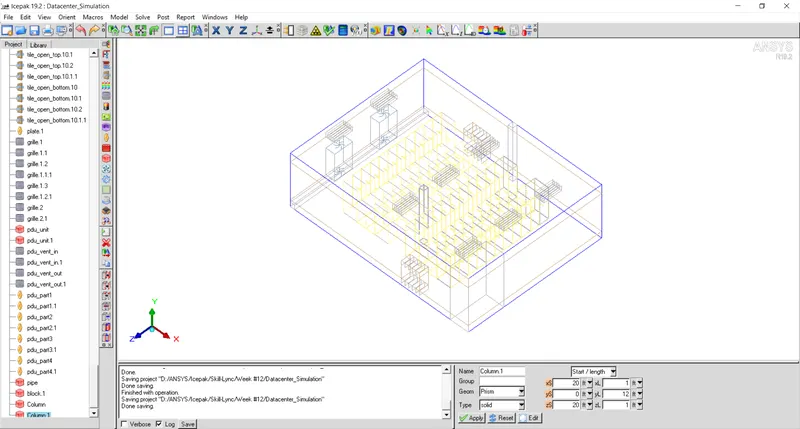
- Create colums using solid prism block.
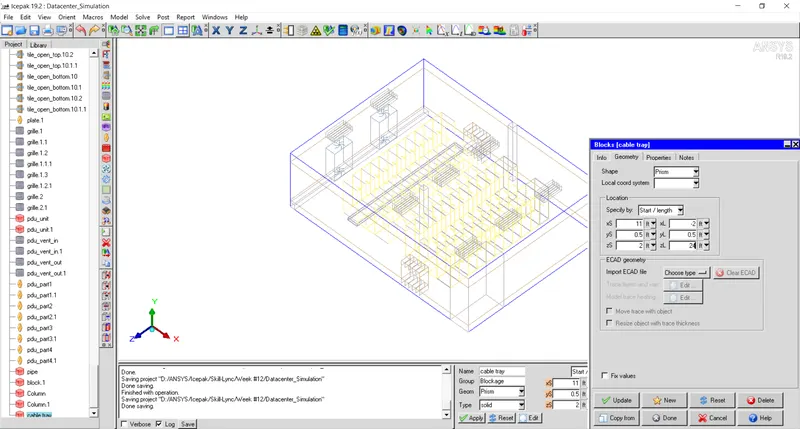
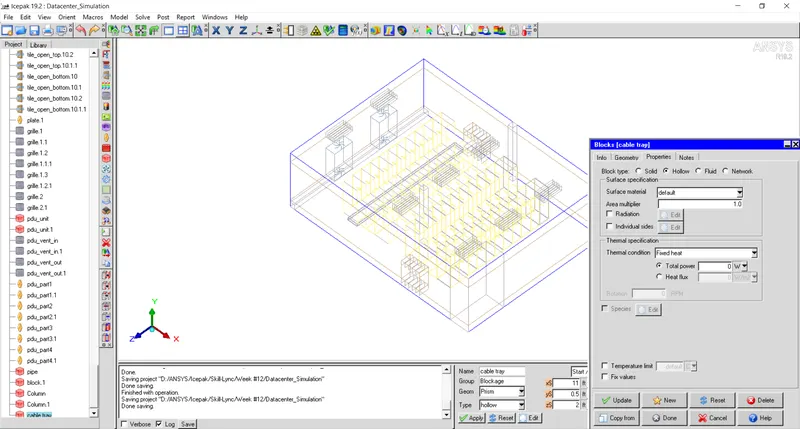
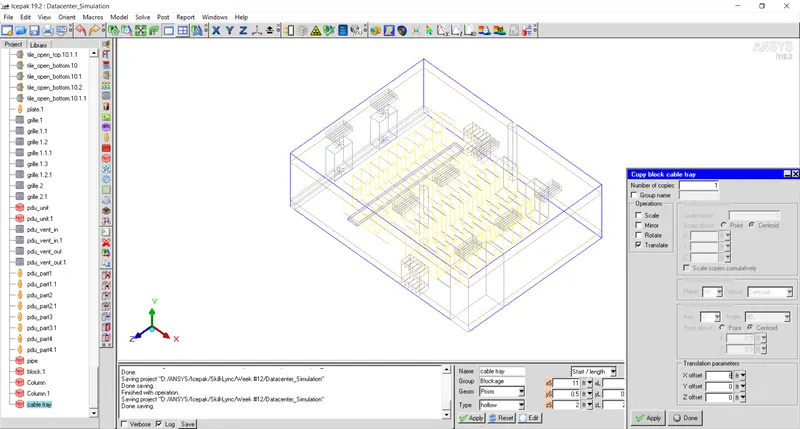
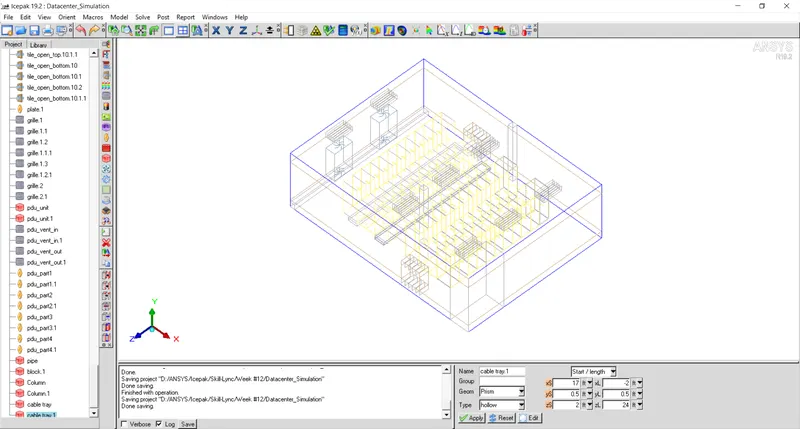
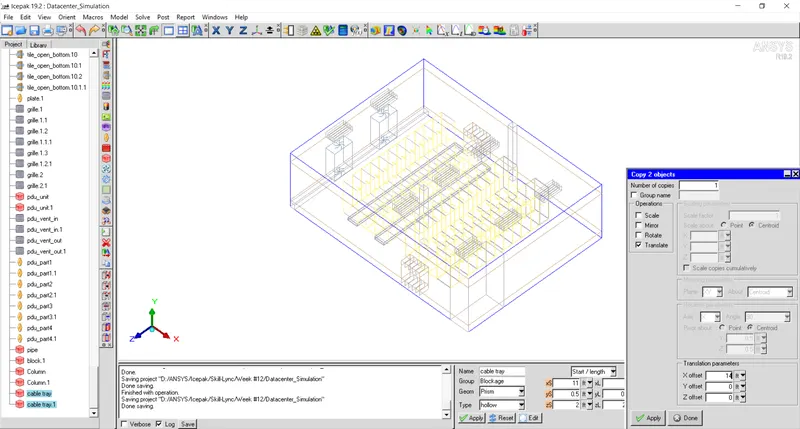
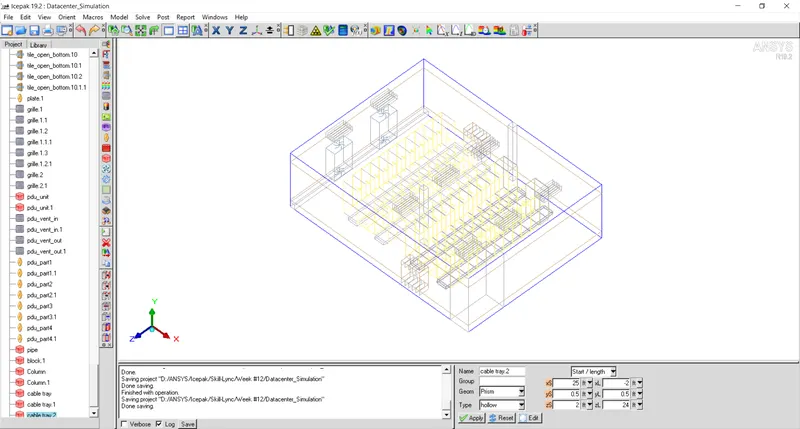
- Create cable trays below each rack row.
> Step - 2 : Meshing
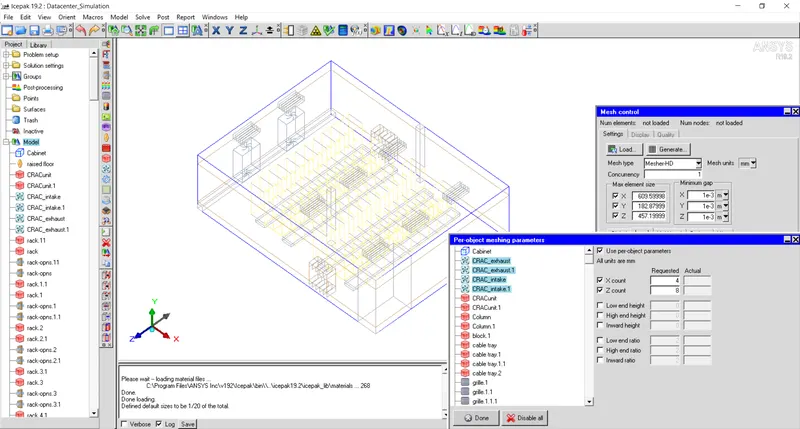
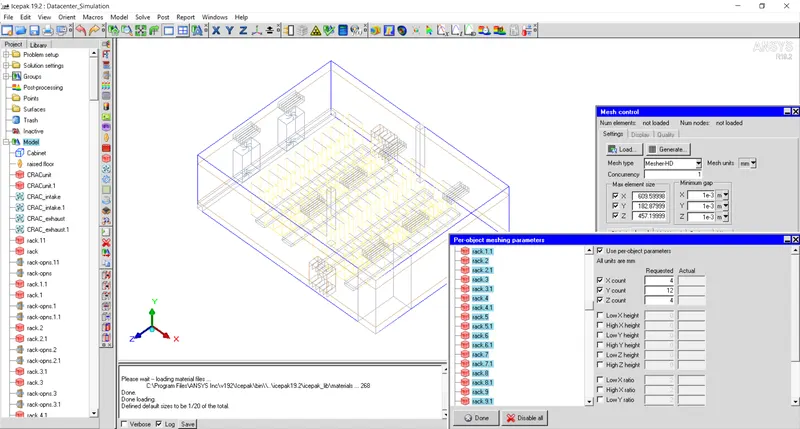
Perform local mesh refinement using mesh count in all the direction to get accurate results and better mesh quality. Local mesh refinement is done by following below steps:
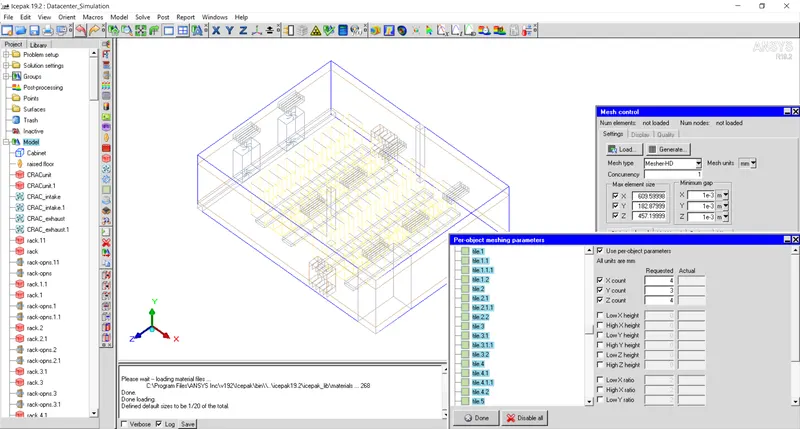
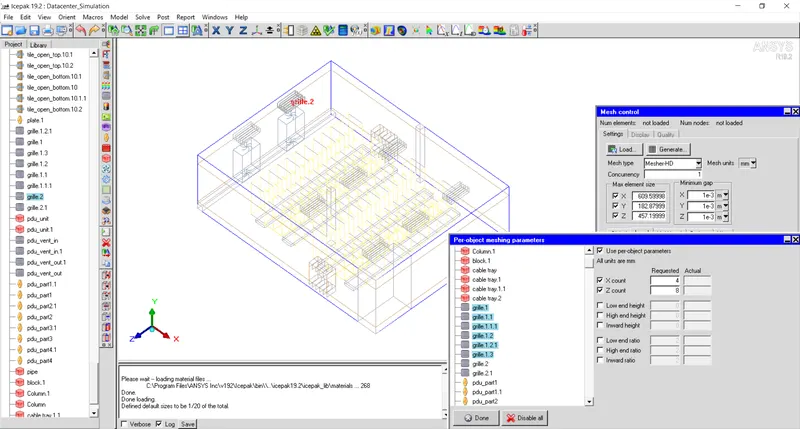
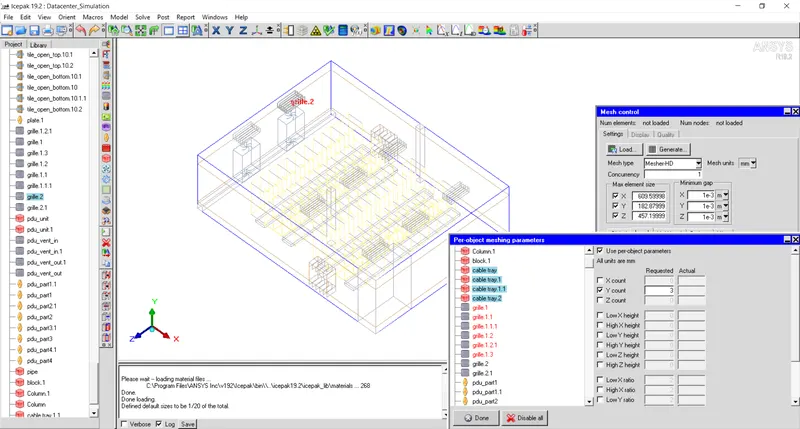
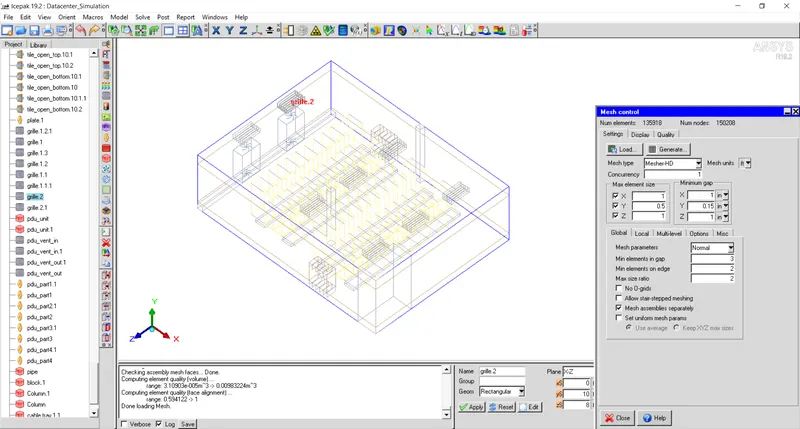
After specifying above parameters, generated mesh is shown below:
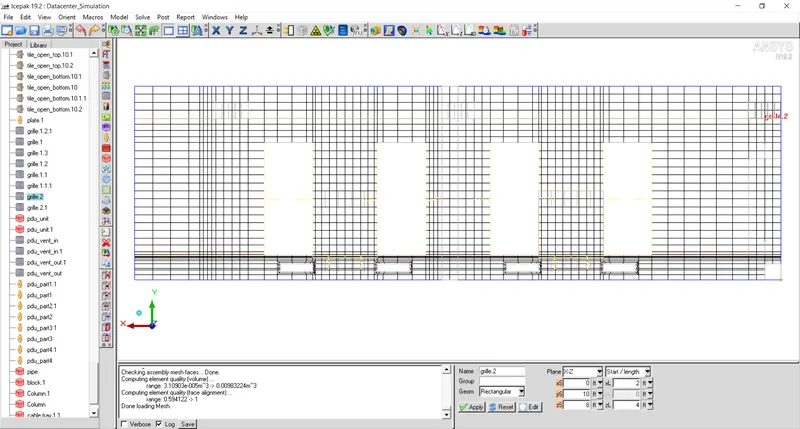
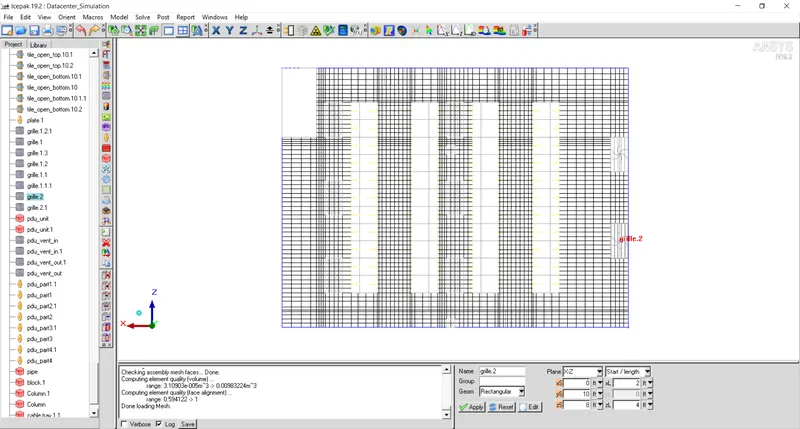
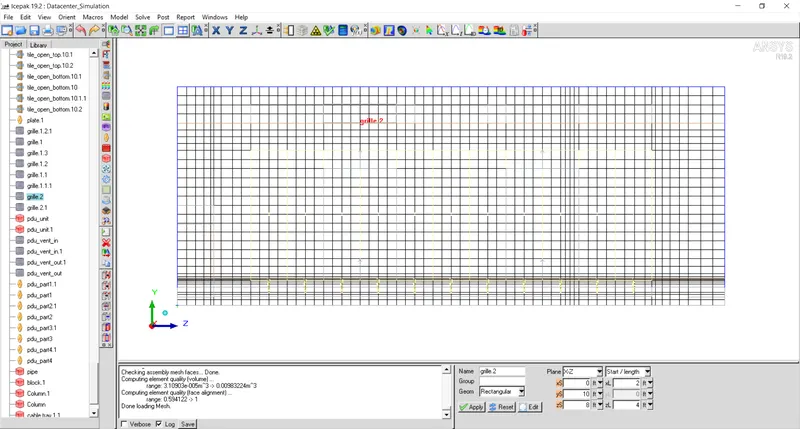
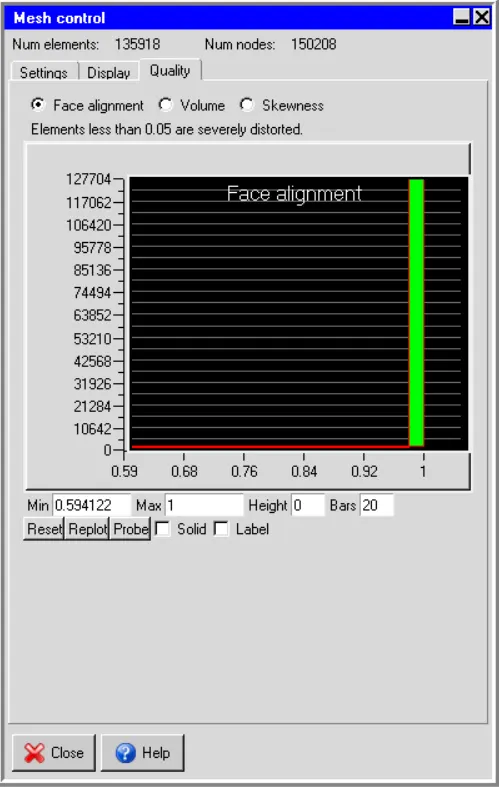
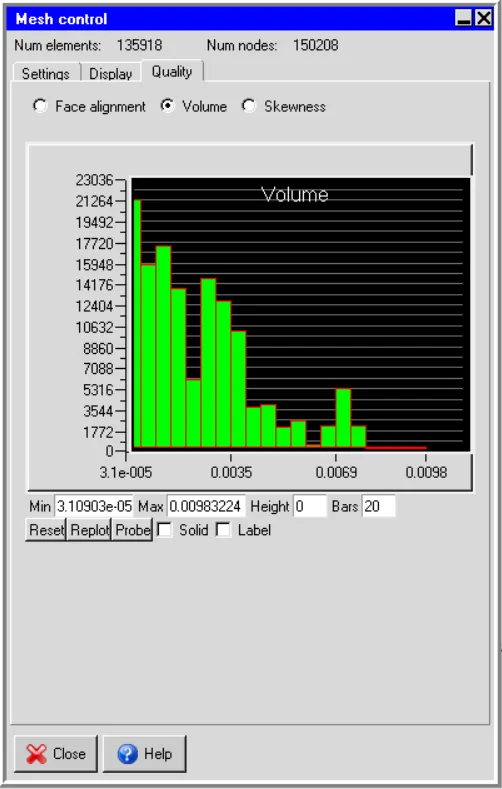
Mesh quality is shown in the graphs below:
a. Face alignment:
b. Volume:
c. Skewness:
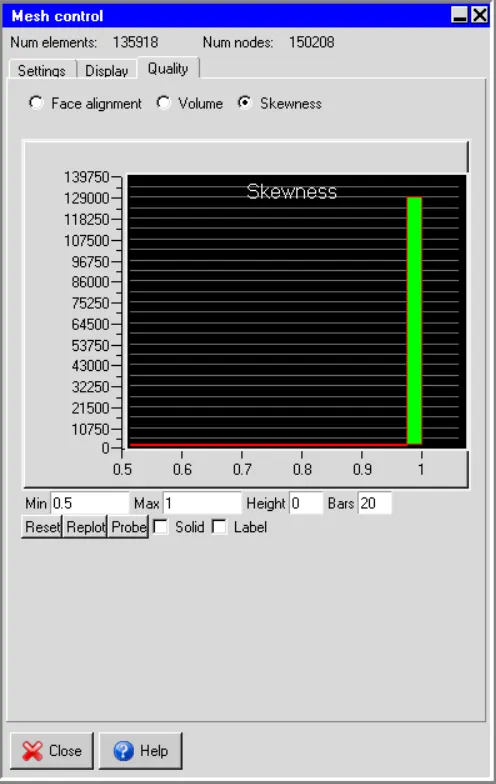
Total number of elements: 135918
> Step - 3 : Solver
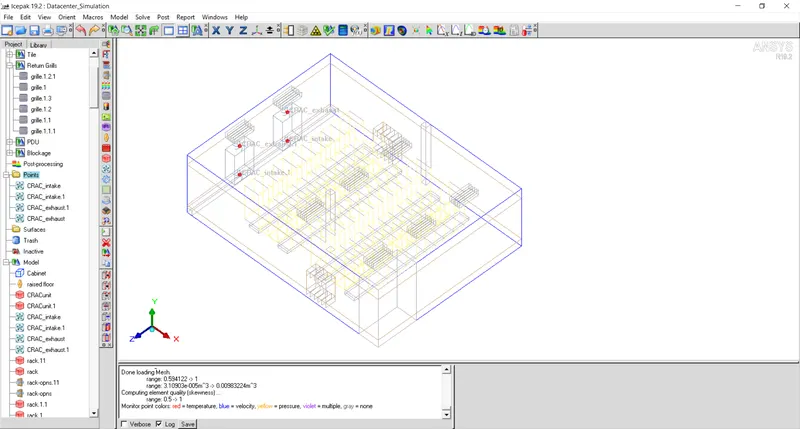
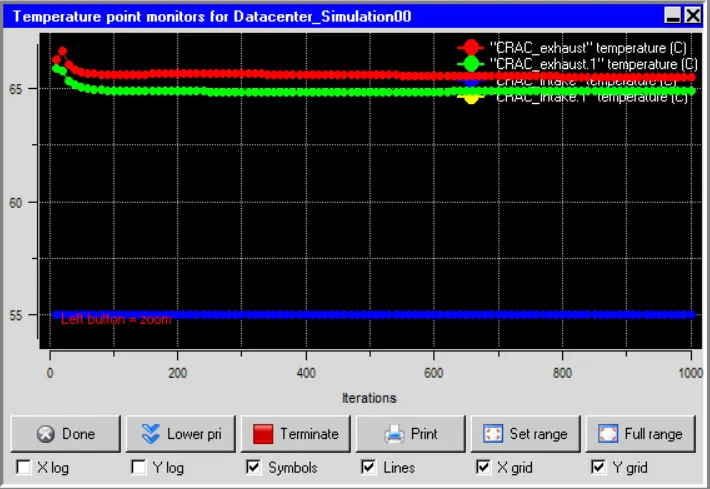
To monitor temperature variation, four monitor points are created at the inlet and outlet of the CRAC units.
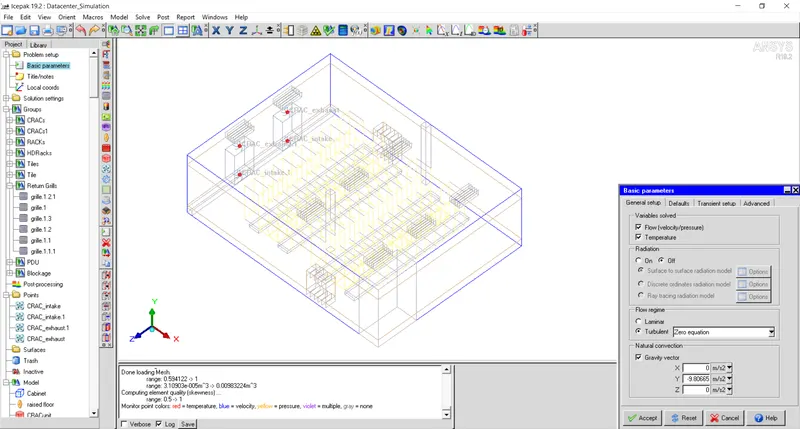
Basic parameter settings:
Radiation is turned off, zero equation turbulence is set with gravity of `9.81 frac{m}{s^2}` in -Y direction.
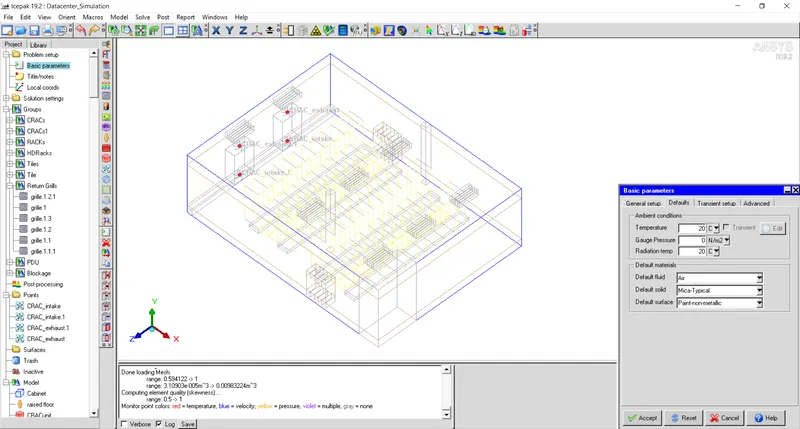
Set default solid as 'mica typical' and default surface as 'Paint non metallic'.
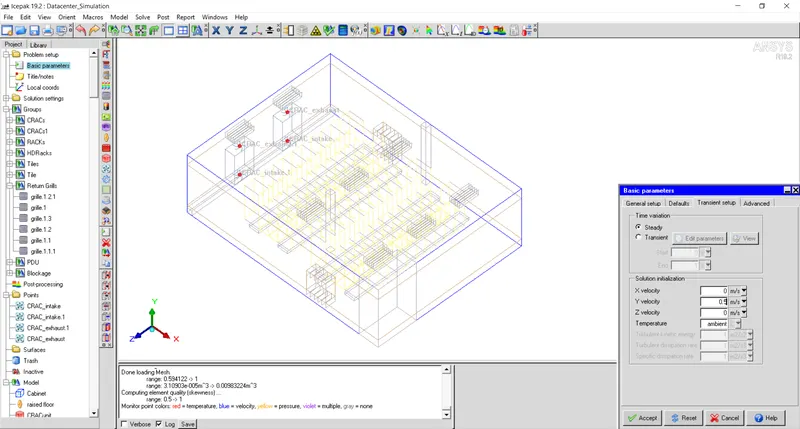
Set steady state simulation with initial velocity of `5frac{m}{s}` in Y direction.
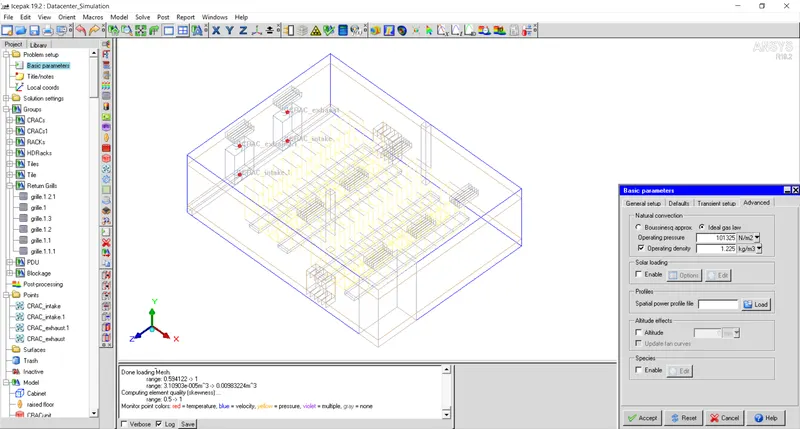
Set 'ideal gas law' for natural convection with operating density of `1.225frac{kg}{m^3}`.
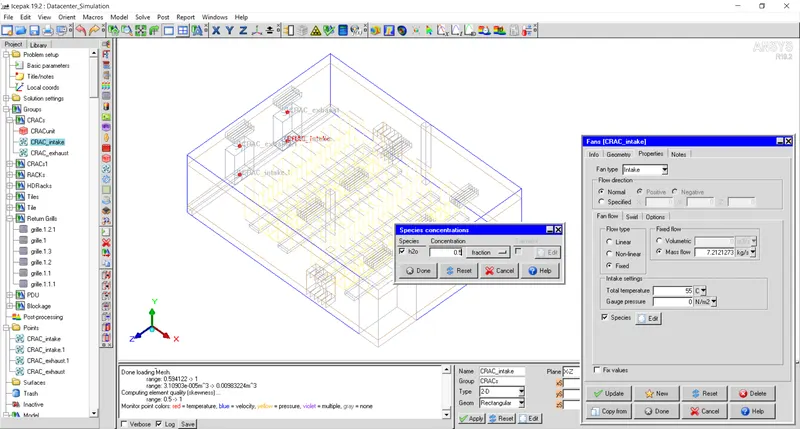
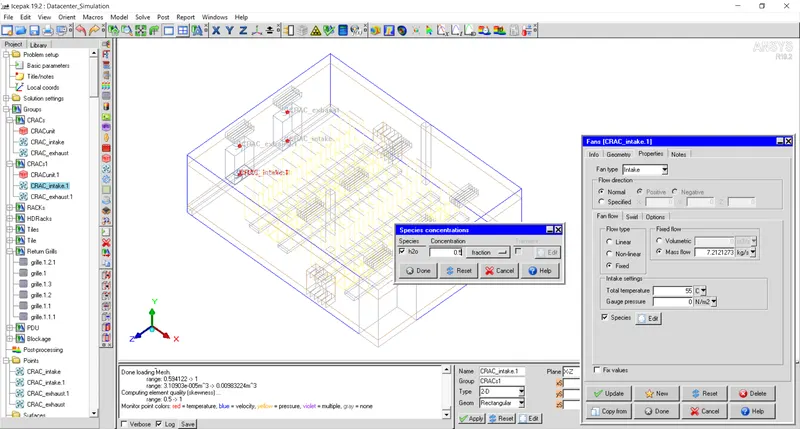
Set species concentration for `H_2O` at the inlet of both CRAC units as 0.5.
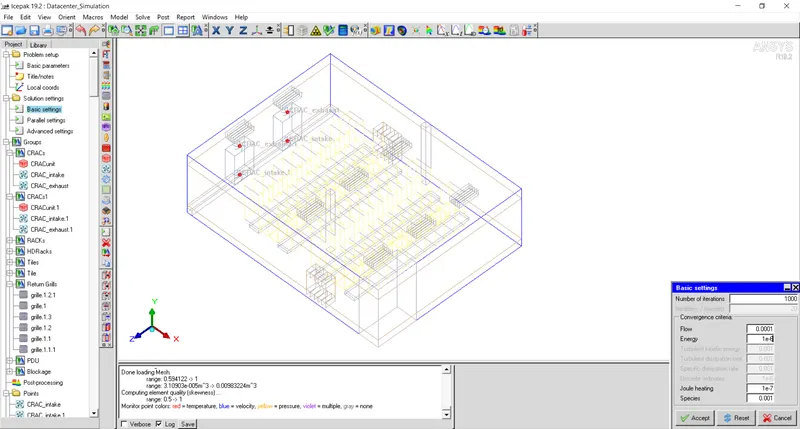
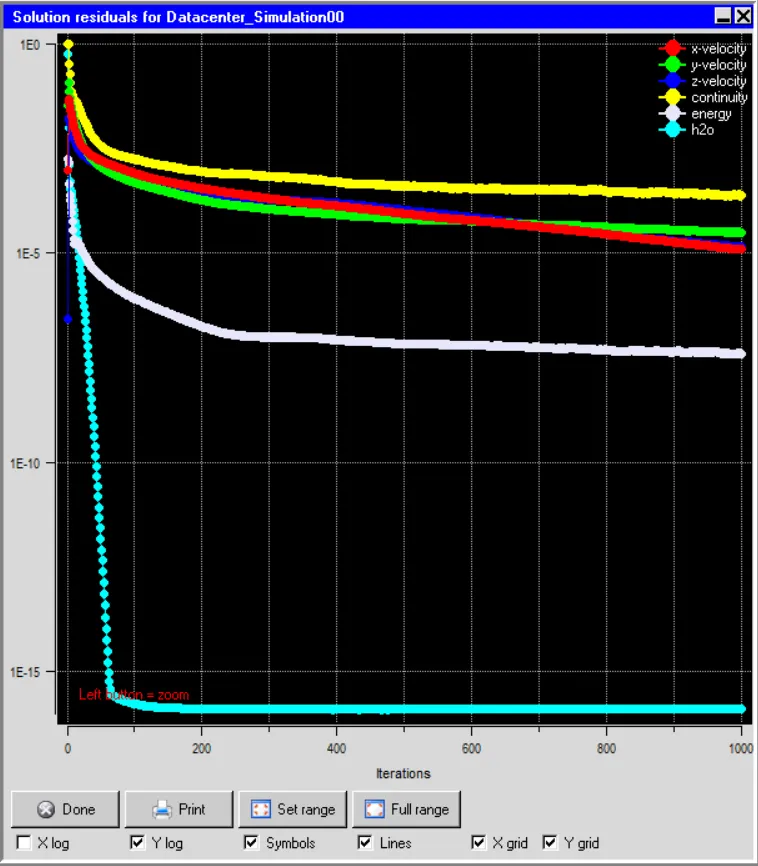
Set number of iterations as 1000 with convergence criteria as shown below:
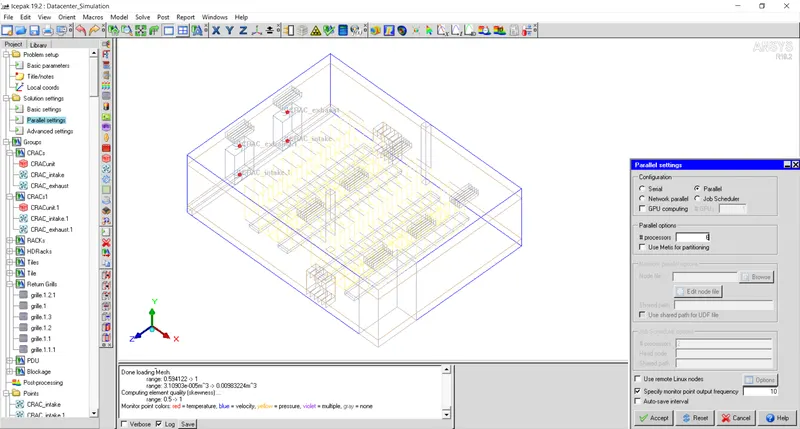
Under parallel processing, set the maximum processor as per the system to speed up the simulation.
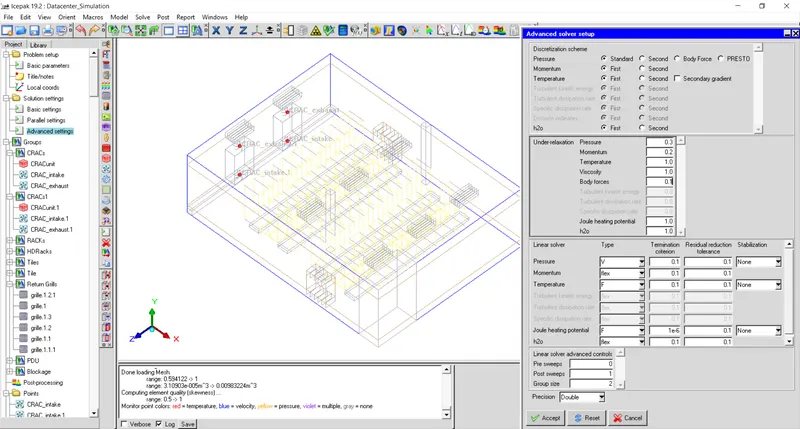
Under Advanced solver settings, set the parameters as shown below:
After 1000 iterations, the solution has almost reached a steady state condition that can be observed from the below graphs:
> Step - 4 : Results and Discussion
Temperature contours:
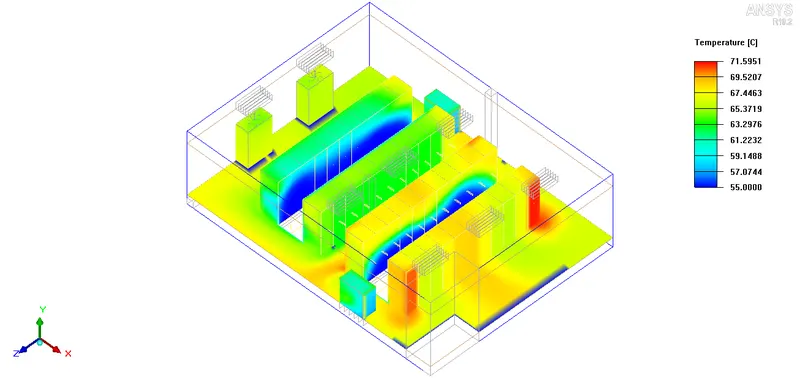
From below figure, it can be seen that the air that comes from the tiles is having lower temperature that directly comes in contact with front face of the rack. Because of this, front face is having relatively lower temperature as compared to the back side. As the air takes heat, its temperature increases and heat carrying capacity decreases hence back side is having higher temperature. Maximum temperature of `71.59^oC` is observed at the back side of the high density rack as it produces more heat`
Vector plot:
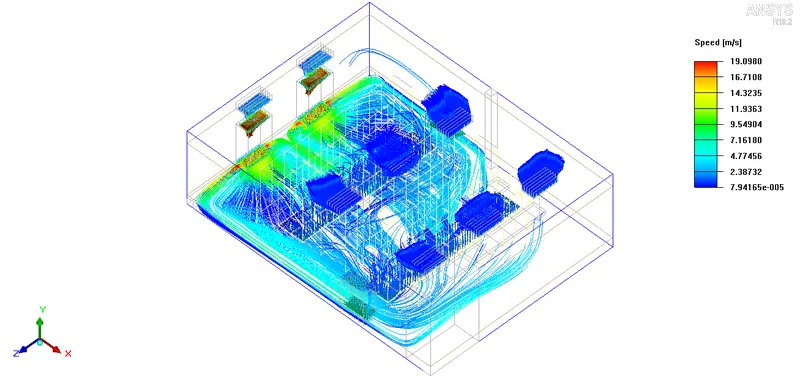
Vector plot for datacenter is shown in figure below. From vector plot it can be seen that maximum velocity is observed near the inlet and exit of CRAC units. Maximum velocity of `19frac{m}{s}` is observed in the domain.
Iso-surfaces:
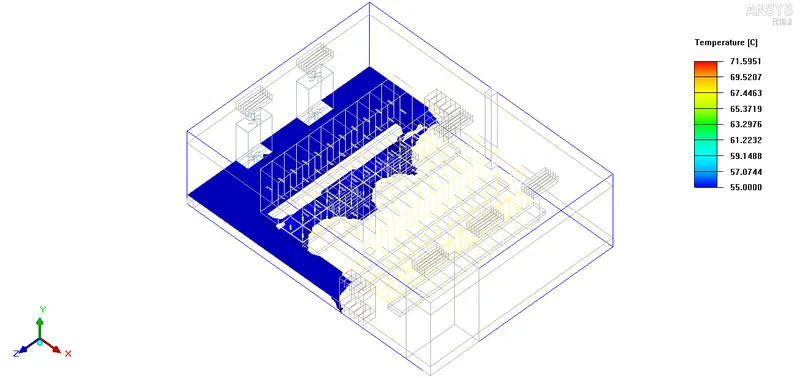
Isosurface with temperature of `70^o C` is plotted to detect location with maximum temperature in the datacenter. From figure it can be seen that maximum temperature is observed at the back side of the high density end racks.
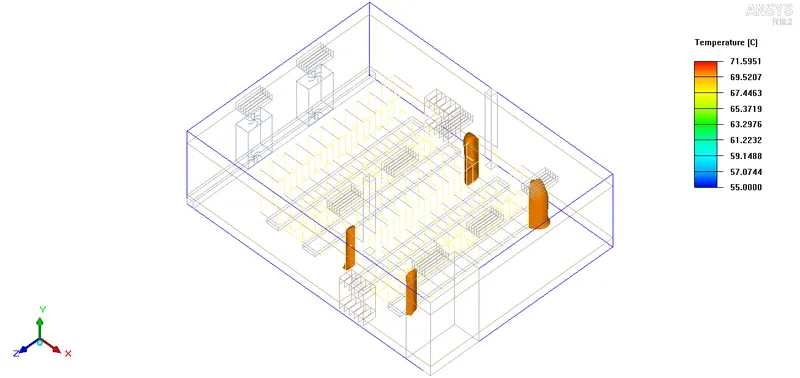
Also, Isosurface with temperature of `55 ^oC`is shown in figure below. Minimum temperature is observed at the plenum under the floor near the exit of the CRAC units.