Week 7 - Auto ignition using Cantera
Assignment no.07
Assignment name-auto ignition using cantera
Auto ignition -auto ignition is the spontaneous ignition of a fuel and air mixture without any external source of ignition. The lowest temperature at which it spontaneously ignites is called auto ignition temperature. The time of auto ignition (ignition delay) is very important for combustion application such as in IC engines design
The auto ignition time is calculating as
〖Time〗_(ignition delay)=〖Time〗_(intial temperture)+400 kPART I
Use the same reactor network code as shown in the video to simulate the Auto Ignition Time for Methane under the following conditions, (simulation time = 10 secs)
- Plot the variation of Auto Ignition time of Methane with a constant temperature of 1250K and pressure varying from 1 to 5 atm.
- Plot the variation of Auto Ignition time of Methane with a constant pressure of 5 atm and temperature varying from 950K to 1450K.
PART II
Further, observe and print the rate of change of molar concentrations of the given elements "H2O, O2, OH" with respect to the time, (simulation time = 10 secs)
Explain the behavior of the graph for 2 cases,
- When Temperature is 1000K and pressure 5 bar
- When Temperature is 500K and pressure 5 bar
Coding approach
- Gas object is created from solution class and use gas.TPX and give the input of temperature, pressure and moles are set
- Then created reactor object r and use IdealGasReactor
- Again used ReactorNet for creating reactor network
- Used solution array instead of separated array
- Used advanced command is used to advance the reaction with time
part 1
code 1
"""
auto ignition assignment

skill lync-cantera

author-siddhesh sakpal

Date-30/01/2022

"""

import cantera as ct
import matplotlib.pyplot as plt
import numpy as np

gas = ct.Solution("gri30.cti")

Ts = 1250
#P = 5 *101325

auto_ignition_time=[]
pressure_final=[]
Pb=0
for Ps in range (101325,601325,100000):

	gas.TPX=Ts,Ps,{"CH4":1,"O2":2,"N2":7.52}

	r=ct.IdealGasReactor(gas)

	sim=ct.ReactorNet([r])

	time=0.0

	Pb=Pb+1

	states=ct.SolutionArray(gas,extra=['tim'])

	for n in range(10000):
		time +=1e-3
		sim.advance(time)
		states.append(r.thermo.state,tim=time)
		if(states.T[n]<=Ts+400):
			t=(states.tim[n])
			pressure=(states.P[n])

	plt.figure(1)
	plt.plot(states.tim,states.T,label="Initial pressure=%d bar"%Pb)
	plt.title("temperture vs time")
	plt.xlabel("time(sec)")
	plt.ylabel("temperure(K)")
	plt.legend()
	auto_ignition_time.append(t)
	pressure_final.append(pressure)
pf=[1,2,3,4,5]
plt.figure(2)
plt.plot(pf,auto_ignition_time,"*",color='blue')
plt.plot(pf,auto_ignition_time)
plt.title("ignination dealy vs pressure")
plt.xlabel("pressure")
plt.ylabel("ignition dealy")
plt.show()
graphs
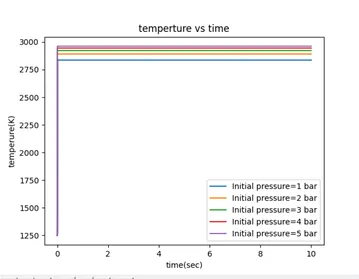
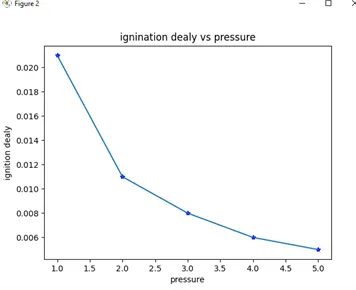
from the above graph we can conclude that increase in initial pressure the auto ignition time is getting reduced
hence we easily said that ignition dealy or auto ignition time is sensitive to both temperture and pressure.with increases in temperture and pressure the auto ignition time is decresed.
code 2
""
auto ignition assignment

skill lync-cantera

author-siddhesh sakpal

Date-29/01/2022

"""

import cantera as ct
import matplotlib.pyplot as plt
import numpy as np

gas = ct.Solution("gri30.cti")

#T = 950 to 1550
P = 5 *101325

auto_ignition_time=[]
temp_final=[]

for Ts in range (950,1550,100):

	gas.TPX=Ts,P,{"CH4":1,"O2":2,"N2":7.52}

	r=ct.IdealGasReactor(gas)

	sim=ct.ReactorNet([r])

	time=0.0

	states=ct.SolutionArray(gas,extra=['tim'])

	for n in range(10000):
		time +=1e-3
		sim.advance(time)
		states.append(r.thermo.state,tim=time)
		if(states.T[n]<=Ts+400):
			t=(states.tim[n])
			temp=(states.T[n])

	plt.figure(1)
	plt.plot(states.tim,states.T,label="Initial temperature=%s K"%Ts)
	plt.title("temperture vs time")
	plt.xlabel("time(sec)")
	plt.ylabel("temperure(K)")
	plt.legend()
	auto_ignition_time.append(t)
	temp_final.append(temp)
plt.figure(2)
plt.plot(temp_final,auto_ignition_time,"*",color='blue')
plt.plot(temp_final,auto_ignition_time)
plt.title("ignition dealy vs time")
plt.xlabel("temperture")
plt.ylabel("auto_ignition_time")
plt.show()
graphs
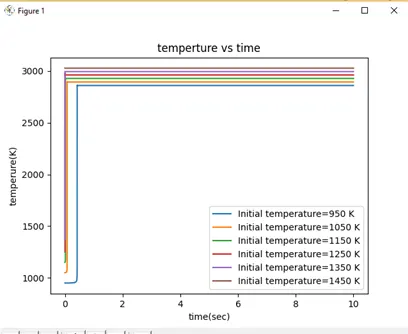
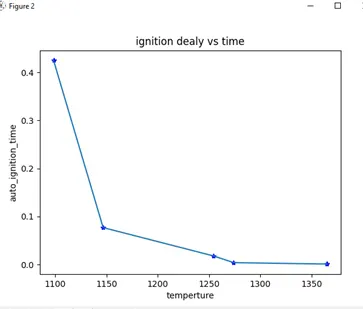
from the above graph we can conclude that increase in initial temperture the auto ignition time is getting reduced
hence we easily said that ignition dealy or auto ignition time is sensitive to both temperture and pressure.with increases in temperture and pressure the auto ignition time is decresed.
part 2
code 3
import cantera as ct
import matplotlib.pyplot as plt
import numpy as np

gas=ct.Solution("gri30.cti")
T=1000
P=5*101325
gas.TPX=T,P,{"CH4":1,"O2":2,"N2":7.52}
r=ct.IdealGasReactor(gas)
sim=ct.ReactorNet([r])
time=0.0
states=ct.SolutionArray(gas,extra=['tim'])
for n in range(10000):
	time +=1e-3
	sim.advance(time)
	states.append(r.thermo.state,tim=time)

plt.subplot(3,1,1)
plt.plot(states.tim,states.X[:,gas.species_index("H2O")])
plt.ylabel("H2O mole fraction")
plt.xlabel("time in sec")


plt.subplot(3,1,2)
plt.plot(states.tim,states.X[:,gas.species_index("O2")])
plt.ylabel("O2 mole fraction")
plt.xlabel("time in sec")

plt.subplot(3,1,3)
plt.plot(states.tim,states.X[:,gas.species_index("OH")])
plt.ylabel("OH mole fraction")
plt.xlabel("time in sec")
plt.show()
graphs
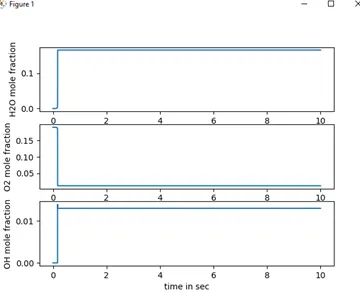
temperature=1000k and pressure=5 bar
temperature=500k and pressure=5 bar
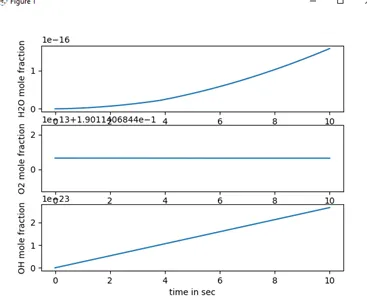
the above both graphs of part 2 code shows molar concentration of H2O,OH,O2 with intial temperture for case 1 1000k and case 2 500 k and initial pressure equal to 5 bar
In case 1 we can see concentartion of H2O,OH increases which suggest the this species is formed during the combustion and concentration of O2 is decresed means O2 has to be consumed during combustion
In case 2 auto ignition of methane is around 900 k so auto ignition is does not take place, we can see concentartion of H2O,OH increases which suggest the this species is formed during the combustion due to intermediate reaction is taking place at the given condition and concentration of O2 shows there is no any change with respect to time that means there is no ignition take place.