Fuel cell powered vehicle model
To Make a MATLAB model of fuel cell-powered electric vehicle and comment on results
Fuel cell-powered electric vehicle :
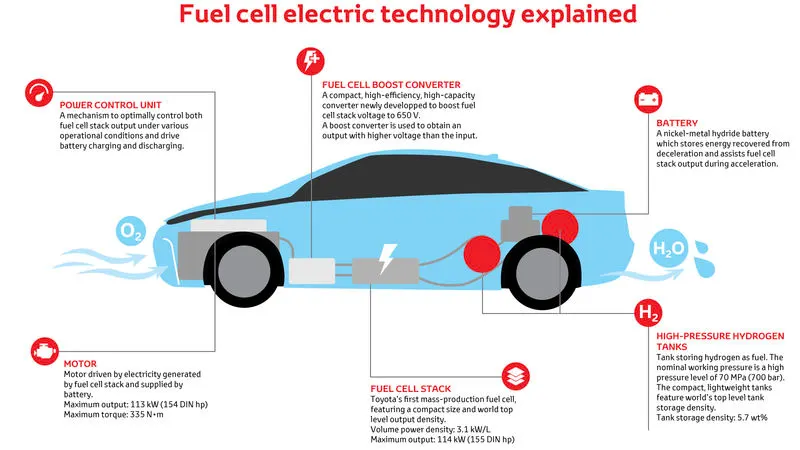
The common type of PEMFC is mostly used in the HEV. Fuel cell vehicles produce electricity using a fuel cell-powered by hydrogen, rather than drawing electricity from only a battery. The fuel cell stack in the fuel cell uses hydrogen from the tank and air from the radiator makes the electrochemical reaction and produces the electricity with water. Then produced electricity is supplied to the motor. Fuel cell vehicles are controlled by controlling the hydrogen flow rate.
MATLAB MODEL:
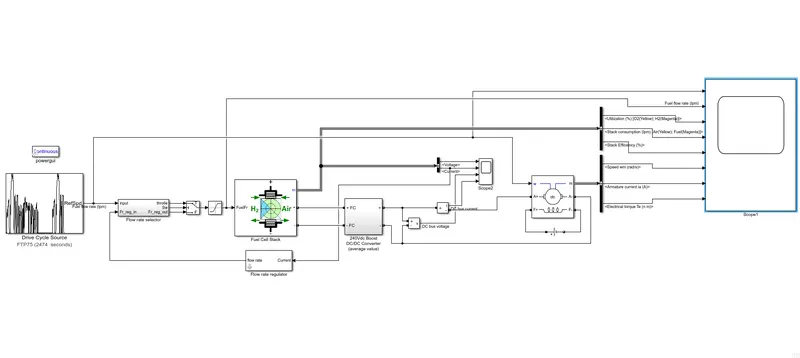
To Make a MATLAB model of fuel cell-powered electric vehicle, I have uses the existing Matlab model example (fuel cell stack)
https://drive.google.com/file/d/1WSRkyMLjcazIXLpdNFBiT9No_agW2DZD/view?usp=sharing
WORKING :
In this model, the FTP75 drive cycle is made as input for the motor speed and the fuel rate flow of hydrogen. The flow rate selector controls the rate of hydrogen input to the fuel cell and that is controlled by feedback current. Then it is connected by the saturator block that controls the max rate of fuel flow to the fuel cell. The fuel cell used here has a capacity of 6KW with 45V. The positives and negatives of the fuel cell are connected to the boost converter, this boosts the voltage to 240V needed for the motor to work.
The motor with a capacity of 5HP 240V has a max speed of 1750. The usable datas from the motor and fuel cell are taken to scope for further analysis.
The actual fuel cell vehicle will have both a battery and fuel cell but in my case, I have only used a fuel cell for simplicity.
RESULT :
RESULT ANALYSIS:
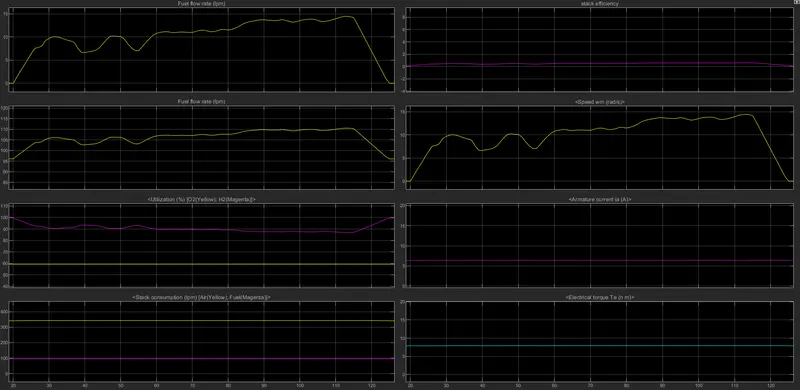
(All the results are analyzed for the time duration of 20-120s )
The first graph shows the fuel input given to the fuel cell.
The second graph shows the fuel rate flow, as the max rate of fuel can be 1000 so the fuel attains the max rate. The fuel increases as the fuel input, but the rate is 10 times(fuel input is 15 -fuel flow rate 150)
The third graph shows the utilization of H and O. Whatever the situation the oxygen is used at the same level. The hydrogen is highly utilized for a low rate but utilized very low when the fuel rate is high.
The fourth graph shows the air and fuel consumption ratio in the fuel cell. The air is consumed 3 times more than the hydrogen fuel.
The fifth graph shows the stack efficiency of the fuel cells. The efficiency is 1 for the time period, because of the low output provided by the fuel cell.
The sixth graph shows the speed of the motor. The motor followed the speed of the drive cycle.
The seventh graph shows the armature current of the motor. The armature current is 7A for all time, this means the max current supplied by the fuel stack is 7A.
The eighth graph shows the electrical torque of the motor(the product of magnetic flux and the armature current). Since the current is constant and flux is constant in separately excited DC motors the electrical torque is 8 for the time duration.