Week 6 - Data analysis
AIM :-
To write a script that does data analysis
OBJECTIVE :-
To ensure :
- Data visualizer
- Compatability check
- Basic performance calculation
THEORY :-
This code takes takes the information from a user specified CONVERGE format file. It also checks the file for the proper format i.e. compatibility. If the file isn't a CONVERGE output data formatting then the code will throw miscalculation statement "This isn't a legitimate CONVERGE computer file." Also, if the file format is correct but, there's no data present within the file then the code will prompt the user "No data present within the file"
If the format is correct and data is present then the code will implement following steps:
1) Data extraction - Extracting data together with the column name and column number from the CONVERGE computer file. Complete data from the file is stored in a very two dimensional array 'data' The columns of knowledge matrix/2D array contains the information for every individual parameter.
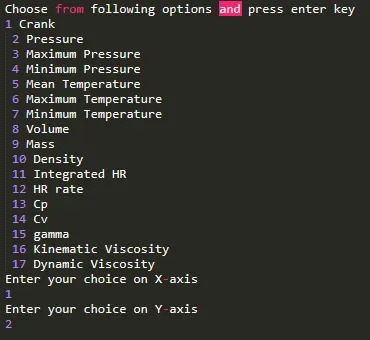
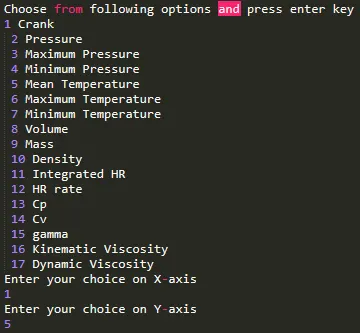
2) Data visualizer - Provide an "Input map" to user in order that he/she can use numbers as an input to designate the variables to be ploted. Ask user if plot between any two variables is required. If input is 'y' representing 'yes' then, raise the numbers representing the variables to be ploted (Refering input map). Ask the user if the plot is to be saved. Then, show the plot. Above step is under while loop and runs untill user gives an input 'n' to the question "Do you wish to plot the other variable? (y/n):
3) Basic performance - Extract volume and pressure data from matrix
'data' and store in array 'volume' and 'pressure' respectively. Next, numerically integrate pressure and volume data using 'simps' function (Function for numerical integration by Simphson's rule) from scipy.integrate library. This integration is area under the P-V curve i.e. work done per cycle. Then, RPM of the engine at which the information was collected and fuel consumption in microgram per cycle is taken as user input. Next, the ability produced by the engine at this RPM is calculated. Finally, the particular fuel consumption is calculated and Area under the curve, Power output and Specific fuel consumption are displayed.
The four types of data analysis are:
- Descriptive Analysis.
- Diagnostic Analysis.
- Predictive Analysis.
- Prescriptive Analysis.
The data file given consist of various parameters of an engine. We have to calculate the below parameters
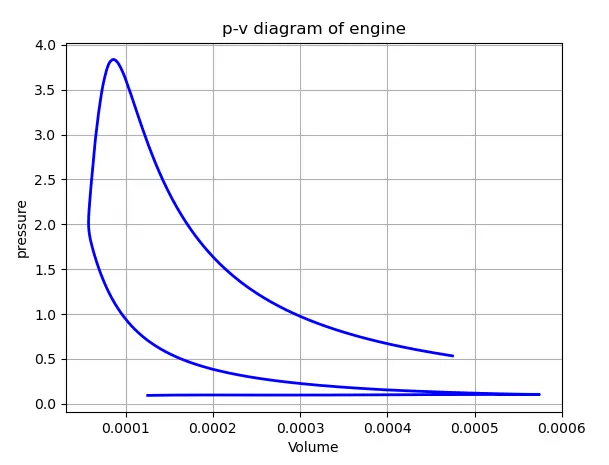
1. Work done by the engine is obtained by calculating the area under the P-V diagram
2. Power output of the engine is given as below
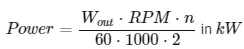
n - Number of cylinders of engine, RPM - engine speed in minutes,WOut - Work output by the engine
3. Specific Fuel Consumption(SFC)

SFC = mass of fuel consumption / Engine brake power = FC / Pb
PROCEDURE :-
1] Import the modules like Math, matplotlib, numpy,scipy for performing their respective functions
2] For the aim of plotting the curves between 2 quantities as per the user input, a line counter is initiated from 1. Now an "if" loop is iterated with the condition if # not in line all the numerical values present within the record is now to be stored within the data array as string.
Now another "if" loop is executed with the conditon that line counter greater than or adequate to 6 all the info are stored within the pressure and volume array respectively.
3] For Engine performance calculations, the realm under the PV diagram should be calculated and that we are using Simpson method for calculating it.
4] Two arrays of name of parameters and their units are made as per the info file given so the user must make a choice from them to plot respective graphs. For this 2 inputs of the user are taken using the input command and data type is about as 'int. The user is entering column number as input and results are generated.
CODE :-
import math
import matplotlib.pyplot as plt
import numpy as np
from scipy.integrate import simps

#Compatibility check
fname = input("Enter the filename:..")

if fname == 'engine_data.out':
	print('file is valid')
else:
	print('file is invalid')

	exit()

def compatibility_check(a):

	if 'CONVERGE' not in a:

		print('Please provide converge output file to process')

		exit()

	else:

		print('Compatibility check is successful')

		pass

#try:
open('engine_data.out')


line_count = 1

# Creating an empty array to store the values of Volume and pressure respectively
Volume =[]
pressure =[]

v = 8
p = 2

# Creating null array and storing all the values of data file in to it

data =[]

for line in open('engine_data.out'):
	if '#' not in line:
	  data.append(line.split())
	  if line_count >= 6:
	  	Volume.append(float(line.split()[v-1]))
	  	pressure.append(float(line.split()[p-1]))

	line_count = line_count + 1

#plotting p-v diagram
plt.plot(Volume, pressure, linewidth = 2, color = 'b')
plt.xlabel('Volume')
plt.ylabel('pressure')
plt.title("p-v diagram of engine")
plt.grid()
plt.show()

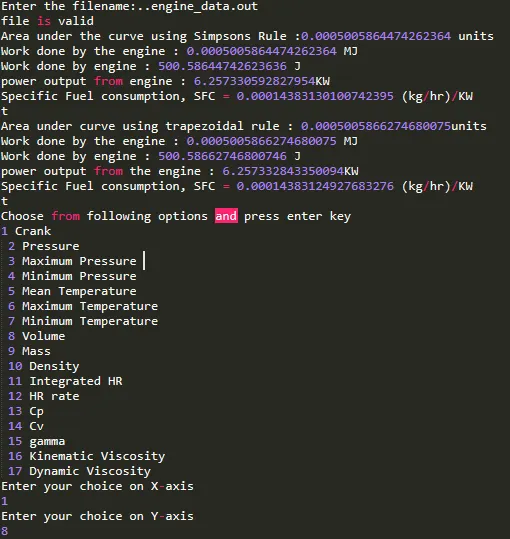
area = simps(pressure,Volume)
print('Area under the curve using Simpsons Rule :' +str(area) + ' units')
print('Work done by the engine : ' + str(area) + ' MJ')
area = area * 1e6
print('Work done by engine : ' + str(area) + ' J')

	# Inputs
	# Speed of an Engine
rpm = 1500
rps = 1500/60
stroke_cycle = rps/2

	# Fuel consumption in micrograms per 1 stroke cycle

fuel_consumption = 20

	# Engine specifications
	# Number of cylinder
n = 1
	# 4 stroke engine
	# Calculation of power output and Specific fuel consumption

power_output = n*area*stroke_cycle/(1000)
print('power output from engine : ' + str(power_output) + 'KW')
SFC = (fuel_consumption*pow(10,-6)*stroke_cycle*3600)/(power_output*1000)
print('Specific Fuel consumption, SFC = ' + str(SFC) + ' (kg/hr)/KW')
print('t')

	# Calculation of Area under PV diagram
Area = np.trapz(pressure,Volume)
print('Area under curve using trapezoidal rule : ' + str(Area) + 'units')
print('Work done by the engine : ' + str(Area) + ' MJ' )
Area = Area * 1e6
print('Work done by engine : ' + str(Area) + ' J')
power_output = n*Area*stroke_cycle/(1000)
print('power output from the engine : ' + str(power_output) + 'KW')
SFC = (fuel_consumption*pow(10,-6)*stroke_cycle*3600)/(power_output*1000)
print('Specific Fuel consumption, SFC = ' + str(SFC) + ' (kg/hr)/KW')
print('t')

	# Transposing columns in to row matrix and converting them in to float type from string type
transpose = np.transpose(data)
float_f  = transpose.astype(np.float)
	# Array for header and their units

parameters = ['Crank','Pressure','Maximum Pressure','Minimum Pressure','Mean Temperature','Maximum Temperature','Minimum Temperature','Volume','Mass','Density','Integrated HR','HR rate','Cp','Cv','gamma','Kinematic Viscosity','Dynamic Viscosity']
units = ['(DEG)','(Mpa)','(Mpa)','(Mpa)','(K)','(K)','(K)','pow(m,3)','(kg)','(kg/(pow(m,3)))','(J)','(J)','(J/time)','(J/kgK)','(J/kgK)','','pow(m,2)/s','(Ns/pow(m,2)']

# Providing user choice of picking 2 parameters for plotting
print('Choose from following options and press enter key')
print('1 Crank \n 2 Pressure \n 3 Maximum Pressure \n 4 Minimum Pressure \n 5 Mean Temperature \n 6 Maximum Temperature \n 7 Minimum Temperature \n 8 Volume \n 9 Mass \n 10 Density \n 11 Integrated HR \n 12 HR rate \n 13 Cp \n 14 Cv \n 15 gamma \n 16 Kinematic Viscosity \n 17 Dynamic Viscosity')

X = int(input('Enter your choice on X-axis \n'))

Y = int(input('Enter your choice on Y-axis \n'))


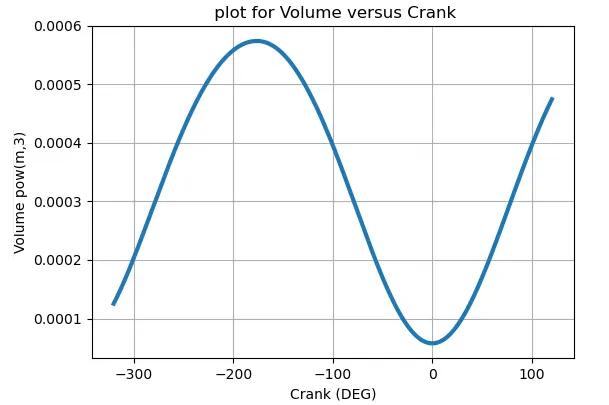
# Plotting hr figure based on user choice
plt.figure(1)
plt.plot(float_f[X-1],float_f[Y-1],linewidth=3)
plt.title(' plot for ' + parameters[Y-1]+ ' versus ' +parameters[X-1],color='k')
plt.xlabel(parameters[X-1] + ' ' +units[X-1])
plt.ylabel(parameters[Y-1] + ' ' +units[Y-1])
plt.grid()
plt.show()
RESULT & PLOT :-
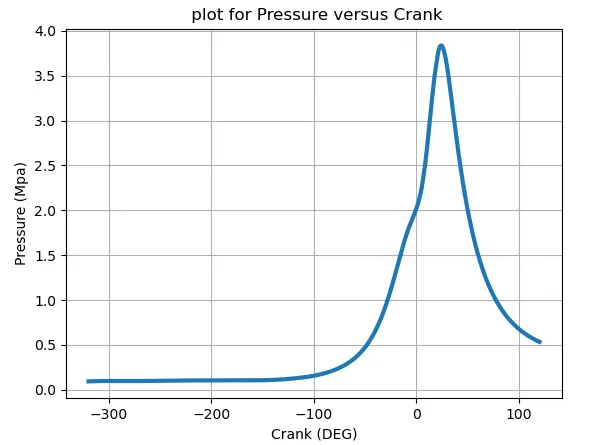
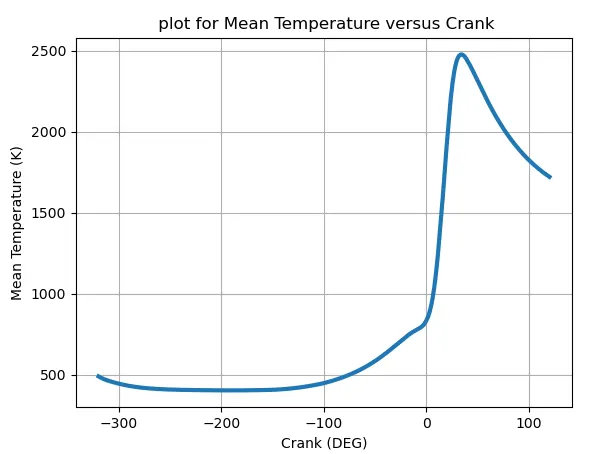
CONCLUSION :-
Python program ran successfully.