Week 6 - Data analysis
AIM - Write a script that does data analysis.
Objectives - To ensure
1. Data visualizer
2. Compatability check
3. Basic performance calculation
Theory
This code takes takes the data from a user specified CONVERGE format file. It also checks the file for the correct format i.e. compatibility. If the file is not a CONVERGE output data format then the code will throw an error statement "This is not a valid CONVERGE output file.". Also, if the file format is correct but, there is no data present in the file then the code will prompt the user "No data present in the file".
If the format is correct and data is present then the code will implement following steps:-
1) Data extraction - Extracting data along with the column name and column number from the CONVERGE output file. Complete data from the file is stored in a two dimensional array 'data' The columns of data matrix/2D array contains the data for each individual parameter.
2) Data visualizer - Provide an "Input map" to user so that he/she can use numbers as an input to designate the variables to be ploted. Ask user if plot between any two variables is required. If input is 'y' representing 'yes' then, ask for the numbers representing the variables to be ploted (Refering input map). Ask the user if the plot is to be saved. Then, show the plot. Above step is under while loop and runs untill user gives an input 'n' to the question "Do you want to plot any other variable? (y/n): ".
3) Basic performance - Extract volume and pressure data from matrix 'data' and store in array 'volume' and 'pressure' respectively. Next, numerically integrate pressure and volume data using 'simps' function (Function for numerical integration by Simphson's rule) from scipy.integrate library. This integration is area under the P-V curve i.e. work done per cycle. Then, RPM of the engine at which the data was collected and fuel consumption in microgram per cycle is taken as user input. Next, the power produced by the engine at this RPM is calculated. Finally, the Specific fuel consumption is calculated and Area under the curve, Power output and Specific fuel consumption are displayed.
import matplotlib.pyplot as plt
import math
import numpy as np
from scipy.integrate import simps

line_count = 1

try:
	data = open('engine_data.out','r')
except FileNotFoundError:
	print('"File not recognized. Please provide a valid output file"')


parameter = ['Crank Angle','Pressure','Maximum Pressure','Minimum Pressure','Mean Temperature','Maximum Temperature','Minimum Temperature','volume','Mass','Density','Heat Rejection Rate','C_p','C_v','gamma','Kinematic Viscosity','Dynamic Viscosity']
print(parameter)
print('Followings are the codes for corresponding parameters,Please follow the Instructions')
corresponding_num = ['crank_angle=0','pressure=1','max_pres=2','min_pres=3','mean_temp=4','max_temp=5','min_temp=6','volume=7','mass=8','density=9','Heat Rejection=10','Heat Rejection=11','C_p=12','C_v=13','gamma=14','Kinematic Viscosity=15','Dynamic Viscosity=16']
print(corresponding_num)

first_column=input('Enter the first column:')
second_column=input('Enter the second column:')
print('\n')


first_column=int(first_column)
second_column=int(second_column)

values_of_column_1=[]
values_of_column_2=[]

for line in open('engine_data.out'):
	if line_count is 3:
		column_name_1=line.split()[first_column]
		column_name_2=line.split()[second_column]
	if'#' not in line:
		values_of_column_1.append(float(line.split()[first_column-1]))
		values_of_column_2.append(float(line.split()[second_column-1]))

		line_count+=1

area=float(simps(values_of_column_1, values_of_column_2))
print('area:{}\n' .format(area))


rpm=1500
speed=rpm/60
power=area*speed
print('power:{} \n' .format(power))

mass_of_fuel = 20*pow(10,-6)
specific_fuel_consumption=mass_of_fuel/power
print('specific_fuel_consumption: {}\n'.format(specific_fuel_consumption))


plt.plot(values_of_column_2,values_of_column_1 ,linewidth=3,color='red')
plt.xlabel(column_name_1,color='green',fontsize=12)
plt.ylabel(column_name_2,color='green',fontsize=12)
plt.title(column_name_2+'  VS  '+column_name_1,color='b',fontsize=15)
plt.savefig(column_name_2+'VS'+column_name_1+'.png')
plt.show()
Results
Results Explanation
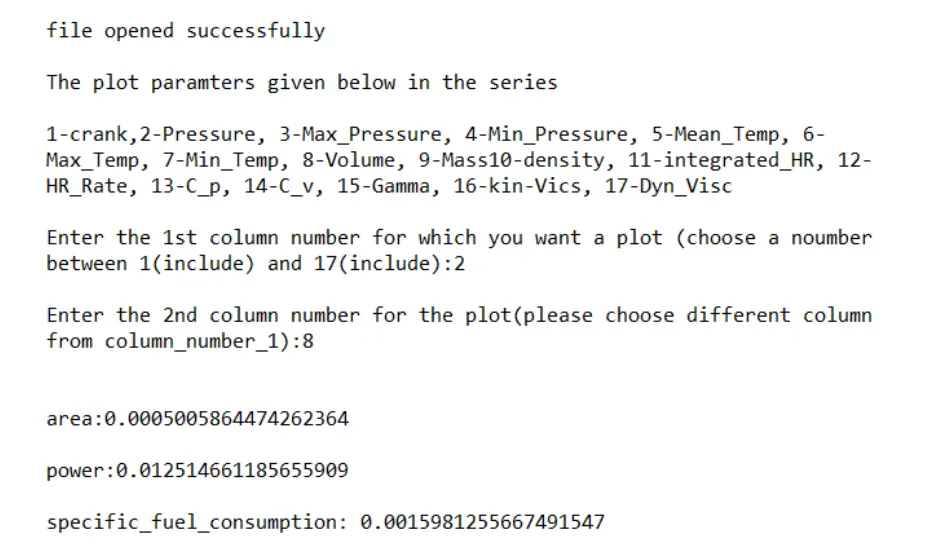
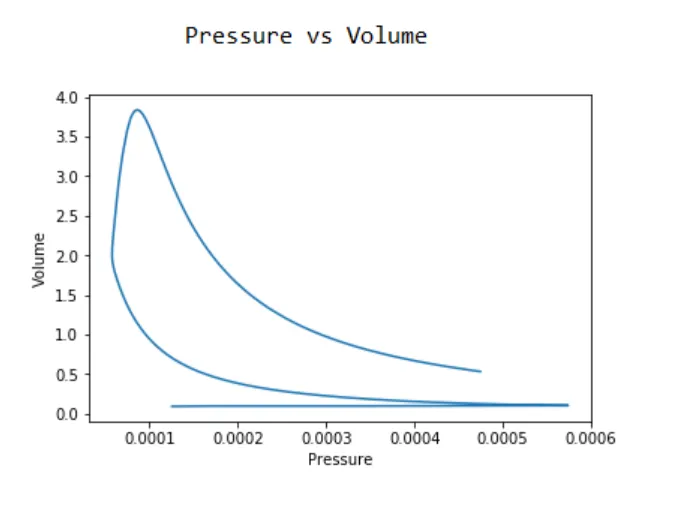
Area under the p-v diagram i.e, Work Done : 500.58662746800763 J
Power: 12.51466568670019 KW
Specific Fuel Consumption: 5.753249971073308e-06 gm/KWhr
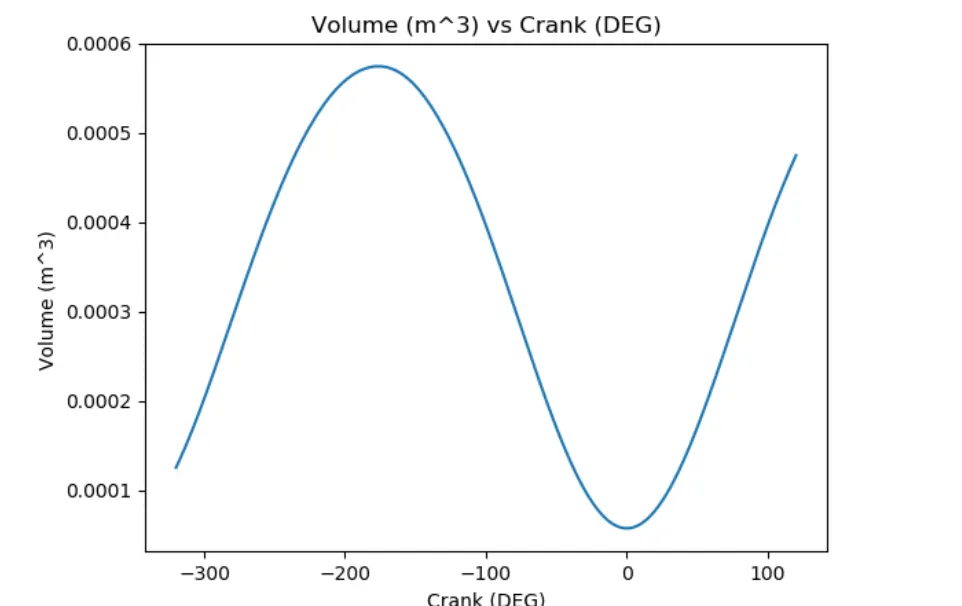
These are the outputs for the input of Pressure and Volume.
Conclusion
Hence , the data analysis was done and the all the questions were answered.