Week 3 - Solving second order ODEs
1. INTRODUCTION:-
The pendulum is a body or mass suspended from a fixed point so that it can swing back and forth under the influence of gravity . Pendulums are used to regulate the movement of clocks because the interval of time for each complete oscillation , called the period , is constant . The period depends on the length of the pendulum and also to a slight degree on the amplitude , the width of the pendulum's swing .
2. AIM:-
To solve the second - order ode function using Matlab which depicts the motion of the pendulum and to create an animation of the same .
3. OBJECTIVE:-
To write a program that solves the following ODE . This ODE represents the equation of motion of a simple pendulum with damping
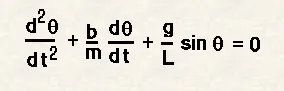
In the above equation
g = gravity in m / s2.
L = length of the pendulum in m.
m = mass of the ball in kg.
b - damping coefficient.
FIXED PARAMETERS
Length ( L ) = 1 metre
Mass ( m ) = 1 kg
Damping coiefficient ( b ) = 0.05
Acceleration due to gravity ( g ) = 9.81 m / s2
For Time period = 0-20 sec A
ngular displacement = 0
Angular velocity = 3 rad / sec at time t = 0 .
FUNCTION:-
% ODE FUNCTION
function [dtheta_dt] = ode_funs(t,theta,b,g,l,m);
theta1 = theta(1);
theta2 = theta(2);
dtheta1_dt = theta2;
dtheta2_dt = -(b/m)*theta2 - (g/l)*sin(theta1);
dtheta_dt = [dtheta1_dt; dtheta2_dt];
end
PROGRAM:-
close all
clear all
clc
% Demping co-eff
b=0.05;
% Acceleration due to gravity(m/s^2)
g=9.81;
% Length(M)
l=1;
% Mass(KG)
m=0.1;
% Initial condition
theta_0= [0;5];
% Time points
t_span = linspace(0,10,500);
% Solve ODE
[t, results] = ode45(@(t,theta) ode_fun(t,theta,b,g,l,m),t_span,theta_0);
% Plotting
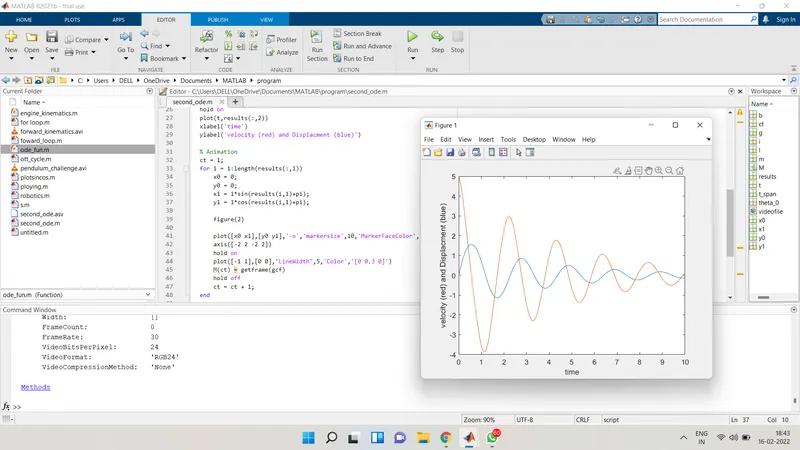
figure(1)
plot(t,results(:,1))
hold on
plot(t,results(:,2))
xlabel('time')
ylabel('velocity (red) and Displacment (blue)')
% Animation
ct = 1;
for i = 1:length(results(:,1))
x0 = 0;
y0 = 0;
x1 = 1*sin(results(i,1)+pi);
y1 = 1*cos(results(i,1)+pi);
figure(2)
plot([x0 x1],[y0 y1],'-o','markersize',10,'MarkerFaceColor','r','MarkerEdgeColor','r','LineWidth',4)
axis([-2 2 -2 2])
hold on
plot([-1 1],[0 0],"LineWidth",5,'Color','[0 0.3 0]')
M(ct) = getframe(gcf)
hold off
ct = ct + 1;
end
% Making movie for collected frames
movie(M);
% Creating a video file of '.avi'
videofile = VideoWriter('pendulum_challenge.avi','Uncompressed AVI')
open(videofile);
% Writing the movie in the videofile
writeVideo(videofile,M)
close(videofile)
LINK OF MY VIDEO:-
https://youtu.be/aawYoV4Hw4Q