Week 6 - Data analysis
Aim: To script the code to solve the data analysis of the file engine data and solving its p-v diagram.
Probelm statement given:
- Calculate the area under the P-V diagram. P is in column 2 and V is in column 8.
- Calculate the power output of this engine. Assume that RPM is 1500
- This engine consumed 20 micro grams of fuel (per 1 stroke cycle). Calculate its specific fuel consumption
Program code:
# Importing important libraries
import math
import matplotlib.pyplot as plt
from prettytable import PrettyTable
import numpy as np

#Input Parameters
crank = []
pressure = []
max_pressure = []
min_pressure = []
mean_temp = []
max_temp = []
min_temp = []
volume = []
mass = []
density = []
integrated_HR = []
HR_rate = []
Cp = []
Cv = []
gamma = []
kin_visc = []
dyn_visc = []

#Performing file parsing
for line in open('engine_data.out'):
    if '#' not in line:
        crank.append(float(line.split()[0]))
        pressure.append(float(line.split()[1]))
        max_pressure.append(float(line.split()[2]))
        min_pressure.append(float(line.split()[3]))
        mean_temp.append(float(line.split()[4]))
        max_temp.append(float(line.split()[5]))
        min_temp.append(float(line.split()[6]))
        volume.append(float(line.split()[7]))
        mass.append(float(line.split()[8]))
        density.append(float(line.split()[9]))
        integrated_HR.append(float(line.split()[10]))
        HR_rate.append(float(line.split()[11]))
        Cp.append(float(line.split()[12]))
        Cv.append(float(line.split()[13]))
        gamma.append(float(line.split()[14]))
        kin_visc.append(float(line.split()[15]))
        dyn_visc.append(float(line.split()[16]))

title = []
units = []

# Taking title from data provided
linecount = 1
for line in open('engine_data.out'):
    if linecount == 3:
        title.append(line.split())
    if linecount == 4:
        units.append(line.split())
    linecount+=1

t = [0,1,2,3,4,5,6,7,8,9,10,11,12,13,14,15,16]

print('All properties in given data')
table = PrettyTable(['Serial no.', 'Terms'])
for i in range(0,len(t)):
    table.add_row([t[i], title[0][i+1]])

print(table)

a = [crank, pressure, max_pressure, min_pressure, mean_temp, max_temp, min_temp, volume, mass, density, integrated_HR, HR_rate, Cp, Cv, gamma, kin_visc, dyn_visc]

x = int(input('Input x-axis: '))
y = int(input('Input y-axis: '))

plt.plot(a[x],a[y], 'r--')
plt.xlabel(title[0][x+1]+units[0][x+1])
plt.ylabel(title[0][y+1]+units[0][y+1])
plt.show()

pressure = np.array(pressure)*1e6
volume= np.array(volume)
area_under_pv = np.trapz(pressure,volume) #np.trapz integrates along given axis using trapezoidal rule and calculate the area under the curve
print('Work done = ', area_under_pv,'Joules')


#Power output
rpm = 1500
time_of_one_rev = rpm/60

onecycle = 2*time_of_one_rev
power = area_under_pv/onecycle
print('Power of engine = ',power,"Watt"'(when rpm is 1500)')
print('Power of engine = ', power/0.746, 'HP')

#Calculating Brake Specific Fuel Consumption
m = 20*pow(10,-6)
bsfc = (3600*m)/power
print('BSFC = ', bsfc, 'g/kWH')
Explanation:
The engine data file with 17 parameters is downloaded and referred. The datafile has crank angle, pressure, volume, density, temperature, mass, viscosity factor.
So with those data we need to generate the p-v diagram.
So initialization of those data with an empty array is done.
for loop command is used to read the required lin from the datafile.
line_count command is given to read and output that particular line from the data file. for example. line_count=1, then it is going to fetch the first line from the data file.
if '#' not in line is the command to get only the numerical data from the file.
Then float command is used while appending since the values are going to be in strings and in order to read that float is used.
Split is used to separate the values from the data file.
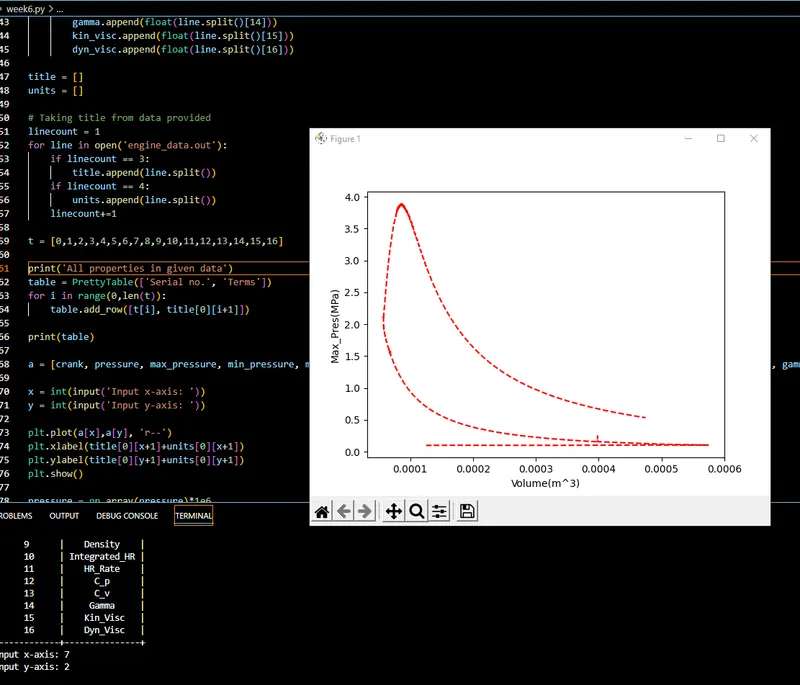
By commanding out the individual file opens to give the respective parameter as output and the plot for the same is obtained.
Prettytable is installed to obtain all the inputs and to plot between any required parameter.
Screenshot:
Result:
Hence the p-v diagram has been obtained for the engine data provided and the table with all the parameters is displayed through pretty table.
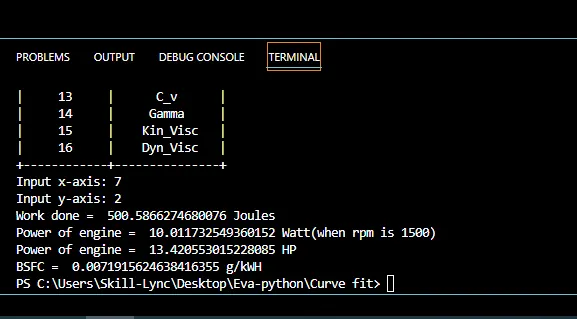
Workdone, power of the engine and sfc is output below.