Week 6 - Data analysis
This code is some sort of a data science procedure, to take in the data that are unreadable because of its vast amount and make it readable by making it written in a code or programming language so it can take us to the point where we actually need in the data.
the engine data is provided for which we are to make a code that should:
1.take column numbers as the input and plot the respective columns as separate images.
2.Each file should be saved by the name of the column
3.The plot labels should be extracted from the file. If, I request for a plot between column 1 (crank angle) and column 8(volume), then the label information should automatically be extracted and must appear as labels in the plots. THIS SHOULD NOT BE DONE MANUALLY
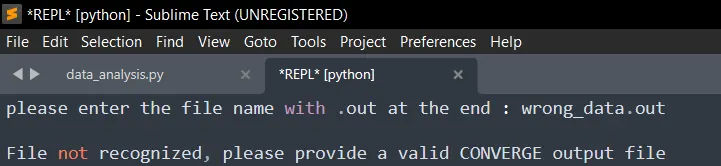
the name given in the input should match the data file. if it doesn't then the code should end saying:'File not recognized. Please provide a valid CONVERGE output file'
some performance of the engine should be calculated:
1.Calculate the area under the P-V diagram. P is in column 2 and V is in column 8.
2.Calculate the power output of this engine. Assume that RPM is 1500
3.This engine consumed 20 micro grams of fuel (per 1 stroke cycle). Calculate its specific fuel consumption.
MAIN CODE:
#importing the required modules for the function to understand the input modules
import math
import matplotlib.pyplot as plt
import numpy as np
#importing the trapz module from numpy
from numpy import trapz

#file name is defined so it takes in the data for the function
file_name = input('please enter the file name with .out at the end : ')

#checking the file name input if it is right or wrong, if right code proceed further else stops
try:
	#the data is made as the variable for the input file and is read with the 'r'.if the input name of the file is true then the code runs for the other stage.
	data = open(file_name,'r')
	print('\ndata file is found!')
except:
	#if file name is wrong then this output is shown as below
	print('\nFile not recognized, please provide a valid CONVERGE output file')

#the iteration is done with the help of lc
lc = 1
#for line in the read file if the iteration is at 3, then print the line with the variable name parameter.
for line in data:
	if lc == 3:
		parameters = line.split()
		#columns are but the length of the parameters
		columns = len(parameters)
		#the parameters and columns help in making a chart that contains the input parameters units for users to use as input.
		print('\nThis contain the whole ic engine datas that we extracted from the directory : ')
		#the column is made -1 since python takes the index to start from 0 and we are making no errors in the system
		print('this table below contains %d data columns' %(columns-1))

		#when the iteration reaches the fourth line of the data where units are, the values in it are made to save in unit.
		for line in data:
			if lc ==4:
				Unit =line.split()

			break

		#the column numbers are stored in a variable called cn
		for cn in range(1,columns):
			print(cn,parameters[cn],line.split()[cn])
		break

	lc = lc+1

#the input values of x and y are taken in.they are but the parameters that which are needed to be plotted and compared.
print('\nChoose two parameters from above')
print('\nEnter the number corresponds to the parameter from 1 to 17')
x = int(input('please print xaxis parameter : '))
y = int(input('please print yaxis parameter : '))
print('')

#the x and y values contains the values of the two inputs.
x_values = []
y_values = []

#iterations are done to take out the values of parameters, x and y labels for the plot.
lc = 1
for line in open(file_name,'r'):
	#when iteration reach line 3, the parameters names are made to be stored in the x and y label for plotting.
	if lc == 3:

		x_label = line.split()[x]
		y_label = line.split()[y]

	#when # sign is not at the line, then the parameters values are stored as x and y
	if '#' not in line:
		#-1 is done so we can get the right column values since python starts from 0
		x_values.append(float(line.split()[x-1]))
		y_values.append(float(line.split()[y-1]))


	lc = lc+1

#file name is charted from the variables extracted
file_name = y_label + ' vs ' + x_label + '.png'

#plotting of the parameters re done as asked.
plt.plot(x_values,y_values)
plt.xlabel(x_label)
plt.ylabel(y_label)
plt.title(y_label + ' vs ' + x_label)
plt.savefig(file_name)
plt.show()


#the values of engine outputs are asked for which we are using the formulas to providr the output
#revolution per minute is set to 1500 as given
RPM = 1500
#area traced by the parameters is found with the help of trapz command
Area = np.trapz(y_values,x_values)
#workdone by the engine is but the area / 1000
workdone = Area*1000
#power formula is m.2.pi.n/60
power = 2*math.pi*RPM*workdone/60
#fuel per stroke value is given below and it is taken for 20 micro grams of fuel as asked
fpst = 20*1e-6
#fuel per second
fpse = fpst*RPM*(0.5/60)
#value of fuel consumption per hour
fph = fpse*3600
#brake specific fuel consumption. it is but the fuel per hour/power.
bsfc = fph/power
print('')

#the values of the formula are printed with their own respective variable
print('area under the pv diagram(workdone) : ',workdone,'kJ')
print('Power output of this engine : ',power,'KW')
print('specific fuel consumption : ',bsfc,'g/kwh')
print('')
EXPLANATION FOR THE CODE:
importing the required modules for the function to understand the input modules
import math
import matplotlib.pyplot as plt
import numpy as np
#importing the trapz module from numpy
from numpy import trapz
file name is defined so it takes in the data for the function.the data is took into the system once the verification of the input data is done.
file_name = input('please enter the file name with .out at the end : ')
checking the file name input if it is right or wrong, if right code proceed further, else stops and asks the user to make a right input file with correct .out extension.
try:
#the data is made as the variable for the input file and is read with the 'r'.if the input name of the file is true then the code
runs for the other stage.
data = open(file_name,'r')
print('\ndata file is found!')
except:
#if file name is wrong then this output is shown as below
print('\nFile not recognized, please provide a valid CONVERGE output file')
the iteration is done with the help of lc
lc = 1
for line in the read file if the iteration is at 3, then print the line with the variable name parameter. which means if the line reading reads or comes to 3rd line then take in ll the values there as parameters.for loop is helpful in iteration.
for line in data:
if lc == 3:
parameters = line.split()
columns are but the length of the parameters. in other words columns are but the vertical rows in the data. they are found with the help of data stored in the the parameters.
columns = len(parameters)
the parameters and columns help in making a chart that contains the input parameters units for users to use as input.
print('\nThis contain the whole ic engine datas that we extracted from the directory : ')
the column is made -1 since python takes the index to start from 0 and we are making no errors in the system
print('this table below contains %d data columns' %(columns-1))
when the iteration reaches the fourth line of the data where units are, the values in it are made to save in unit.
for line in data:
if lc ==4:
Unit =line.split()
break helps in achieving the completion of the for loop clearly.
break
the column numbers are stored in a variable called cn. they are but what is present at the starting of each parameters for better iding of the parameters during calculations.
for cn in range(1,columns):
the values of the column number(cn), parameter names of the respective column and the units of parameters are printed in form of table for users to take in the values for further calculations.
print(cn,parameters[cn],line.split()[cn])
break helps in achieving the completion of the for loop clearly.
break
lc = lc+1
the input values of x and y are taken in.they are but the parameters that which are needed to be plotted and compared.
print('\nChoose two parameters from above')
print('\nEnter the number corresponds to the parameter from 1 to 17')
x = int(input('please print xaxis parameter : '))
y = int(input('please print yaxis parameter : '))
print('')
the x and y values contains the values of the two inputs.
x_values = []
y_values = []
iterations are done to take out the values of parameters, x and y labels for the plot.
lc = 1
for line in open(file_name,'r'):
#when iteration reach line 3, the parameters names are made to be stored in the x and y label for plotting.
if lc == 3:
x_label = line.split()[x]
y_label = line.split()[y]
when '#' sign is not at the line, then the parameters values are stored as x and y
if '#' not in line:
-1 is done so we can get the right column values since python starts from 0
x_values.append(float(line.split()[x-1]))
y_values.append(float(line.split()[y-1]))
lc = lc+1
the name for the file stored is made as the value of y variable and x variable combined.
#file name is charted from the variables extracted
file_name = y_label + ' vs ' + x_label + '.png'
plotting of the parameters re done as asked.
plt.plot(x_values,y_values)
plt.xlabel(x_label)
plt.ylabel(y_label)
plt.title(y_label + ' vs ' + x_label)
plt.savefig(file_name)
plt.show()
the values of engine outputs are asked for which we are using the formulas to providr the output
#revolution per minute is set to 1500 as given
RPM = 1500
#area traced by the parameters is found with the help of trapz command
Area = np.trapz(y_values,x_values)
#workdone by the engine is but the area / 1000
workdone = Area*1000
#power formula is m.2.pi.n/60
power = 2*math.pi*RPM*workdone/60
#fuel per stroke value is given below and it is taken for 20 micro grams of fuel as asked
fpst = 20*1e-6
#fuel per second
fpse = fpst*RPM*(0.5/60)
#value of fuel consumption per hour
fph = fpse*3600
#brake specific fuel consumption. it is but the fuel per hour/power.
bsfc = fph/power
print('')
#the values of the formula are printed with their own respective variable
print('area under the pv diagram(workdone) : ',workdone,'kJ')
print('Power output of this engine : ',power,'KW')
print('specific fuel consumption : ',bsfc,'g/kwh')
print('')
OUTPUT WE'VE ACHIEVED WITH THE CODE:
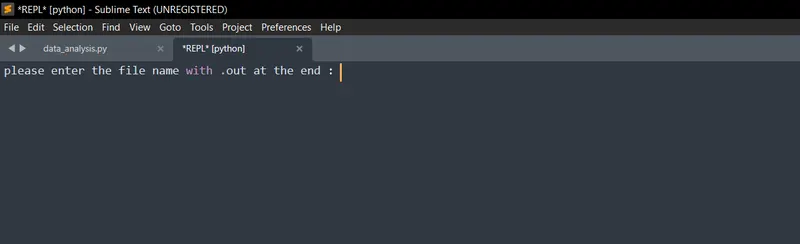
the data input is asked:
when a wrong data is given in as input:
when the right data is provided:

the code opens up the data to make the plot we want:
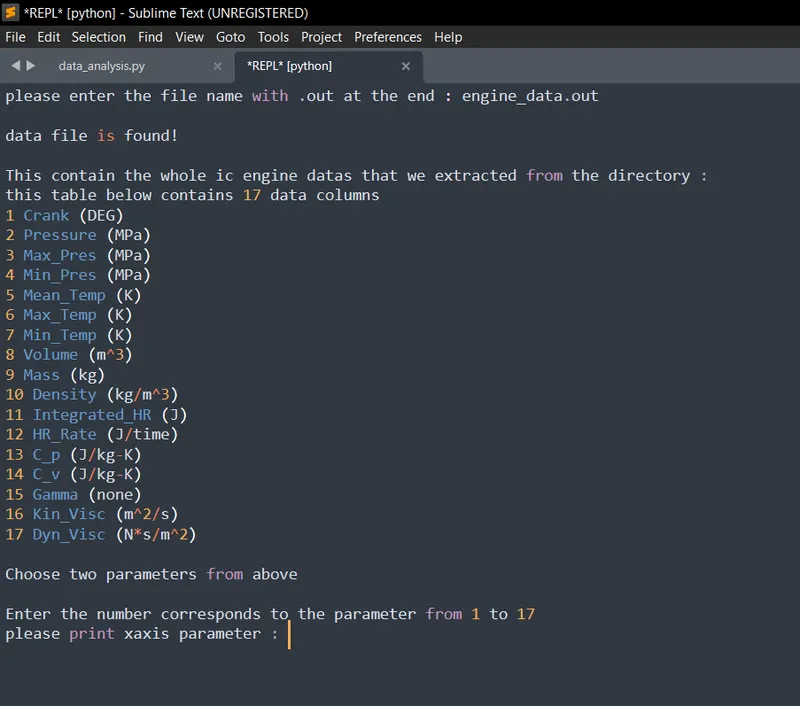
the inputs of x and y are entered which are but the 2 parameters of the engine we need to see visual plot data:
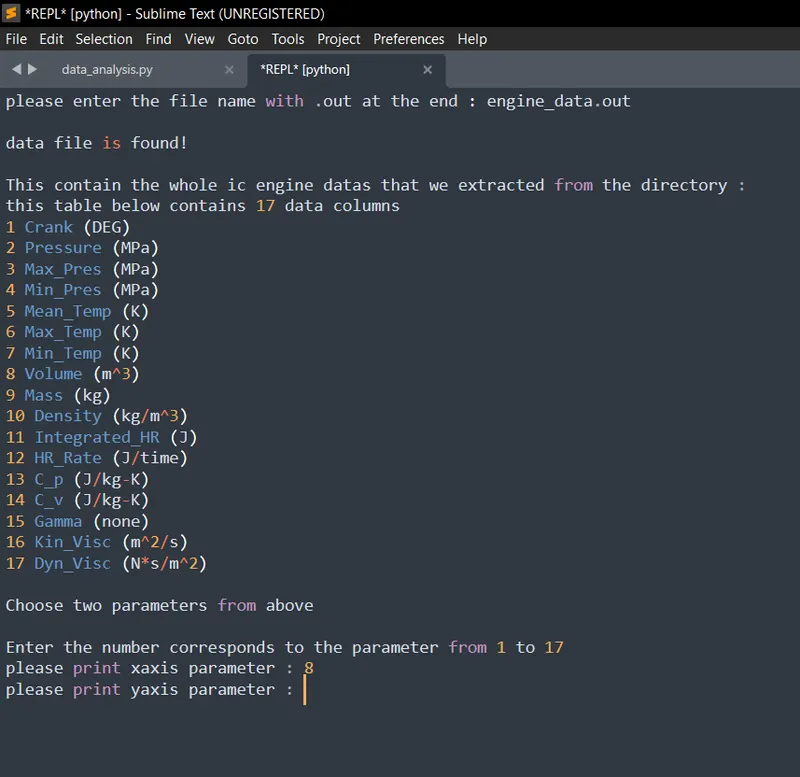
here we give in the parameters such as volume and pressure for which we are to visualize the data in plot:
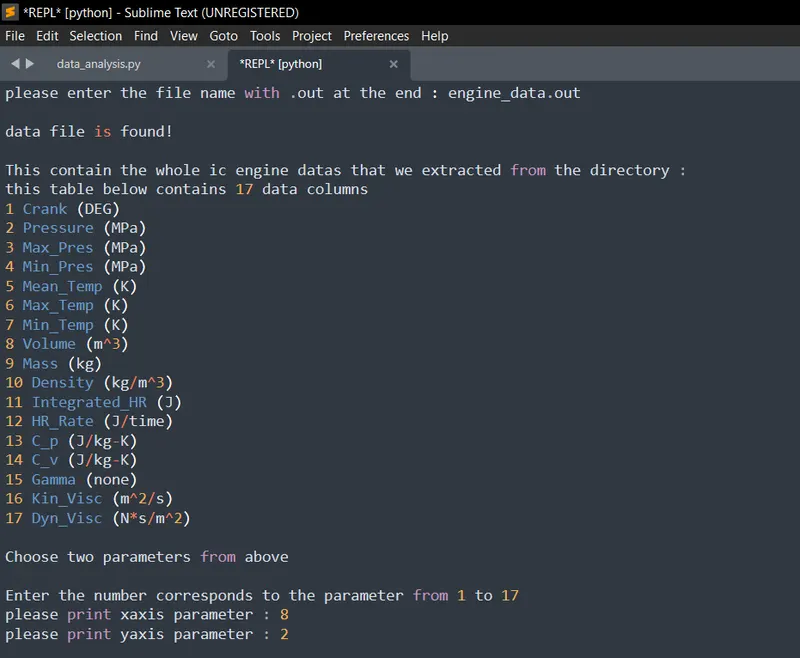
we obtain the plot of them both, which gets stored in the directory as their names:
plot:
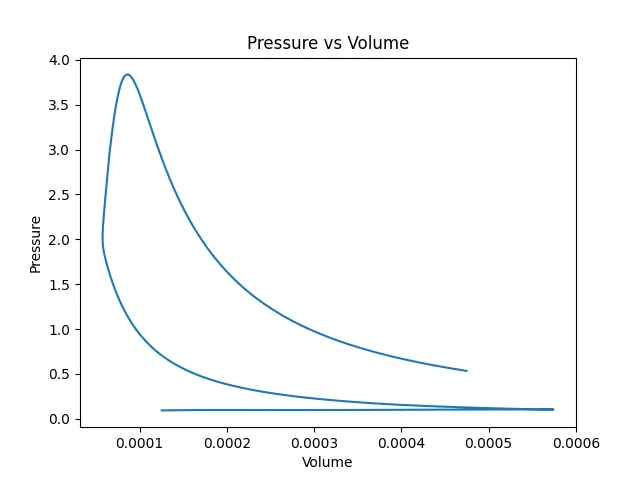
the plot is as we see for pressure vs volume. but we can have any plot by changing the x and y inputs.
the calculation output of the engines are made to show below:
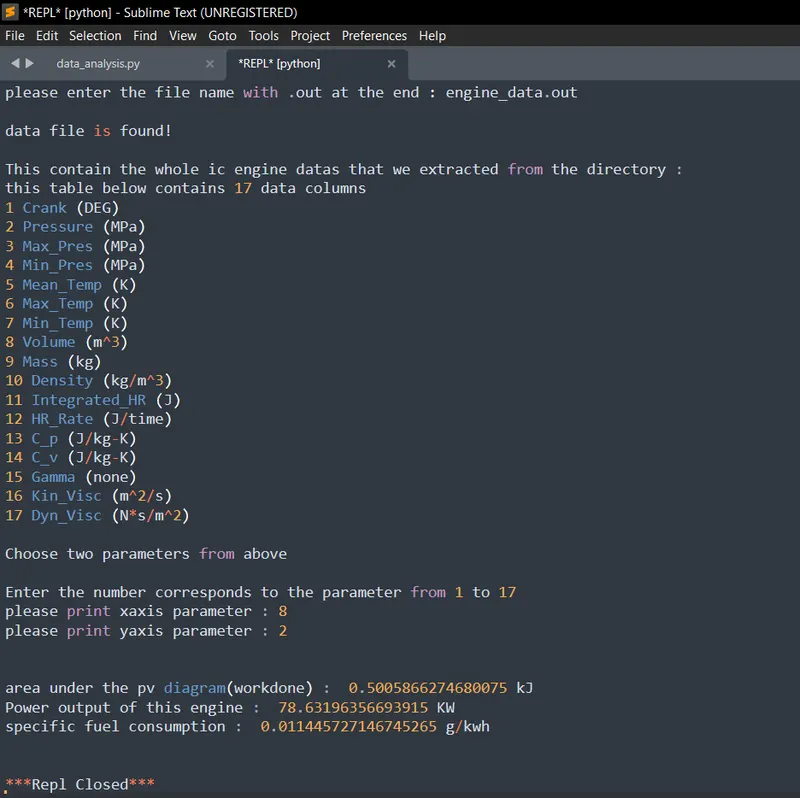
the area, pv diagram and the specific fuel consumption are found by using their own respective formula and charted in the output screen.
the most important thing is to change the build system of the entire code since the python is not meant to take in inputs when the code is once executed.
we are to install sublimeREPL, for the function or any code which requires inputs after once the code is executed. we can search for it in youtube and many provides the installation of it.
conclusion:
the knowledge for the completion is taken from many youtube videos of python and the course video provided.
hoping the asked conditions are satisfied.