Week 6 - Data analysis
Aim: To create a data visualizer tool that do the following things.
Data visualizer:
- Script should take column umbers as input and plot the respective columns separate.
- Each file should be saved by the column name.
- Plot labels should be extracted from the data.
Compatability check:
- The code should exit, if a non-compatible file is provided as input.
Basic peroformance calculation:
- Calculate the area under the PV diagram.
- Calculate the power output of the engine.
- Calculate the specific fuel consumption.
Data file:
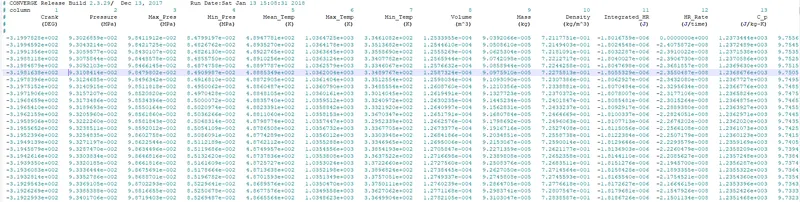
Code for data analysis:
#Python code for data analysis

import matplotlib.pyplot as plt
import math
import numpy as np
from numpy import trapz

print('General Instruction')
print('Please make sure that the CONVERGE data file is saved in the same directory where Python code is saved.')
file_name=input('Enter the CONVERGE file having .out extension : ')


#Compatability check
try :
    data = open(file_name,'r')
    print('\nData file is succesfully opened.')


except FileNotFoundError:
    print('\nPlease Enter a valod filename.\n')


line_count=1
for line in data:


    if line_count==3:
        Parameter=line.split()
        Columns=len(Parameter)
        print('\nThis CONVERGE file contains following data which is derived from I.C. Engine Simulation :')
        print('It has total %d Data Columns' %(Columns-1))


        for line in data:
            if line_count==4:
                Unit=line.split()
            break

        for C_no in range(1,Columns):
            print(C_no,line.split()[C_no],line.split()[C_no])
        break
    line_count=line_count+1


print('\nChoose any Two Parameter From Above.')
print('Enter a number corresponding to parameter 1 to 17.\n')
x=int(input("Enter X-axis Parameter : "))
y=int(input("Enter Y-axis Parameter : "))


x_data=[]
y_data=[]


line_count=1
for line in open(file_name,'r'):
    if line_count==3:
        X_label = line.split()[x]
        Y_label = line.split()[y]
        if line_count<=4:
            x_label=line.split()[x]+line.split()[x]
            y_label=line.split()[y]+line.split()[y]


    if '#' not in line:
        x_data.append(float(line.split()[x-1]))
        y_data.append(float(line.split()[y-1]))

    line_count=line_count+1


filename=Y_label+'vs'+X_label+'.png'

plt.figure()
plt.plot(x_data,y_data)
plt.xlabel(x_label)
plt.ylabel(y_label)
plt.title(Y_label+' vs '+X_label)
plt.savefig(filename)
plt.show()


if x==8 and y==2:
    RPM=1500
    Area=np.trapz(y_data,x_data)
    Workdone=Area*1000
    Power=2*math.pi*RPM*Workdone/60
    Fuel_per_Stroke=20*1e-6
    Fuel_per_Sec=Fuel_per_Stroke*RPM*(0.5/60)
    Fuel_per_Hour=Fuel_per_Sec*3600
    BSFC=Fuel_per_Hour/Power

    print('Area under the P-V diagram(Workdone) :',Workdone,'kJ')
    print('Power Output of this Engine :',Power,'kW')
    print('Specific Fuel Consumption :',BSFC,'g/kWh')
Code explanation:
- Importing useful modules from libraries.
- Asking for a converge file.
- If the corresponding file is present, then it shows 'Data file is succesully opened'.
- If a non compatible file is provided, it will exit.
- line_count: counting lines of converge data file
- Splitting of line is done using line_split. Here # symbol is used.,
- Printing different parameters with their corresponding units.
- For data visualization, X-parameter and y-parameter is used, which is respectively indipendent and dependent variables.
- Empty array of x and y are created.
- If x=8 and y=2, calculating area under the PV curve using 'trapz' from numpy. Also finding work done, specific fuel consumption using respective formulas.
Compatability check:

If a non compatible file is provided, it shows " Please enter a valid filename".
Result:
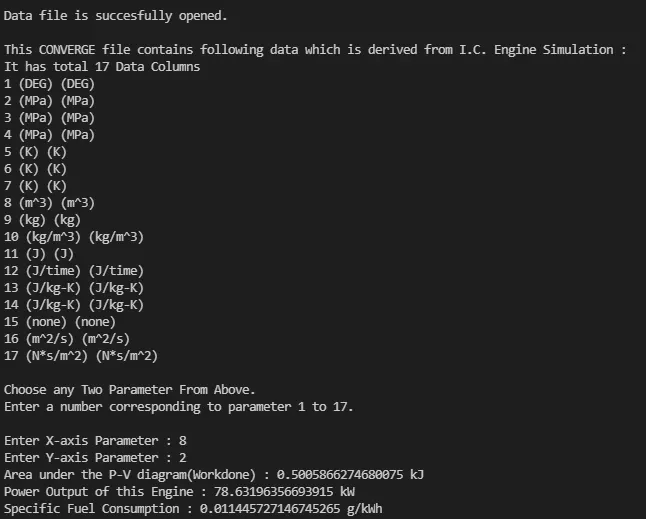
Data visualization:
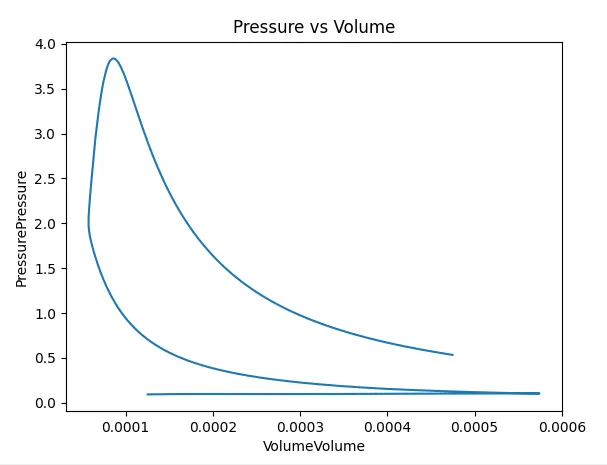
Output:
Area under PV diagram (Work done): 0.5 kJ
Power output of this engine: 78.63 kW
Specific fuel consumption : 0.011 g/kWh