Project 1 - Parsing NASA thermodynamic data
Aim: Write a function that extracts the 14 co-efficients and calculates the enthalpy, entropy and specific heats for all the species in the data file.
Objective:
- To develop a function that extracts the 14 coefficients and calculate enthalpy, entropy and specific heats for all the species in the data file.
- Develop a code to calculate the molecular weight of each species.
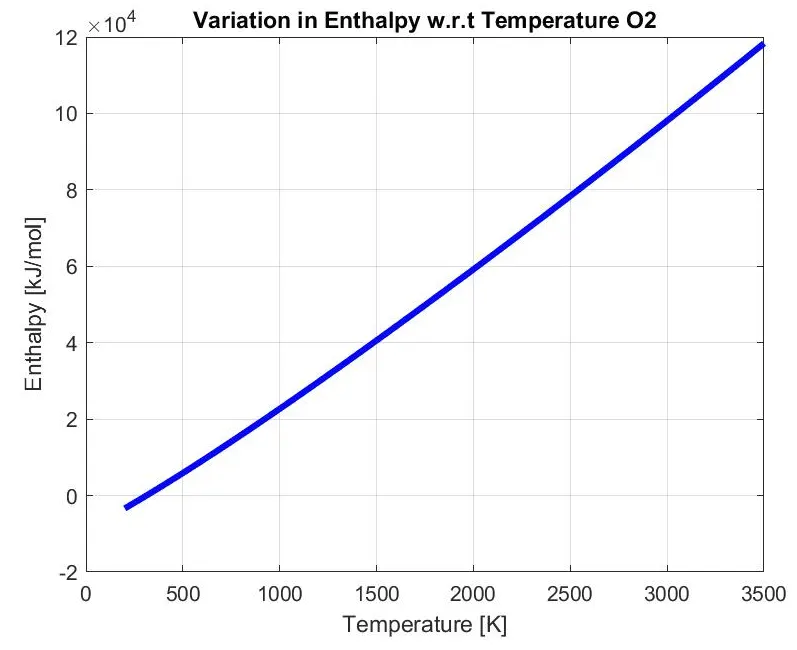
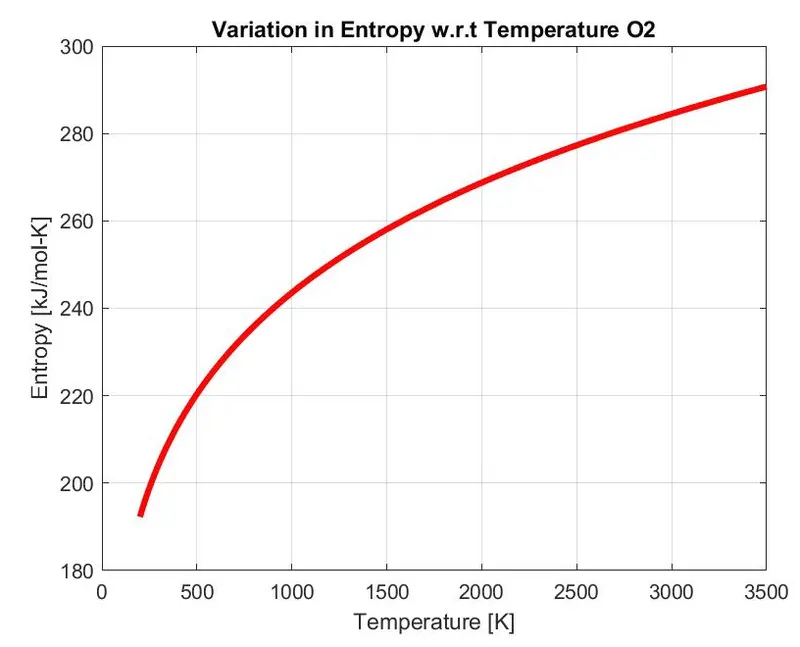
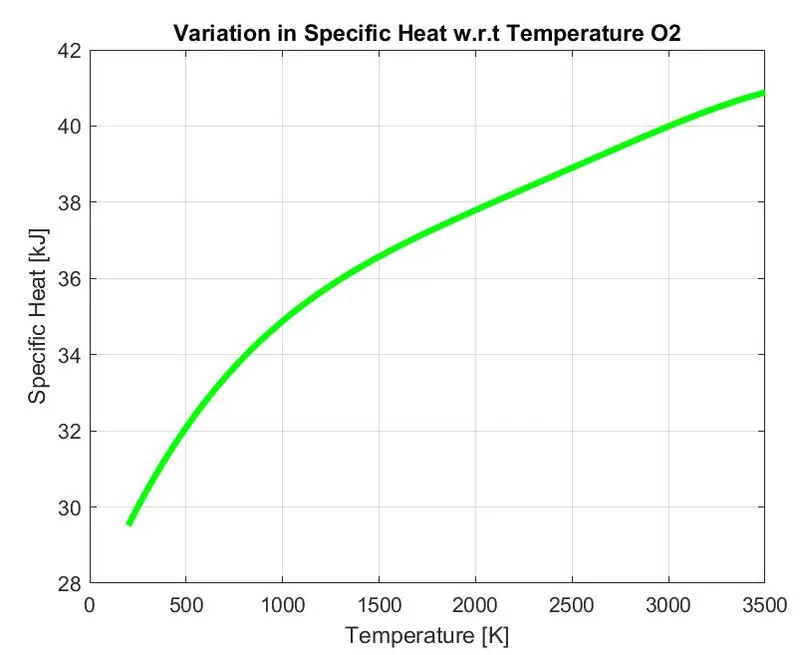
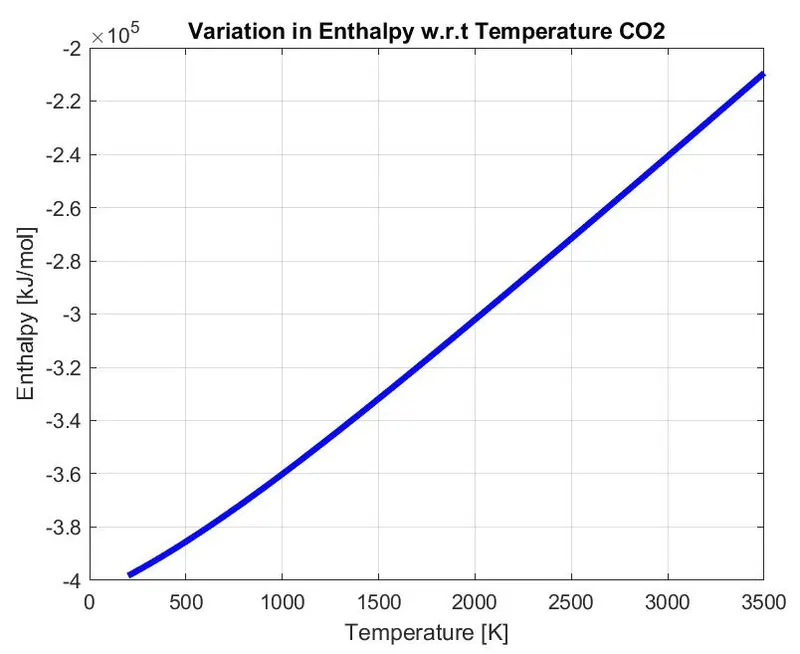
- To plot entropy, enthalpy and Cp for the given temperature ranges.
Solution procedure:

We use the above mentioned equations as function code in matlab and used to calculate the above.
Steps for choosing the logic of code and file parsing:
- fopen is used to open the file and parse the file.
- fgetl is used to get that particular line from the file.
- Reading the text from header file and read the file line by line.
- Using string split command, cell array is generated.
- Function for enthalpy, entropy and specific heat is created to calculate them by taking values from the file.
- Molecular weight is calculated using function code.
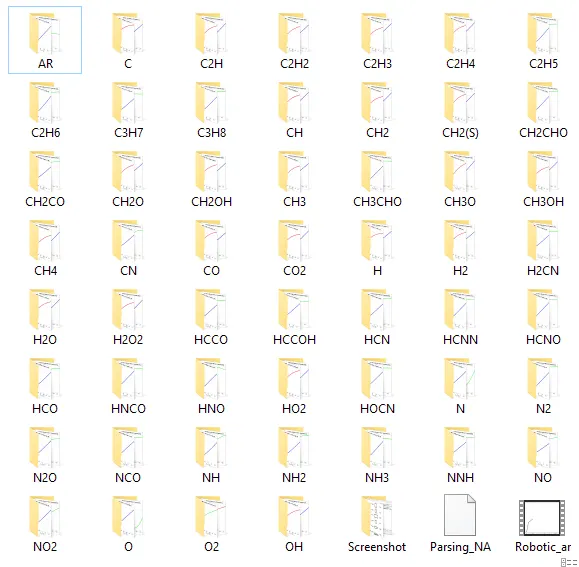
- Plots for Cp,H,S are created for each species and saved in a folder in jpg format.
- Creating folders for different different molecules and save the plots.
Code for the functions used in main program:
Entropy:

function [S]=entropy_S(x1,x2,x3,x4,x5,x7,x8,x9,x10,x11,x12,x14,temp,gb_m,r)

%First 7 coefficients are high temperature coefficients and next 7 are low
%temperature coefficients
if(temp<=gb_m)
    S=(x8*log(temp)+(x9*temp)+(x10*(temp.^2)/2)+(x11*(temp.^3)/3)+(x12*(temp.^4)/4)+(x14))*r;
else
    S=(x1*log(temp)+(x2*temp)+(x3*(temp.^2)/2)+(x4*(temp.^3)/3)+(x5*(temp.^4)/4)+(x7))*r;
end
endEnthalpy:

function [H]=enthalpy_H(x1,x2,x3,x4,x5,x6,x8,x9,x10,x11,x12,x13,temp,gb_m,r)

%First 7 coefficients are high temperature coefficients and next 7 are low
%temperature coefficients
if(temp<=gb_m)
    H=r*temp.*(x8+((x9*temp)/2)+((x10*(temp).^2)/3)+((x11*(temp).^3)/4)+((x12*(temp).^4)/5)+((x13./temp)));
else
    H=r*temp.*(x1+((x2*temp)/2)+((x3*(temp).^2)/3)+((x4*(temp).^3)/4)+((x5*(temp).^4)/5)+((x6./temp)));
end
Specific heat (Cp):

function [Cp]=Specific_heat(x1,x2,x3,x4,x5,x8,x9,x10,x11,x12,temp,gb_m,r)

%First 7 coefficients are high temperature coefficients and next 7 are low
%temperature coefficients
if(temp<=gb_m)
    Cp=r*(x8+(x9*temp)+(x10*(temp).^2)+(x11*(temp).^3)+(x12*(temp).^4));
else
    Cp=r*(x1+(x2*temp)+(x3*(temp).^2)+(x4*(temp).^3)+(x5*(temp).^4));
end
Molecular weight:
%function to calculate molecular mass
function mw=mol_wt(sp_name)

%storing value
compound_name=(sp_name);

%creating an array of elements
key_at=['C','H','O','N','A'];

%storing atomic mass value in the array
value_at=[12.0107 1.00794 15.994 14.0067 39.948];

%assigning molecular mass as 0
mw=0;

%creating loop
for i=1:length(compound_name)
    for j=1:length(key_at)

        %comparing string value
        if strcmp(compound_name(i),key_at(j))

            %if above comparison is true, value of molecular mass is
            %calculated
            mw=mw+value_at(j);

            %storing the position for further use
            pos=j;
        end
    end

    %converting the string to number
    k=str2num(compound_name(i));

    %comparing if the value of k is greater than executed, the further
    %statements
    if(k>1)

        %molecular mass calculation
        mw=mw+value_at(pos)*(k-1);
    end
end

%command to print the molecular mass of the molecule
fprintf('Molecular weight of the species %s is %f',compound_name,mw)
end
Main code for NASA file parsing and plot generation:
close all
clear all
clc

f1=fopen('THERMO.dat','r');
first_line=fgetl(f1);

%R= universal gas constant (J/mol-K)

R=8.314;
temp=fgetl(f1);

%Reading the global temperature

A=strsplit(temp,' ');

%Cell array generation

glob_lowtemp=str2double(A{2});
glob_midtemp=str2double(A{3});
glob_hightemp=str2double(A{4});

%Temperature range


for j=1:3
    k=fgetl(f1);
end

%Running for loop for 53 times corresponding to 53 species

for i=1:53

    %Parsing of species block
    tline=fgetl(f1);
    S=strsplit(tline,' ');
    Species_name=S{1};
    endl=length(S);
    local_low_temp=str2double(S{endl-3});
    local_mid_temp=str2double(S{endl-1});
    local_high_temp=str2double(S{endl-2});
    Temperature=linspace(local_low_temp,local_high_temp,1000);
    %Extracting the coefficients from the first line
    line2=fgetl(f1);
    x=findstr(line2,'E');

    %Finding the 5 coefficients

    x1=line2(1:x(1)+3);
    x1=str2double(x1);

     x2=line2(x(1)+4:x(2)+3);
    x2=str2double(x2);

     x3=line2(x(2)+4:x(3)+3);
    x3=str2double(x3);

     x4=line2(x(3)+4:x(4)+3);
    x4=str2double(x4);

     x5=line2(x(4)+4:x(5)+3);
    x5=str2double(x5);

    %Line 3 5 coefficients

    line3=fgetl(f1);
    x=findstr(line3,'E');

     x6=line3(1:x(1)+3);
    x6=str2double(x6);

     x7=line3(x(1)+4:x(2)+3);
    x7=str2double(x7);

     x8=line3(x(2)+4:x(3)+3);
    x8=str2double(x8);

     x9=line3(x(3)+4:x(4)+3);
    x9=str2double(x9);

     x10=line3(x(4)+4:x(5)+3);
    x10=str2double(x10);


    %Line 4 coefficients

     line4=fgetl(f1);
    x=findstr(line4,'E');

     x11=line4(1:x(1)+3);
    x11=str2double(x11);

     x12=line4(x(1)+4:x(2)+3);
    x12=str2double(x12);

     x13=line4(x(2)+4:x(3)+3);
    x13=str2double(x13);

     x14=line4(x(3)+4:x(4)+3);
    x14=str2double(x14);


    %Entropy calculation
    S=entropy_S(x1,x2,x3,x4,x5,x7,x8,x9,x10,x11,x12,x14,Temperature,local_mid_temp,R);

    %Cp calculation

    Cp=Specific_heat(x1,x2,x3,x4,x5,x8,x9,x10,x11,x12,Temperature,local_mid_temp,R);

    %Enthalpy calculation

    H=enthalpy_H(x1,x2,x3,x4,x5,x6,x8,x9,x10,x11,x12,x13,Temperature,local_mid_temp,R);

    %Molecular weight calculation of different elements

    mw(i)=mol_wt(Species_name);

    %Reading and writing of molecular weight in the list of molecular
    %weight

    Moll_wt=fopen('Molecular Weight.txt','w');
    fprintf(Moll_wt,'Molecular Weight of the species is %s is %f \n',Species_name,mw);
    fprintf(Moll_wt,'\n');
    disp(' ')
    fclose(Moll_wt);

    %Plotting for species to the temperature and specific heat

    %Creating a folder for saving the species with its properties

    directory_curr=pwd;
    mkdir(Species_name);
    cd(Species_name);

    %plot1 for temperature and entropy
    %plot2 for temperature and enthalpy
    %plot3 for temperature and specific heat

    %plot1
    figure(1)
    plot(Temperature,H,'linewidth',3,'color','b');
    xlabel('Temperature [K]');
    ylabel('Enthalpy [kJ/mol]');
    grid on
    title (sprintf('Variation in Enthalpy w.r.t Temperature %s',Species_name));

    saveas(figure(1),'Enthalpy.jpg');

    %plot2
    figure(2)
    plot(Temperature,S,'linewidth',3,'color','r');
    xlabel('Temperature [K]');
    ylabel('Entropy [kJ/mol-K]');
    grid on
    title (sprintf('Variation in Entropy w.r.t Temperature %s',Species_name));

    saveas(figure(2),'Entropy.jpg');

    %plot3
    figure(3)
    plot(Temperature,Cp,'linewidth',3,'color','g');
    xlabel('Temperature [K]');
    ylabel('Specific Heat [kJ]');
    grid on
    title (sprintf('Variation in Specific Heat w.r.t Temperature %s',Species_name));

    saveas(figure(3),'Specific Heat.jpg');

     cd(directory_curr);
endOutput:
For saving the folder for the species:
Output for plots:
(1)Plot for O2:
(2) Plots for N2:
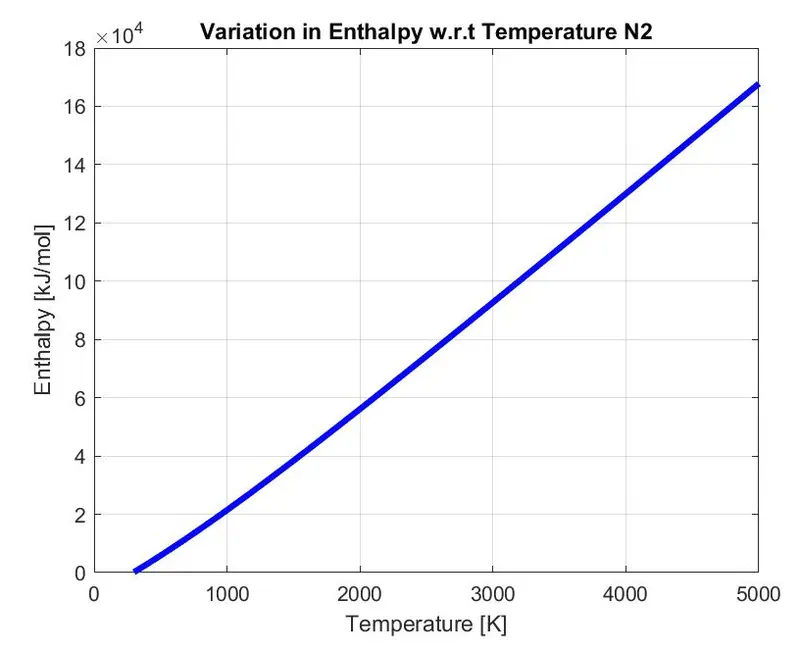
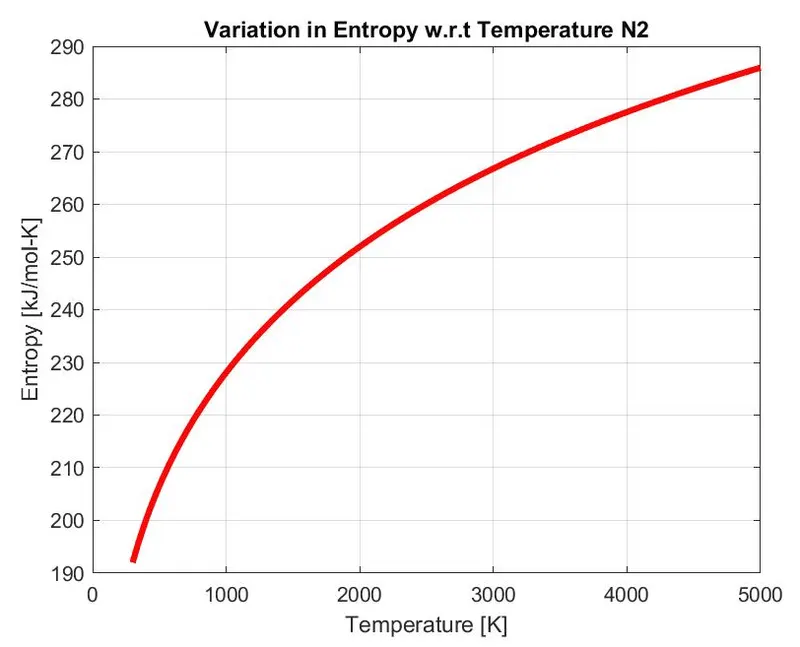
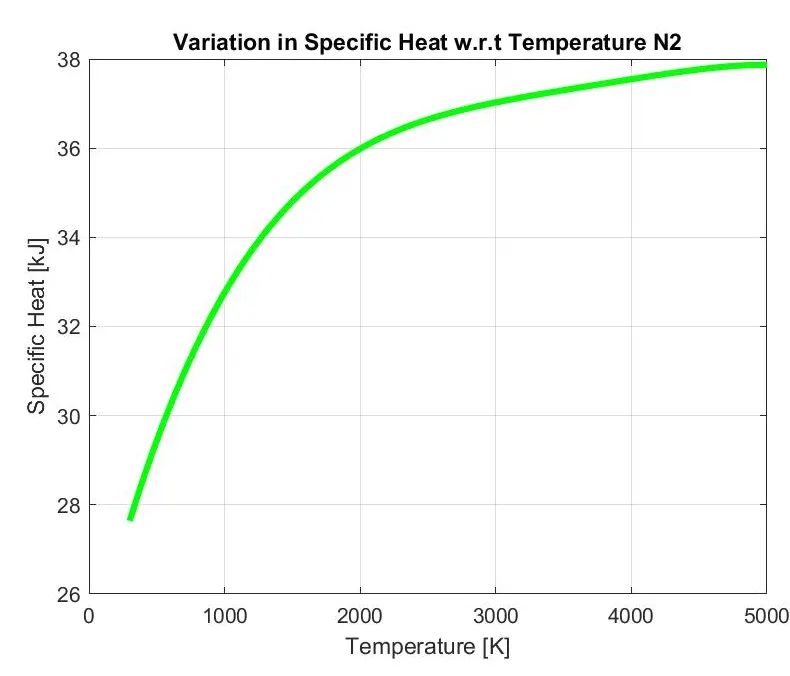
(3) Plots for CO2:
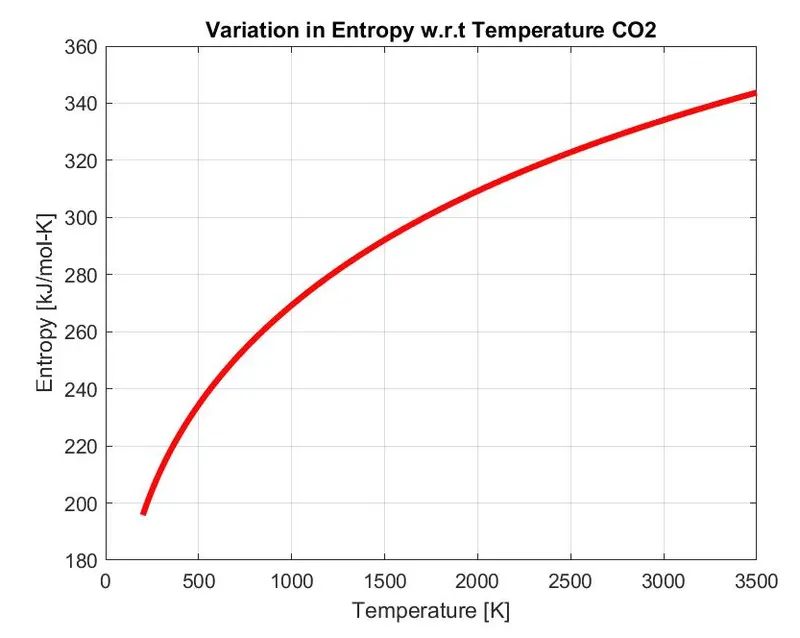
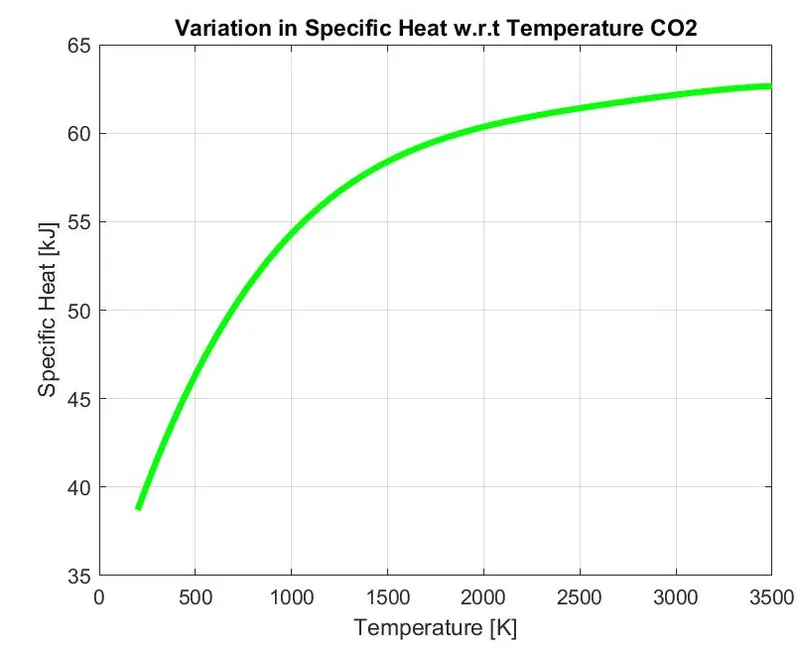
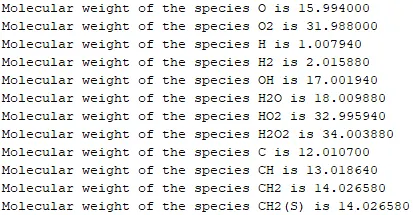
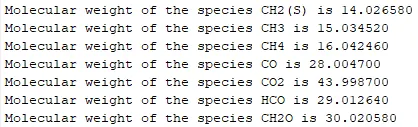
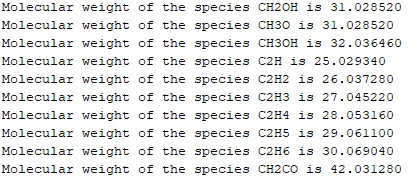
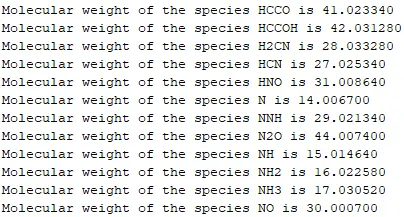
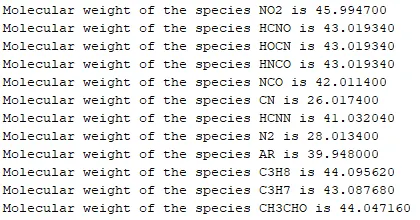
Output for the molecular weight of the molecule:

Conclusion:
- Parsing the file was done with plot generation
- Plots for 53 molecules are generated
- All three plots(H,S,Cp) were saved in a folder for each molecule
- Molecular weight is generated for each molecule.