Week 6 - Data analysis
To write the cooding using data parsing:
1.import math,matplotlib,numpy and spicy for simps and trapz
import math
import matplotlib.pyplot as plt
import numpy as np
from scipy.integrate import simps as simps , trapz as trapz
2.First input the file which carries data that to be analysis and checking their compatibility by using TRY option .Then open the data file.
file = 'engine_data.out'
try:
file = open('engine_data.out')
line_count = 1
3.The file which not recognized need to provide a CONVERGE output file
except:
print('file not recognized. please provide a valid CONVERGE output file')
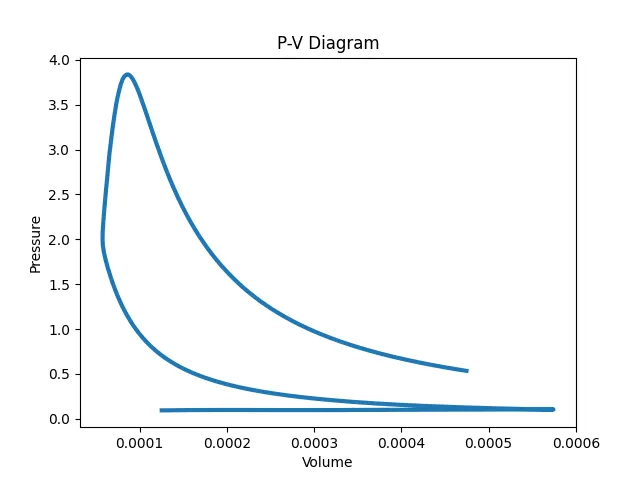
4.Creating the null array for pressure and volume , for plotting PV diagram from a data file in line 2 and 8 respectively, code for it and plotting them
pressure = []
volume = []
#pressure and volume in the data file is present in column 2 and 8 respectively
P = 2
V = 8
# getting a null array and storing all data values of the data file into it
data = []
for line in open('engine_data.out'):
if '#' not in line:
pressure.append(float(line.split()[P-1]))
volume.append(float(line.split()[V-1]))
line_count = line_count + 1
# plotting p_v diagram
plt.plot (volume,pressure,linewidth=3)
plt.xlabel('Volume')
plt.ylabel('Pressure')
plt.title('P-V Diagram')
plt.show()
# inputs
rpm = 1500
rps = 1500/60
stroke_cycle = rps/2
fuel_con = 20
n = 1
6.For calculating the sfc and power output by the Simpson rules and trapezoidal rule:Area=np.trapz(pressure,volume
area = np.trapz(pressure,volume)
print('area under the curve = ' +str(area) +'units')
7.calculation of power
power_output = n*area*stroke_cycle/(1000)
print('power outut from engine = ' +str(power_output) +'KW')
8.calculation of sfc
sfc = (fuel_con*pow(10,-6)*stroke_cycle*3600)/(power_output*1000)
print('specific fuel consuption, SFC = ' +str(sfc) + '(kg/hr)/(KW)')
print('------------------------------------------------------')
9.transposing coulmns nto raw matrix and converting them into float type from string type
transpose = np.transpose(data)
float_f = transpose.astype(np.float)
10. array for parameters
parameters = ['crank' , 'pressure' , 'maximum_pressure' , 'minimum_pressure' , 'mean_temperature' , 'maximum_temperature' , 'minimum_temperature' , 'volume' , 'mass' , 'density' , 'intrgrated_HR' , 'HR_rate' , 'Cp' , 'Cv' , 'gamma' , 'kinematic_viscosity' , 'dynamic_viscosity']
11.choice two parameters for plotting
print('choose any two from the following options')
print(' 1 crank n 2 pressure n 3 maximum_pressure n 4 minimum_pressure n 5 mean_temperature n 6 maximum_temperature n 7 minimum_temperatue n 8 volume n 9 mass n 10 densisty n 11 integrated_HR n 12 HR_rate n 13 Cp n 14 Cv n 15 gamma n 16 kinematic_viscosity n 17 dynamic_viscosity')
X = int(input('enter your choice on X_axis n'))
Y = int(input('enter your choice on Y_axis n'))
12.plotting other gragh based on your choice
plt.figure()
plt.plot(float_f [x-1] , float_f [y-1],linewidth= 3,colour='red')
plt.title('plot for' + parameters [x-1] + 'vs' + parameter[y-1])
plt.xlabel(parameter [x-1] )
plt.ylabel(parameter [y-1] )
plt.savefig(parameter[x-1] + 'vs' + parameter[y-1])
plt.show()
THE COMPLETE CODING IS :
""
   program to caculate the  engine parameter to plot
"""

import math
import matplotlib.pyplot as plt
import numpy as np
from scipy.integrate import simps as simps , trapz as trapz

#file input
file = 'engine_data.out'

#compatibility check
try:
	file = open('engine_data.out')
	line_count = 1

except:
	print('file not recognized. please provide a valid CONVERGE output file')

# creating of the empty array to store the value of pressure and volume
pressure = []
volume = []

#pressure and volume in the data file is present in column 2 and 8 respectively
P = 2
V = 8
# getting a null array and storing all data values of the data file into it
data = []

for line in open('engine_data.out'):
	if '#' not in line:
		pressure.append(float(line.split()[P-1]))
		volume.append(float(line.split()[V-1]))

		line_count = line_count + 1

# plotting p_v diagram
plt.plot (volume,pressure,linewidth=3)
plt.xlabel('Volume')
plt.ylabel('Pressure')
plt.title('P-V Diagram')
plt.show()


# inputs
rpm = 1500
rps = 1500/60
stroke_cycle = rps/2
fuel_con = 20
n = 1

# calculation of area under PV diagram
area = np.trapz(pressure,volume)
print('area under the curve = ' +str(area) +'units')

#calculation of power
power_output = n*area*stroke_cycle/(1000)
print('power outut from engine = ' +str(power_output) +'KW')

#calculation  of sfc
sfc = (fuel_con*pow(10,-6)*stroke_cycle*3600)/(power_output*1000)
print('specific fuel consuption, SFC = ' +str(sfc) + '(kg/hr)/(KW)')

print('------------------------------------------------------')

# transposing coulmns nto raw matrix and converting them into float type from string type
transpose = np.transpose(data)
float_f = transpose.astype(np.float)

# array for parameters
parameters = ['crank' , 'pressure' , 'maximum_pressure' , 'minimum_pressure' , 'mean_temperature' , 'maximum_temperature' , 'minimum_temperature' , 'volume' , 'mass' , 'density' , 'intrgrated_HR' , 'HR_rate' , 'Cp' , 'Cv' , 'gamma' , 'kinematic_viscosity' , 'dynamic_viscosity']

# choice two parameters for plotting
print('choose any two from the following options')
print(' 1 crank n 2 pressure n 3 maximum_pressure n 4 minimum_pressure n 5 mean_temperature n 6 maximum_temperature n 7 minimum_temperatue n 8 volume n 9 mass n 10 densisty n 11 integrated_HR n 12 HR_rate n 13 Cp n 14 Cv n 15 gamma n 16 kinematic_viscosity n 17 dynamic_viscosity')

X = int(input('enter your choice on X_axis n'))
Y = int(input('enter your choice on Y_axis n'))

#plotting other gragh based on your choice
plt.figure()
plt.plot(float_f [x-1] , float_f [y-1],linewidth= 3,colour='red')
plt.title('plot for' + parameters [x-1] + 'vs' + parameter[y-1])
plt.xlabel(parameter [x-1] )
plt.ylabel(parameter [y-1] )
plt.savefig(parameter[x-1] + 'vs' + parameter[y-1])
plt.show()
THE OUTPUT GRAPH