Week 3 - Solving second order ODEs
CREATING ANIMATION OF SIMPLE PENDULUM
FOR CRAETING THIS WE NEED TO SOLVE THE SECOND ORDER EQUATION
THAT ID d^2thetha/dt+b/m*dthetha/dt +g/l *sin(thetha)=0
for solveing this let
thetha =thetha1
dthetha/dt=dthetha1/dt=thetha2 let it be the equation 1
d^2thetha/dthetha^2=d^2thetha1/dt^2=d/dt(dthetha/dt)=(d/dt)thetha2 let it be the equation 2
by equating this to in our main equation we get
d^2thetha1/dt^2+b/m(thetha1)/dt + g/l *sin(thetha1)=0
dthetha2/dt+b/m*thetha2+g/l *sin (thetha1)=0
then
dtheth2/dt=-b/m(thetha2)-g/lsin(thetha1)
n the above equation,
g = gravity in m/s2,
L = length of the pendulum in m,
m = mass of the ball in kg,
b=damping coefficient.
with help of this second other solved equation we are creating the coding
as usual we start with
clear all
close all
clc
and we are giving the given values
L=1 metre,
m=1 kg,
b=0.05.
g=9.81 m/s2.
then we creathe the angle of thetha_0 so an array containing 5 value from 0-5 as thetha_0=[0;5];
and as assing the time intervel in the plot and its says in the question that the time interval should me between o-20
and we make its as 500 points in between 0-20 with help odf linspace command as t_span=linspace(0,10,500);
THen we need create an another coding for making our coding simple by making a Function
of ode_fun is creating in which we assing the values of t, thetha ,b,g,l,m we should be carefull about giving all values of t, thetha ,b,g,l,m other wise its shoes the error
then we give two angle thetha1 and thetha 2 and make them array
and we give our solved second order equation in dthetha2_dt as[ dthetha2_dt=-(b/m)*thetha2-(g/l)*sind(thetha1)]
and we make the out put values of dthetha1_dt and thetha2_dt as an 2 cloum metrix by the coding which help to create that array is dthetha_dt=[dthetha1_dt;dthetha2_dt]
THE FUCTION MAKING CODE IS
function [dthetha_dt]= ode_fun(t, thetha ,b,g,l,m)

thetha1=thetha(1)
thetha2=thetha(2)
dthetha1_dt=thetha2
dthetha2_dt=-(b/m)*thetha2-(g/l)*sind(thetha1)
dthetha_dt=[dthetha1_dt;dthetha2_dt]
end
After creating this we will call this fuction to our main program and the value geting from running the code is saved in the array of [t,results]
then we will start for ploting our plot
plot(t,results(:,1)) this plot graph with full values in the 1 row
hold on
plot(t,results(:,2)) this plot graph with full values in the 2 row
ylabel(['plot']) this help to name our graph axis
xlabel('time')
THE CODING FOR MAIN CODING
clear all
close all
clc

b=0.05
g=9.81
l=1
m=0.1


%input condition
 thetha_0=[0;5];

%time points

t_span=linspace(0,10,500);

%solve ODE

[t,results]=ode45(@(t,thetha)ode_fun(t, thetha ,b,g,l,m),t_span,thetha_0);


plot(t,results(:,1))
hold on
plot(t,results(:,2))
ylabel(['plot'])
xlabel('time')
AND THE GRAPH AS PER WE GET IS 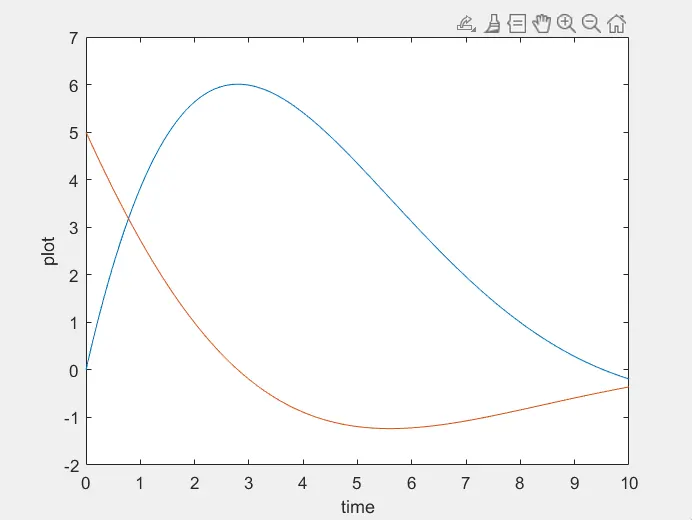
IN THIS WE CAN NOT GET A ANIMATION OF OUR SIMPLE PENDULUM FOR THAT WE NEED SOME ALTERARTION IN OUR CODING AND THEY ARE :
As per to qestion first of all we need to change the thetha_0 value [0;3] because the angular displacement=0,angular velocity=3 rad/sec
then we need to save the value of displacement that get from the [t,reults] first column full as displacement=results(:,1)
and this should asssing after calling the fuction
Then we will start our ploting
at figure 1 we will get as same before we done as
figure(1)
plot(t,results(:,1))
hold on;
plot(t,results(:,2))
ylabel(['plot'])
xlabel('time')
and for creating the animation first of all we need a orgin poiny and we assume the point of x axis and y axis to be(0,0)
then with help of an for loop as
i=1:length(displacement) in this i retruns the largest value in dislpacement
and this value is saved in THETHA1
then we can create the x1 and y1 axis from the eqution is they are
x1=l*sind(THETHA1)
y1=-l*cosd(THETHA1)
then we will start ploting our 2 nd figure
in that we create first the basement and its x axis start from [-0.5,0.5] and the y asix [0,0] this can be chnge according our mentality from this we had created the top portion as it will be the basement of the graph .But when we give the value of x axis it should have equal number value from origin and t need to at center position
then we will plot the (x0,x1)and (y0,y1) this for creating the rod that attached to the basement and (x0,y0)is the origin point
(0,0) and will be the mid point of our basement and the linewidth all need to give as nessecary
then we want to create the the ball or mass present in the bottom of the pendulum rods with help marker command that we had study in video number 9 of stalagmite hw and its size and colour we can give as we needed and this ball need to present at bottom of the rod so we are assinging the axis taht is bottam of rod is(x1,y1) .If we give it as (x0,y0)then the ball will be at the basememt center and the its also one of the top end of the rod
axis([-1.5 1.5 -1.5 0.5]) this helps in ploting graphs size when we had increase value in it our graph will became large as reault our animated pendulum became same and visversa
then when we run the function we will get animated pendulum
then for saving it we can have the help of movie comment
THE CODING FOR THE ANIMATED PENDULUM :-
clear all
close all
clc

l=1;
m=1;
b=0.05;
g=9.81;

%intial condition
thetha_0=[0;3] %Intial angular displacement=0;intial angular velocity=3rad/sec


%time point
t_span=linspace(0,20,500);

%solve ODE
[t,results]=ode45(@(t,thetha)ode_fun(t,thetha,b,g,l,m),t_span,thetha_0);

displacement=results(:,1)

%plotting results

figure(1)
plot(t,results(:,1))
hold on;
plot(t,results(:,2))
ylabel(['plot'])
xlabel('time')


%animation
%intial condition

     x0=0;
     y0=0;
     ct=1
 for i=1:length(displacement)
 THETHA1=displacement(i);
x1=l*sind(THETHA1);
y1=-l*cosd(THETHA1);

figure(2)
plot([-0.5,0.5],[0,0],'-','linewidth',3,'color','b')
hold on
plot([x0,x1],[y0,y1],'linewidth',3,'color','r')
hold on
ylabel(['plot'])
xlabel('time')
plot(x1,y1,'o','MarkerSize',20,'MarkerFaceColor','r')
hold off
axis([-1.5 1.5 -1.5 0.5]);
pause(0.003)
M(ct)=getframe(gcf);
ct=ct+1;
 end

videofile=VideoWriter('annimation_shm.avi','Uncompressed AVI');
open(videofile)
writeVideo(videofile,M)
close(videofile)
THE OUTPUT ANIMATIONS YOUTUBE LINK:-
https://youtu.be/PFFTTfakplU