Week 6 - Data analysis
AIM:
To write a python program which reads the engine output parameter data file and perform the required objectives.
OBJECTIVES:
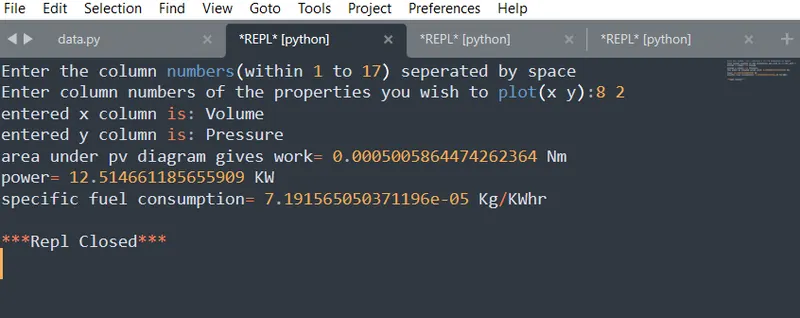
- To calculate the area under the P-V diagram. P is in column 2 and V is in column 8.
- To calculate the power output of this engine. Assuming that the RPM is 1500.
- To calculate its specific fuel consumption.
PROBLEM STATEMENT:
We have to calculate the basic performance calculation engine and plot graph by following the conditions given below:
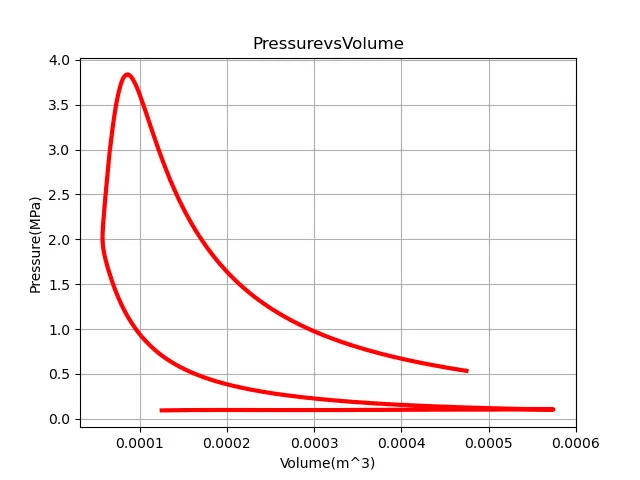
- The code should take column numbers as the input and plot the respective columns as separate images and each file should be saved by the name of the column
- The plot labels should be extracted from the file and the label information should automatically be extracted and must appear as labels in the plots.
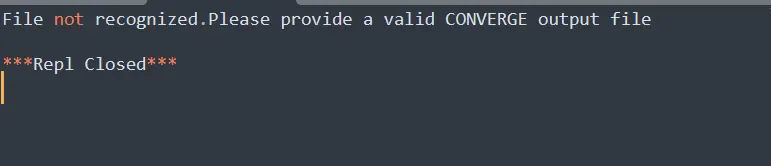
- The code should exit gracefully, if a non-compatible file is provided as an input. It should say "File not recognized. Please provide a valid CONVERGE output file".
SOLUTION PROCEDURE:
- Firstlt, the required modules are imported . Modules like
'matplotlib.pyplot': for ploting graphs
'sys' : for system exit
'numpy' : for array
'simps' : to find area under curve
- Then compatability check is made, that is to check whether the input of specified coverge file is correct or not, if it is correct program will be exicuted else the program will throw a error saying that "File not recognised.Please provide a valid converge output file"
- Then data is visualised , Once the data is read, the code will ask two input i.e. 2 column numbers of the engine parameters to show its characteristics. If the column number exeeds the range the program will not run and i will exit from the code.
- If the correct column numbers of the engine parameter is entered then the code will be successfully be executed.It will read the file , extracts the required parameter name and units, extracts parameter values and store those values and plots the graph between the parameter with their names as labels of the corresponding axis.
- In order to calculate the basic performance of the engine we have to give a of (2 8) as they both refers to the pressure and volume column
- The area under the curve is calculated using 'simps'(simpson rule) and the area under the curve gives the workdone by the engine.
- The obtained area is used to calculate the power output of the engine and the obtained power output is used to calculate the specific fuel consumption.
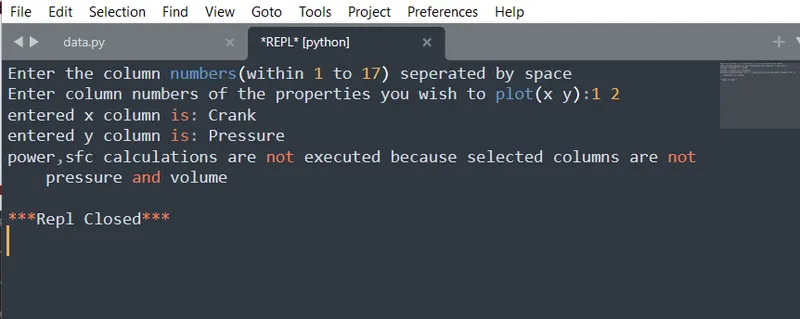
- The code will perform the basic calculation only when the input column values correspond to the volume and pressure respectively.
PYTHON CODE:
#python code for data analysis

#import the required modules
import matplotlib.pyplot as plt
import numpy as np
import math
import sys
from numpy import trapz
from scipy.integrate import simps

#To identify and read the input file
try:
	with open('engine_data.out') as file:
		read_data=file.read()
except:
	print('File not recognized.Please provide a valid CONVERGE output file')
	sys.exit()

#To get column numbers as input
print('Enter the column numbers(within 1 to 17) seperated by space')
x,y=input('Enter column numbers of the properties you wish to plot(x y):').split()

#To convert str into int
xaxis=int(x)
yaxis=int(y)

#To check the input column numbers
if xaxis==0 or xaxis<0 or xaxis>17 or yaxis<0 or yaxis>17 or xaxis==yaxis:
	print('Check the X and Y column number')
	sys.exit()


#To get and store the column names and units
count_num=0

for line in open('engine_data.out'):
	if '#' in line:
		count_num=count_num +1
		if count_num==3:
			column_names=(line.split())
		if count_num==4:
			units=(line.split())

x_name = column_names[xaxis]
y_name = column_names[yaxis]
x_unit = units[xaxis]
y_unit = units[yaxis]
print('entered x column is:',x_name)
print('entered y column is:',y_name)

#To extract data of colums and plot the graph
x_property=[]
y_property=[]

for data in open('engine_data.out'):
	if '#' not in data:
		x_property.append(float(data.split()[xaxis-1]))
		y_property.append(float(data.split()[yaxis-1]))


plt.plot(x_property,y_property,color='red',linewidth='3')
plt.xlabel(x_name + x_unit)
plt.ylabel(y_name + y_unit)
plt.title(y_name+'vs'+x_name)
plt.grid()
plt.savefig(y_name+'  vs  '+x_name)
plt.show()

#To calculate the area under PV graph , Power and specific fuel consumption

if x_name.casefold()=='volume'.casefold() and y_name.casefold()=='pressure'.casefold():

	#area
 	area= simps(y_property,x_property)
 	print('area under pv diagram gives work=',area,'Nm')

 	#power
 	RPM=1500
 	power=area*(RPM/60)*1000
 	print('power=',power,'KW')


 	#specific fuel consumption
 	cycle_sec=(RPM/60)/2
 	number_of_cycle=0.5*number_of_revolution
 	fuel_consumed=20*pow(10,-9)*cycle_sec*3600
 	sfc=fuel_consumed/power
 	print('specific fuel consumption=',sfc,'Kg/KWhr')

else:
	print('power,sfc calculations are not executed because selected columns are not pressure and volume')
OUTPUT:
COMPATIBILITY TEST:
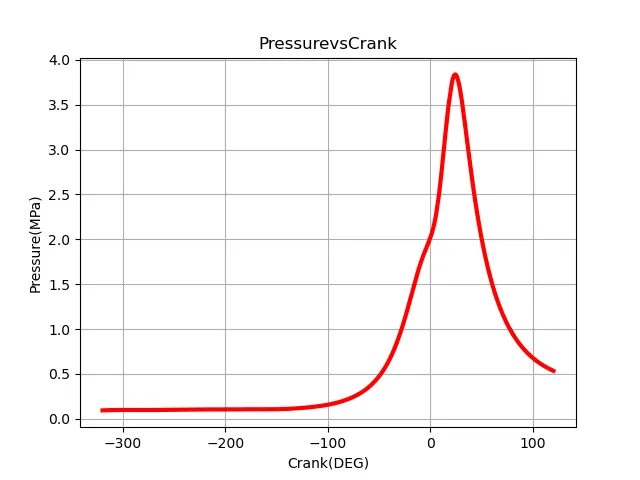
PLOTTING PRESSURE VS CRANK:
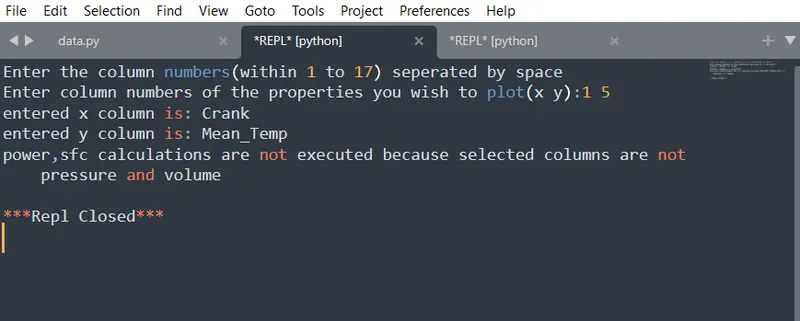
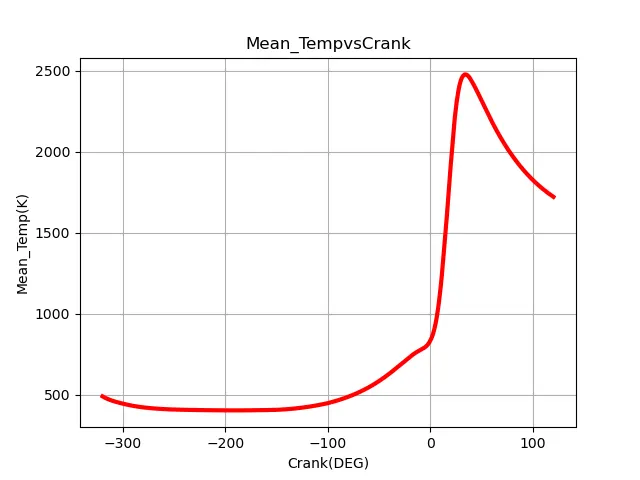
PLOTTING MEAN TEMPERATURE VS CRANK:
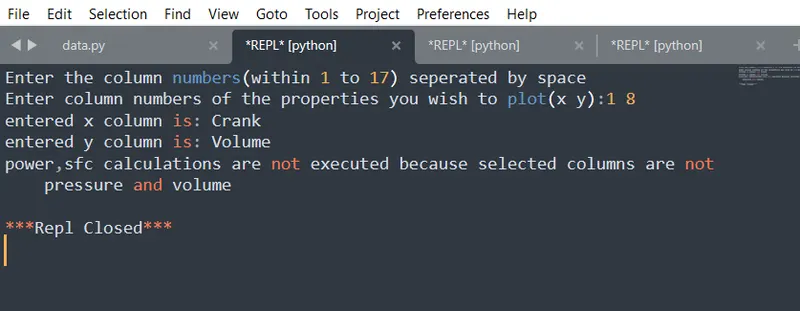
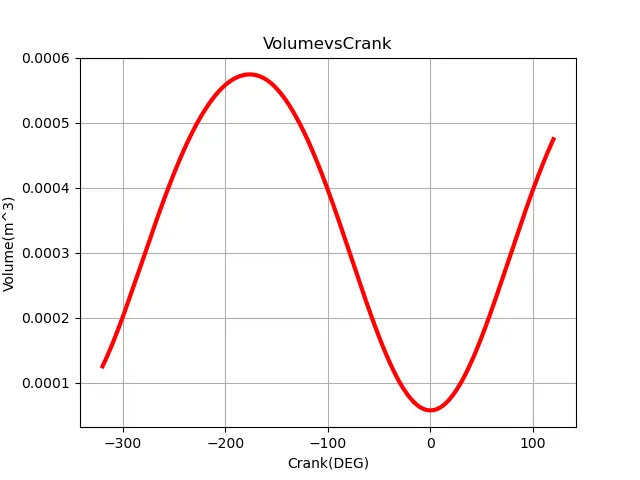
PLOTTING VOLUME VS CRANK:
BASIC PERFORMANCE: