Flow over bicycle using python
OBJECTIVE:
- To calculate drag force for different velocities by keeping the rest parameter constant and to plot the relationship between drag force and velocity.
- To calculate drag force for different coefficient of drag by keeping the rest parameter constant and to plot the relationship between drag force and coefficient of drag.
THEORY :
Drag force is the force that is exerted on a solid body moving with respect to a fluid due to the movement of the fluid. Here we will deal with drag on a bicycle moving in the air. Therefore a drag force is the resistance force caused by the motion of a body through a fluid like air. This drag force acts opposite to the direction of the oncoming flow velocity.
Drag force = 1/2 * ρ">ρρ *Cd *A* V^2
where,
ρ">ρρ = density (Kg/m^3)
Cd =coefficient of drag
A = Frontal area (m^2)
V= velocity of bicycle (m/s)
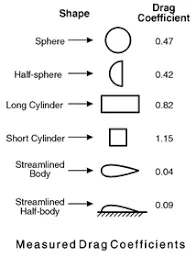
Coefficient of drag for different shapes for same velocity,
PROCEDURE:
STEP 1:
Firstly,We have to import the required modules . Here I have imported math and matplotlib.pyplot.
STEP 2:
Parameters of drag force are defined. In case 1 we have varying velocity and in case 2 we have varying coefficient of drag . We define these values using an array .
STEP 3:
Using for loop we calculate drag force for all the values and we append it.
STEP 4 :
We plot the graph using py.plot() function . Here we call the module as py inoder to execute the plot() function.
PYTHON CODE:
CASE 1: Velocity changes and the rest parameter remains constant and to plot velocity vs drag force
#program to calculate drag force against a cyclist and plot to velocity vs drag force
import math
import matplotlib.pyplot as py

cd=0.8   #drag co-efficient
A= 0.4   #frontal area (m^2)
rho=1.3  #density (kg/m^3)
velocities=[0,10,20,30,40,50,60] #velocity(m/s)
drag_force=[] #drag force (N)

for  velocity in velocities:
	drag_force.append(0.5*rho*A*velocity*velocity*cd)

py.plot(velocities,drag_force)
py.xlabel('velocity')
py.ylabel('drag force')
py.show()
CASE 2: Coefficient of drag changes and the rest parameter remains constant and to plot coefficient of drag vs drag force
#program to calculate drag force against a cyclist and plot to coefficient of drag vs drag force
import math
import matplotlib.pyplot as py

rho=1.3 #density (kg/m^3)
A=0.4   #frontal area (m^2)
V=50    #velocity (m/s)
cd=[0.47,0.42,0.5,1.05,0.8,0.82,1.15,0.04,0.09]
drag_force=[]

for value in cd:
    drag_force.append(0.5*rho*A*V*V*value)

py.plot(cd,drag_force)
py.xlabel('Co-efficient of Drag')
py.ylabel('Drag force')
py.show()
RESULT :
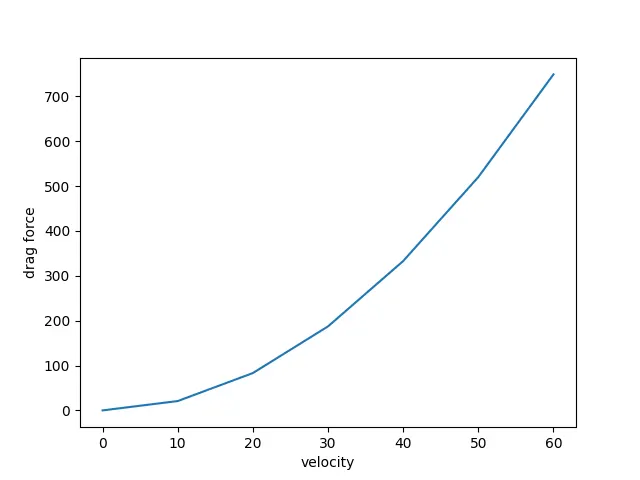
CASE 1: Velocity changes and the rest parameter remains constant and to plot velocity vs drag force
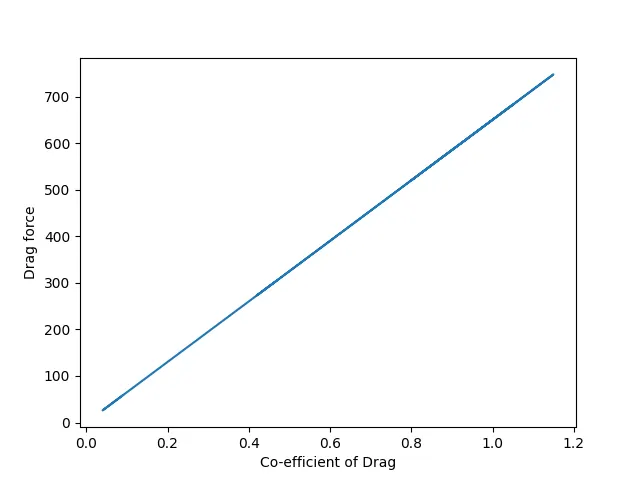
CASE 2: Coefficient of drag changes and the rest parameter remains constant and to plot coefficient of drag vs drag force
OBSERVATION:
- The aerodynamic force depends on the square of the velocity, doubling the velocity will quadruple the drag. Hence the graph is in parabolic in shape in case 1.
- Drag force is directly proportional to the coefficient of drag .Hence we obtain a linear graph in case 2