Data analysis - Python
OBJECTIVES
Write a python code that does the following:
- Compatablity check
- Data Visualizer showing the column numbers and parameters
- Calculations of Work done(area under the p-v diagram), Power output and specific fuel consumption
SOLUTION PROCEDURE
We have the 'engine_data.out' file containing many engine parameters including pressure,temperature,volume etc.
- First thing we need to do is, read the file by file parsing in python and sort the parameters.
- Create a conditional statement at the starting of the program inorder to do the compatability check.
- Write python code to visualize the column numbers and the engine parameters with its units.
- Give option for user input to plot the graphs.
- Do all the calculations
THEORY
File Parsing
One of the most common tasks in research is analyzing data. Many computational chemistry programs output text files that include a large amount of information including text and data that you need to analyze. Often, you need to sort through the output file and identify particular pieces of information that are most important to you. In general, this is called file parsing. To parse data or information means to break it down into component parts so that its syntax can be analyzed, categorized, and understood.
In order to parse a file, you must tell Python the location of the file. We can read or write to a file with help of open() command. Inside the brackets we should define the name of the file.
Calculations
- In this program we multiply the pressure values with 1000000. This is used to convert MPa to Pa
We know that,
RPM = 1500
Fuel consumption per stroke = 20 μg = `20xx10^-6` g
Power Output of the engine = `2pi`*RPM*Work done/60
Here the work done is the area under the P-V diagram.
Specific Fuel Consumption = fuel consumption perstroke*rpm*60/Power Output of the engine
PYTHON CODE
"""
Data analysis - Engine
"""

import matplotlib.pyplot as plt
import numpy as np
import math

# input function
a=input('Enter file name:')

# Decision making by conditional statements

if a == 'engine_data.out':

	print('File recognized')

	# initializing data array
	data = []

	for line in open('engine_data.out'):
		data.append(line.split())

	# number of columns
	n_c=len(data[1])

	# column numbers
	cn = []

	# column names
	cnames = []

	# column units
	cu = []

	# finding index of first column in the file
	fc=data[1].index('column')

	# cn
	for i in range(fc,n_c-1):
		cn.append(i)

	# cnames
	for i in data[2]:
		if '#' not in i:
			cnames.append(i)

	# cu
	for i in data[3]:
		if '#' not in i:
			cu.append(i)

	print('                                                        ')
	print('-----------------------DATAS----------------------------')
	print('                                                        ')

	# Creating Data table containing Column numbers and Parameters
	print('Column Numbers - Parameters')

	for i in range(0,17):
		print('      ',cn[i],'         ',cnames[i],'  ',cu[i])

	print('--------------------------------------------------------')

	xaxis = int(input('Enter x-axis column number:'))
	yaxis = int(input('Enter y-axis column number:'))

	# correction inorder to get the right value
	xaxis=xaxis-1
	yaxis=yaxis-1

	# initializing x&y arrays
	x = []
	y = []

	for line in open('engine_data.out'):
		if '#' not in line:
			x.append(float(line.split()[xaxis]))
			y.append(float(line.split()[yaxis]))

	# plotting
	plt.plot(x,y)
	plt.xlabel(cnames[xaxis])
	plt.ylabel(cnames[yaxis])
	plt.title(cnames[yaxis]+'-'+cnames[xaxis]+' '+'Graph')
	plt.show()

	print('-----------------------CALCULATIONS----------------------------')

	# Performance calculation

	# initializing arrays for pressure and volume
	pressure = []
	volume = []

	for line in open('engine_data.out'):
		if '#' not in line:
			pressure.append(float(line.split()[1]))
			volume.append(float(line.split()[7]))

	# 1.Area Under the curve = Work done
	P = 1000000*np.array(pressure)
	V = np.array(volume)
	area = np.trapz(P,V)
	print('Area under the P-V diagram (Work done) =',area,'J')

	# 2.Calculating power
	work_done=area
	rpm = 1500
	power = (2*math.pi*rpm*work_done)/60
	print('Power output =',power,'KW')

	# 3.specific fuel consumption (sfc)
	fuel_consumption_per_stroke = 20e-06
	fuel_consumption_per_hour = fuel_consumption_per_stroke*rpm*60
	sfc = fuel_consumption_per_hour/power
	print('Specific fuel consumption =',sfc,'g/KW.hr')
	print('--------------------------------------------------------')

else:
	print('File not recognized. Please provide a valid CONVERGE output file')
EXPLANATION OF CODES
- The code starts with importing modules such as math,numpy and matplotlib.pyplot
- input() - The input() function allows a user to insert a value into a program. input() returns a string value. You can convert the contents of an input using any data type. For instance, you can convert the value a user inserts to a floating-point number.
- From line number 14 we introduce the decision making by using conditional statements(if and else).
- print('File recognized') - If the condition satisfies it displays 'File recognized'.
- print() - The print() function prints the specified message to the screen
- line number 18 to 22 - Then we append all the details from the file to data array.
- line number 24 to 51 - Finding number of columns by using len() function and Initializing and assigning values to column numbers,names and units arrays.
- len() - The len() function returns the number of items in an array.
- index() - The index() method returns the position at the first occurrence of the specified value.
- range() - The range() function returns a sequence of numbers, starting from 0 by default, and increments by 1 (by default), and stops before a specified number.
- append() - The append() method in python adds a single item to the existing list.
- line number 60 to 63 - Defining the column numbers and corresponding engine parameters as table.
- int() - The int() function converts the specified value into an integer number. In the line number 65 and 66 the int() command is used to convert string value to interger. Because input() commands returns a string value. String value cannot be used in arithematic operations. In the 69th & 70th line we did an arithematic operation. So we use int() function here.
- xaxis=xaxis-1
yaxis=yaxis-1
We use this inorder get the correct values. Because when we try to plot crank and pressure we should give the colum number as 1 & 2. But actually it locates in 0 and 1 in the column names array. So in order to get the correct values we should update the variable as(xaxis and yaxis) as xaxis-1 and yaxis-1.
- Then we initialize x and y array which contains the updated xaxis and yaxis values.
- float() - The Python float() method converts a number stored in a string or integer into a floating point number.
- split() - The Python split() method divides a string into a list. Values in the resultant list are separated based on a separator character. The separator is a whitespace by default. Common separators include white space and commas
- line number 82 to 86 - Starts plotting commands.
- plot() - The plot() function is used to draw points (markers) in a diagram. By default, the plot() function draws a line from point to point.
- line number 93 to 117 - Basic performance calculations.
- np.trapz() - The np.trapz() function Integrate along the given axis using the composite trapezoidal rule. Here we use this function calculate the area under the P-V diagram.
- line number 121 to 122 - The rest of the conditional statement is defined in these two lines. The else keyword catches anything which isn't caught by the preceding conditions. Here if the name of the file that we entering is not correct the program goes through these two lines and displays 'File not recognized. Please provide a valid CONVERGE output file'. Because in line number 122 print command is used and it helps to display the text.
RESULTS
- Compatability Check
When we enter the name of the file correctly,

When we enter a wrong name,

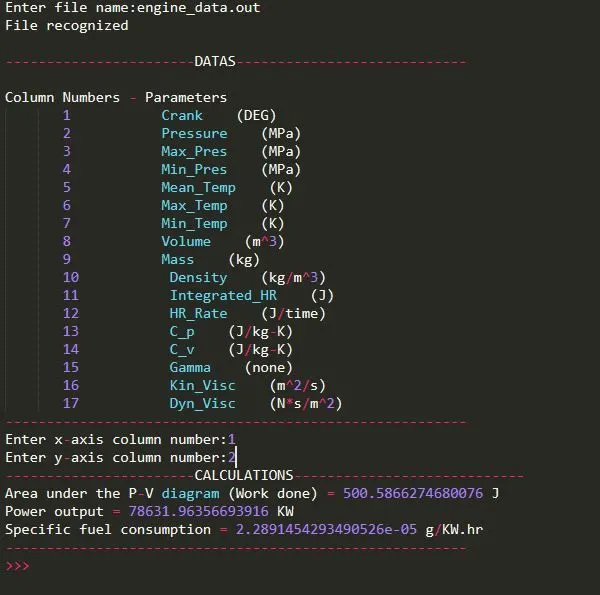
- Overall result of the program including data visualizer and performance calculation
- Pressure Volume graph
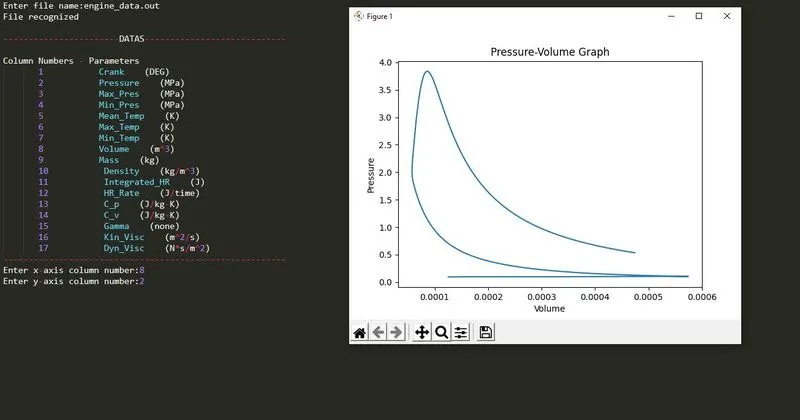
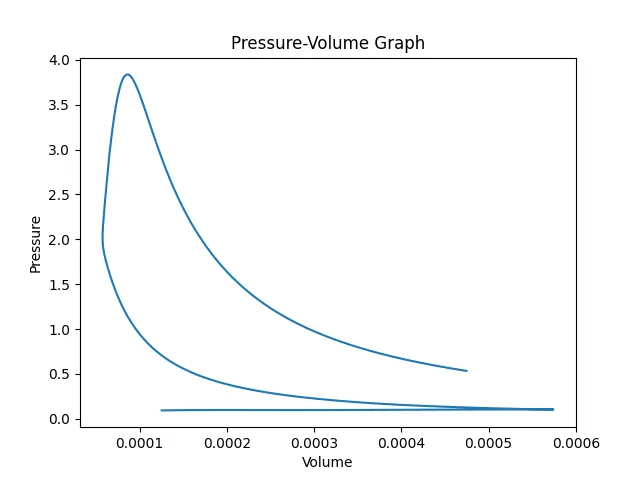
We get the calculation results as,
Area under the P-V diagram (Work done) = 500.5866274680076 J
Power output = 78631.96356693916 KW
Specific fuel consumption = 2.2891454293490526e-05 g/KW.hr
CONCLUSION
This program helps to plot any graph using the listed parameters and gives the values of workdone, power output and specific fuel consumption of the engine.