Week 6 - Data analysis
Aim: To write a python script to analyse the data available in the given file .
Objectives:
- Check the compatibility of the file
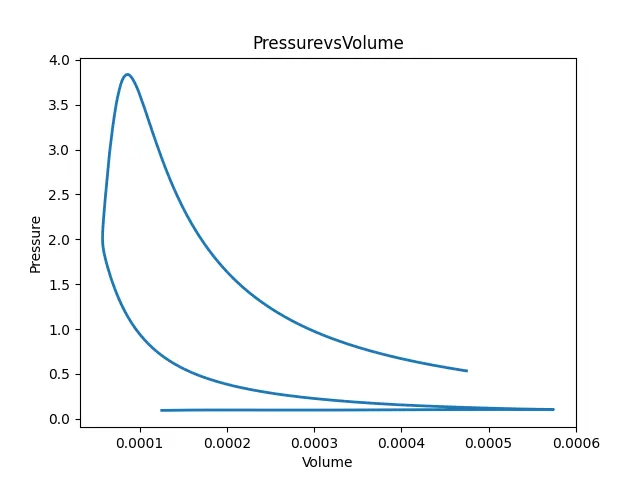
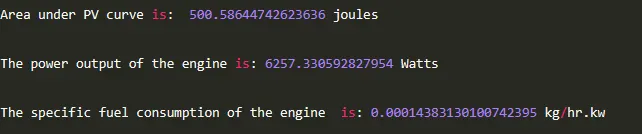
- Calculate the area under the P-V diagram.
- Calculate the power output of this engine assuming that RPM is 1500
- Calculate its specific fuel consumption.
Theory:
Data analysis can be simply defined as the process of collecting, modeling, and analyzing data to extract insights that support
decision-making.
In the engineering domain,data analysis is becoming more and more important.
In this project,the given data file named engine_data.out is a simulation report obtained by analysing an engine.
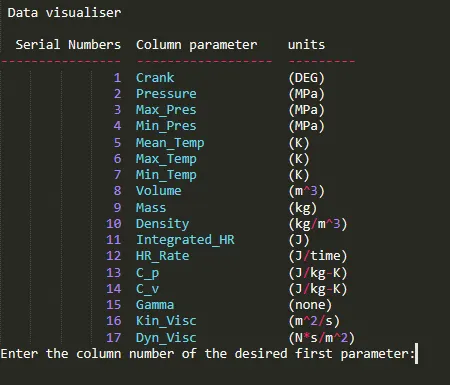
It contains 17 parameters such as density,kinematic viscosity,dynamic voscosity,pressure,volume,..
Our objective is to write a python script that will visualize the data contained in the concerned file,to check its compatibility an and calculate its basic performance (Area under PV curve,power output and specific fuel consumption)
Coding section:
'''
Data analysis challenge with python language
'''


#Importing important modules

import math
import matplotlib.pyplot as plt
import numpy as np
from tabulate import tabulate
from scipy.integrate import simps
#from numpy import trapz

print('Ensure to save the file  is in the same path directory as your code')
f_name=input('Enter the converge file name with .out extension:')
#Checking the compatibility

try:
	content=open(f_name)
	print('\nData is successfully opened')

except FileNotFoundError:
	print("\nPlease,enter a valid file name.The file name you entered is not recognised\n")
	#Data visualization

titles=[]
for l in content:
	if '#'in l:
		titles.append(l.split())
	#Compatibility check

if 'CONVERGE' in (titles[0]):
	print('Compatbiity check is successful')
else:

		print('Compatbiity check is unsuccessful')
		exit()

Se_num=[]
for s in titles[1]:
	if '#' not in s:
		if  'column' not  in s:
			Se_num.append(s)
			#print(S_num)

par=[]
for p in titles[2]:
	if '#'not in  p:
		par.append(p)
		#print(par)

units=[]
for k in titles[3]:
	if '#' not in k:
		units.append(k)

#Tabulating table of serial numbers,parameters and units

print('\n Data visualiser\n')
Headers=['Serial Numbers','Column parameter','units']
Data=tuple(zip(Se_num,par,units))
print(tabulate(Data,Headers))


a=int(input('Enter the column number of the desired first parameter:'))
b=int(input('Enter the column number of the desired second parameter:'))
	#Auromatic generation of labels of plots
x_label=par[a-1]
y_label=par[b-1]

	#Storing required values of plots

val_1=[]
val_2=[]


	#Computing the work done  by the engine from the P_V curve
Pressure=[]
volume=[]

for l in open(f_name):
	if '#' not in l:

		val_1.append(float(l.split()[a-1]))
		val_2.append(float(l.split()[b-1]))
		Pressure.append(float(l.split()[1]))
		volume.append(float(l.split()[7]))
Rpm=float(input('Enter the rpm of the engine:'))
f=float(input('Enter the value of fuel consumed per cycle in micrograms:'))
#Number of cycles per second for a 4 stroke engine
n=Rpm/(2*60)

#Converting Pressure into pascal
P=1000000*np.array(Pressure)
V=np.array(volume)
#Calculating the area under PV curvem in Joules

#A= np.trapz(P,V)
A=simps(P,V)
print('\nArea under PV curve is: ',A,'joules\n')

#Computing the power output of the engine
Power=A*n
print('\nThe power output of the engine is:', Power,'Watts\n')

#Calculating the specific fuel consumption
fc=(f*n*3600)/pow(10,9) #in kg/hr
sfc=(fc*1000)/Power#in kg/hr.kw
print('\nThe specific fuel consumption of the engine  is:',sfc,'kg/hr.kw\n')

#Plotting section
#Plotting graph of parameters corresponding to the entered inputs a and b
plt.plot(val_1,val_2,linewidth=2)
#Customizing the axes labels
plt.xlabel(x_label)
plt.ylabel(y_label)
#Titling the graphs
plt.title(y_label +'vs' +x_label)
#Displaying the graph
plt.show()
Explanation of the code:
- First of all the required modules are imported:Firstly "math","matplotlib" and "numpy" modules are imported to respectively perform mathematical operations ,allow plotting tasks and to perform operations on arrays.Secondly "tabulate" and "simps" libraries are imported to respectively print tabular data in nicely formatted tables and numerically integrate pressure and volume values.
- Then, "try and except" syntax is used to check the compatibility of the file when the user enters its name.
- For data visualization, Se_num(serial numbers),par(column parameters) and units are firstly defined empty arrays and are later appended using proper for loops.
- After ,the data visualization table(containing serial numbers,parameters and units)is printed uning tabulate function.
Output:
- Compatibitlity check:

- Data visualization:
- Engine performance:
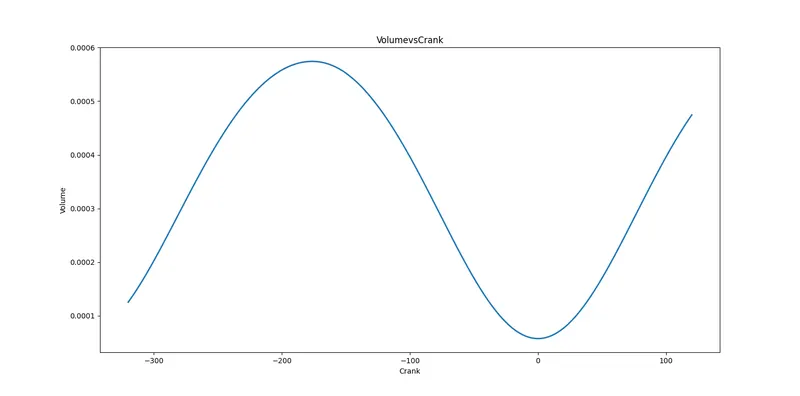
- Crank angle vs Volume graph
- Pressure vs volume graph: