Week 6 - Data analysis
WEEK - 6 DATA ANALYSIS
The entire code is written from the basic and step wise, go through it and you will know the logic behind it .
import math
import matplotlib.pyplot as plt
import numpy as np
from scipy.integrate import simps
from tabulate import tabulate

# Code for extracting the filename and matching it with the mentioned filename

inputfile =(input('enter the filename  : '))
if inputfile == 'engine_data.out' :
    print(' file found successfully')
    print('Doing its compatibility check')


else :
     print('File not rrecognised . Please provide a valid CONVERGE output file ')
     exit()


titles = []  # Creating an empty array of titles in which there are in total 5 index
j = 1


inputfile = open('engine_data.out' )
for i in inputfile :
	if j == 5:  # As the the value j  = 5 then the # mark will end in the file n loop breaks to perform the function .
		break
	if '#' in i :
		titles.append(i.split( ))
	j = j + 1

if 'CONVERGE' in (titles[0]) :  # if converge is there in index1 of array title
	print('Compatibility check successful')
	print('reading the file')

else :
	print('File not rrecognised . Please provide a valid CONVERGE output file ')

# now creating the following arrays  so that a table can be structred .

column_no  = []

for i in (titles[1]) :
	if '#' not in i :
		if 'column' not in i :
			column_no.append(i)

parameters = []

for i in (titles[2]):
	if '#' not in i :
		parameters.append(i)

units = []


for i in (titles[3]) :
	if '#' not in i :
		units.append(i)


header = ['Columns' , 'Parameters' , 'units']
data = tuple(zip(column_no, parameters , units ))
print(tabulate(data , header))

# these are the inputs ..

x =1
while x == 1 :


    a = int(input('type the column no of the parameters no 1: '))
    b= int(input('type the column no of the parameters no 2 :'))


    label_1 = parameters[a-1]  # here a - 1 is given in index because in python coloumn starts from 0  .
    label_2 = parameters[b-1]

    value_1 = []
    value_2 = []
    pressure = []
    volume = []


    for i  in inputfile :


            if '#' not in i :
                    value_1.append(float(i.split()[a-1]))
                    value_2.append(float(i.split()[b-1]))
                    pressure.append(float(i.split()[1]))
                    volume.append(float(i.split()[7]))


    # now area is being calculated  under the curve by simps command


    area = simps(pressure,volume)
    print('area under pv curve :' +str(area))
    print('work done by engine :'+ str(area*1E6))


    rpm = int(input('enter the rpm : '))


    rps = rpm/60
    a = rps/2
    power = (20)*(a/1000)
    print('power output of engine : ' + str(power))


    r  = int(input('enter the value of fuel in microgram : '))

    r  = 5
    sfc = r/power
    sfc = sfc*3.6
    print('the value of sfc is : ' + str(sfc))

    # Plotting the function

    plt.plot(value_1 , value_2, linewidth =3)
    plt.xlabel(label_2)
    plt.ylabel(label_1)
    plt.title(label_1 + " vs " + label_2)
    plt.grid()
    plt.savefig(label_1 + " vs " + label_2)
    plt.show()


# Now to exit gracefully :
    x = int(input( 'press 1 to continue or 0 to end :  ' ))
The following are the outputs :
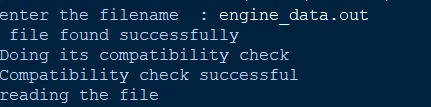
1) the compatability check .
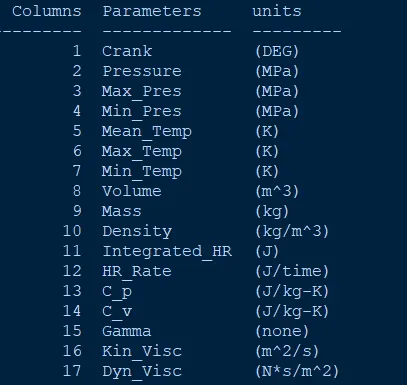
2) The proper structured table .
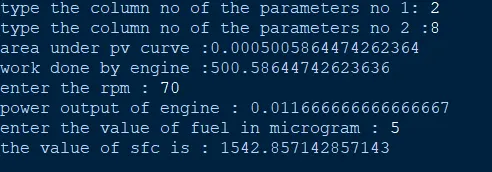
3) The following are the inputs which are given by the user .
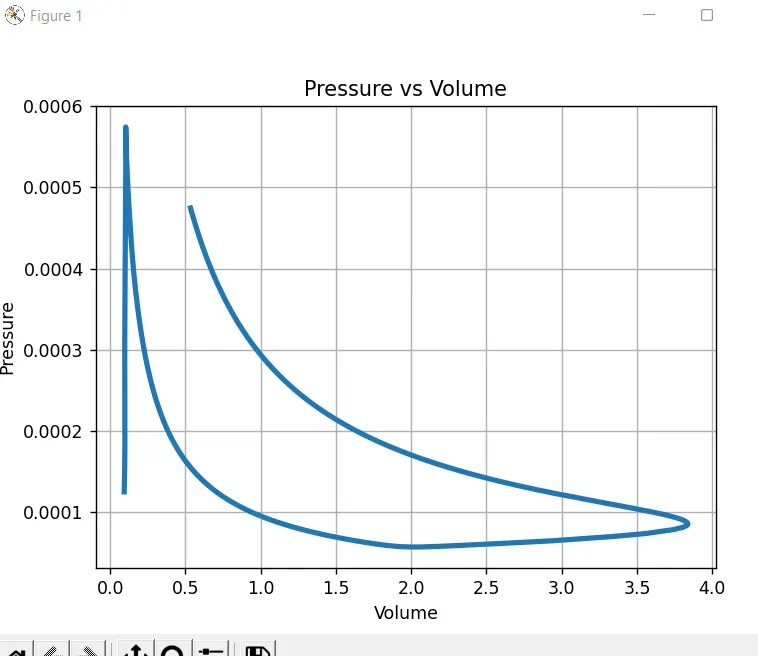
4) the plot :
Thats all .
Thankyou .....