Week 6 - Data analysis
DATA ANALYSIS
OBJECTIVE
- To create a Data visualizer for given data file using python.
- Compatability check
- Basic performance calculation
PROBLEM STATEMENT
Data Analysis is the process of systematically applying statistical and/or logical techniques to describe and illustrate, condense and recap, and evaluate data.
Here a huge collection of different data is given. This is the output parameters from an IC engine simulation.
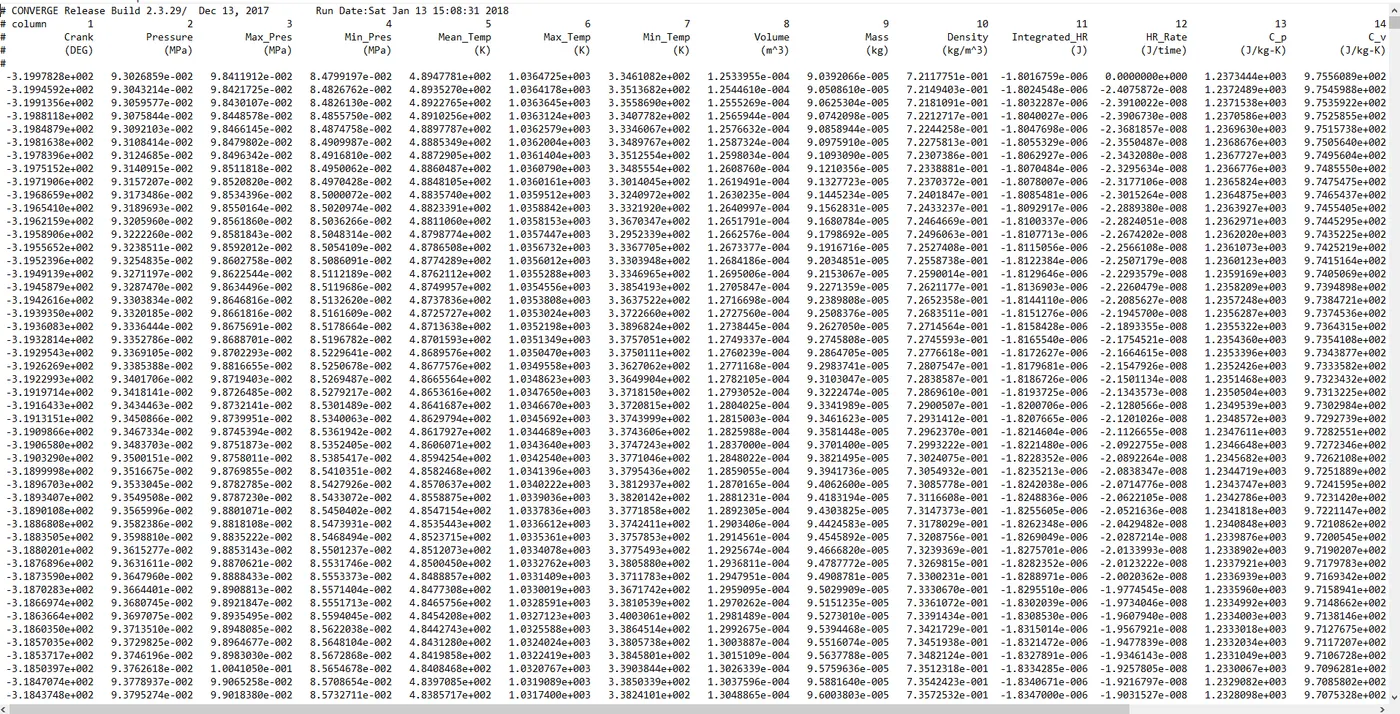
Here we want to perform efficient data analysis.
Note: Iam including all of the objective in one code set.
SOLUTION PROCEDURE
#Data analysis
"""
1.Engine Out put -Data analysis
by ABIN K J
"""

import matplotlib.pyplot as plt
import numpy as np
import math


print("General Instruction")

print("Please Make Sure that the CONVERGE data file is saved in the same path directory where Python code is saved")


#Compatibility Check

file_name = input('Enter the CONVERGE file having out Extension = ')

if file_name=='engine_data.out':

        print('\nData file is succesfully opened.')

else:

	print('\nPlease Enter a valid filename.\n')

#Empty array of inputs
crank = []
Pressure=[]
Max_Pres=[]
Min_Pres=[]
Mean_Temp=[]
Max_Temp=[]
Min_Temp=[]
Volume=[]
Mass=[]
Density=[]
Integrated_HR=[]
HR_Rate=[]
C_p=[]
C_v=[]
Gamma=[]
Kin_Visc=[]
Dyn_Visc=[]
linecount=1
label=[]
unit=[]

for line in open(file_name,'r'):
	if '#' in line:
		if linecount==3:
			for j in range(1,18):
				label.append(line.split()[j])


	if '#' in line:
		if linecount==4:
			for k in range(1,18):
				unit.append(line.split()[k])


		linecount=linecount+1
	if '#' not in line:
	    crank.append(float(line.split()[0]))
	    Pressure.append(float(line.split()[1]))
	    Max_Pres.append(float(line.split()[2]))
	    Min_Pres.append(float(line.split()[3]))
	    Mean_Temp.append(float(line.split()[4]))
	    Max_Temp.append(float(line.split()[5]))
	    Min_Temp.append(float(line.split()[6]))
	    Volume.append(float(line.split()[7]))
	    Mass.append(float(line.split()[8]))
	    Density.append(float(line.split()[9]))
	    Integrated_HR.append(float(line.split()[10]))
	    HR_Rate.append(float(line.split()[11]))
	    C_p.append(float(line.split()[12]))
	    C_v.append(float(line.split()[13]))
	    Gamma.append(float(line.split()[14]))
	    Kin_Visc.append(float(line.split()[15]))
	    Dyn_Visc.append(float(line.split()[16]))

Inp=np.array([crank,Pressure,Max_Pres,Min_Pres,Mean_Temp,Max_Temp,Min_Temp,Volume,Mass,Density,Integrated_HR,HR_Rate,C_p,C_v,Gamma,Kin_Visc,Dyn_Visc])

x = int(input ("Enter X-axis Parameter : "))
y = int(input("Enter Y-axis Parameter: "))


fig_name=(str(label[x])+ '  vs  ' + str(label[y]))
plt.figure()
plt.plot(Inp[x],Inp[y])
plt.xlabel(str(label[x]) + str(unit[x]))
plt.ylabel(str(label[y]) + str(unit[y]))
plt.title(fig_name)
plt.savefig(fig_name)
plt.show()


#Basic performance calculation - power out put

if x==7 and y==1 or x==1 and y==7:

    RPM =1500
    Area= np.trapz(Inp[x],Inp[y])
    Workdone=Area*1000
    Power = 2*math.pi*RPM*Workdone/60
    Fuel_per_Stroke =20*1e-6
    Fuel_per_Sec =Fuel_per_Stroke*RPM*(0.5/60)
    Fuel_per_Hour= Fuel_per_Sec*3600
    BSFC =Fuel_per_Hour/Power

    print('Area under the P-V diagram (Workdone):', Workdone, 'KJ')
    print('Power Output of this Engine : ',Power, 'KW')
    print('Specific Fuel Consumption:',BSFC, 'g/KWh')
Code Explanations
import matplotlib.pyplot as plt : Matplotlib.pyplot is python module to plot graphs. So, here matplotlib.pyplot imported as 'plt'
import numpy as np : Importing numpy module to doing numerical calculations.
import math : Importing math module for doing mathematical calculations.
print("General Instruction") : Printing some general informations.
print("Please Make Sure that the CONVERGE data file is saved in the same path directory where Python code is saved") : Printing some general informations.
file_name = input('Enter the CONVERGE file having out Extension = ') : Receiving file name from user.
if file_name=='engine_data.out': : Condition for checking the file.
print('\nData file is succesfully opened.') : Print command if the file matches.
else: : Else condition for mismatch file.
print('\nPlease Enter a valid filename.\n') : Print command foe file mimatch.
#Empty array of inputs : Creating empthy array for each parameters.
for line in open(file_name,'r'): : For loop opens the file and read it through lines.
if '#' in line: : Conditions for labels
if linecount==3: : Label contains in 3rd line
for j in range(1,18): : Creating another for loop for entire labels.
label.append(line.split()[j]) : Splitting the lines and stores in label array.
if '#' in line: : Conditions for units
if linecount==4: : Units contains in 4th line
for k in range(1,18): : Creating another for loop for entire units.
unit.append(line.split()[k]) : Splitting the lines and stores in unit array.
linecount=linecount+1 : Updating line count.
if '#' not in line: : Splitting each othe lines which doesnt have "#" and it is splitted , stored in respective arrays. It is done for all parameters in next following lines.
Inp=np.array([crank,Pressure,
x = int(input ("Enter X-axis Parameter : ")) : Receiving the index value of input parameter from user.
y = int(input("Enter Y-axis Parameter: ")) : Receiving the index value of input parameter from user.
fig_name=(str(label[x])+ ' vs ' + str(label[y])) : Creating code for plotting figure based on given inputs.
plt.figure() : Command for plotting figure.
plt.plot(Inp[x],Inp[y]) : Plotting the graph based on the input parameter.
plt.xlabel(str(label[x]) + str(unit[x])) : Code for label the graph x axis.
plt.ylabel(str(label[y]) + str(unit[y])) : Code for label the graph y axis.
plt.title(fig_name) : Code for the title, which is fig_name
plt.savefig(fig_name) : Saving the plot using the fig_name.
plt.show() : Code for showing the plot.
if x==7 and y==1 or x==1 and y==7: : Condition for engine power calculation based on pressure and volume and some technical formulas created later.
print('Area under the P-V diagram (Workdone):', Workdone, 'KJ') : Print command for printing the workdone.
print('Power Output of this Engine : ',Power, 'KW') : Printing the power output.
print('Specific Fuel Consumption:',BSFC, 'g/KWh') : Printing the fuel consumption.
RESULTS
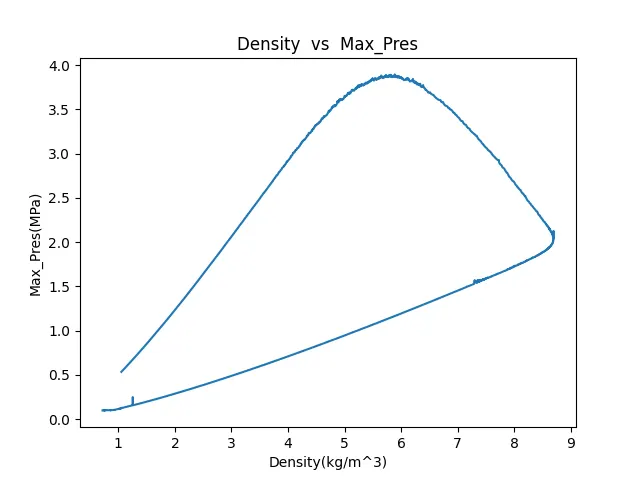
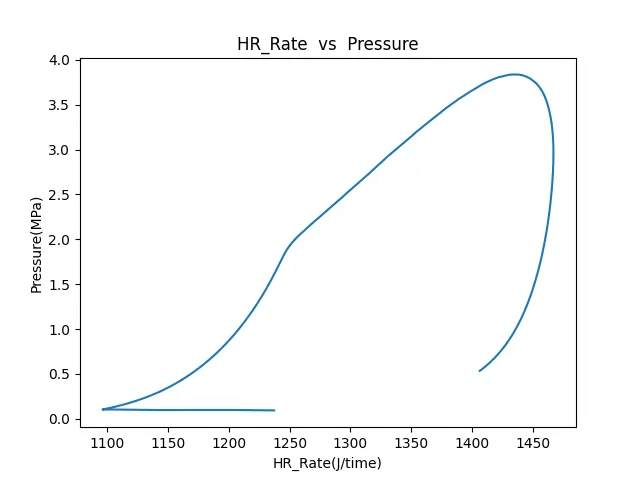
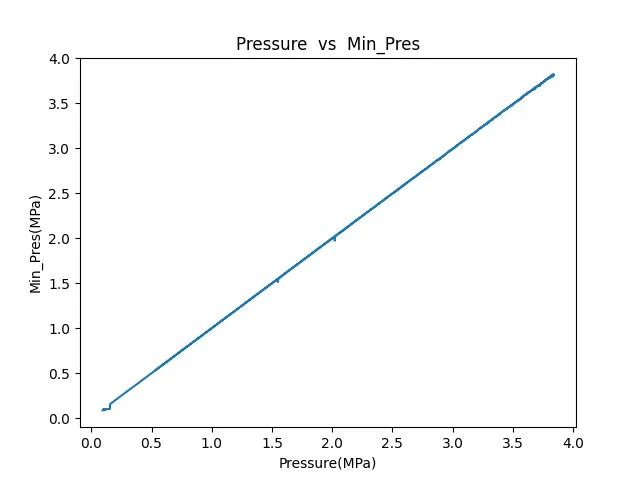
Here is some plots which plotted by using this code,
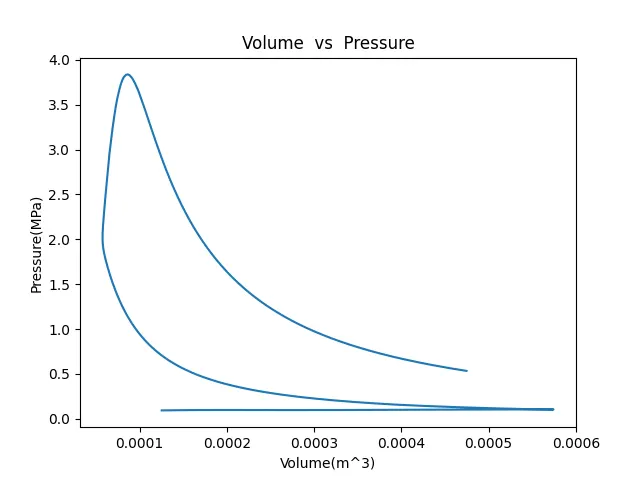
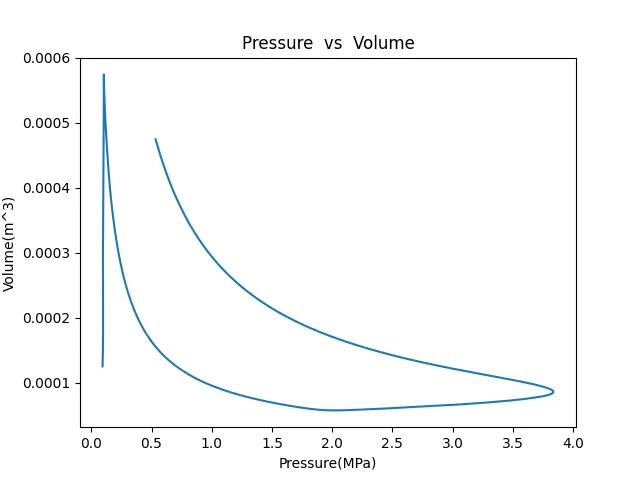
Basic performance calculation - power out put
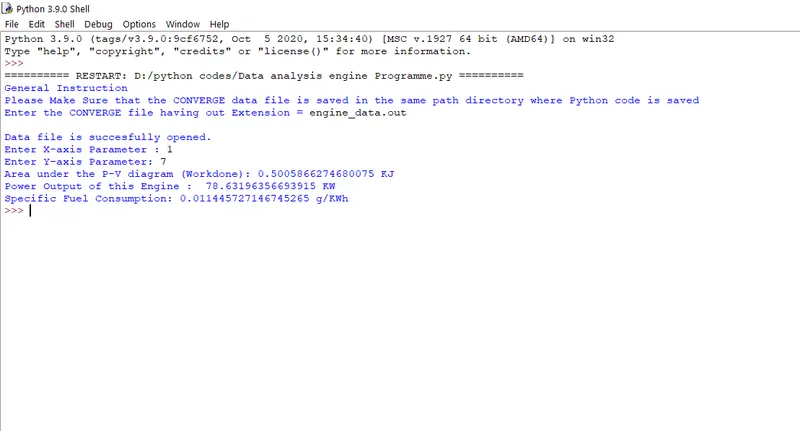
P V plot of the engine
EXPLANATION OF RESULTS
Here the code ran successfully on IDLE.
Based on the Input data parameters given by the user, the programm has executed and it makes plots and calculations accordingly.