Week 5 - Curve fitting
CURVE FITTING
1.What does popt and pcov mean?
popt is an array with the parameters obtained using a non-linear least squaresfit.
pcov is an another array with the estimated covariance of the parameters in popt.
2.What does np.array(temperature) do?
Numpy function creates an array for the temperature values ,and it is passed through code for further calculations.
3.What does the * in *popt mean?
The star here means that it is being referenced. Any and all change which could have occure to popt while in a function would be reflected in the original popt.
5.What needs to be done in order to make the curve fit perfect?
A curve fit can be almost perfect , but not 100% perfect.
There are several methods for that,
- By trying different order equations
- Spliting the data and curve fitting them seperately
- Also it can be find by mathematical approach.
CURVE FITTING Linear function.
"""
1.Curve fit function - linear
by ABIN K J
"""
import numpy as np
import matplotlib.pyplot as plt
from scipy.optimize import curve_fit


#Curve fit function
def func(t,a,b):
	return a*t+b

#readimg thermodynamic datafile
def read_file():
	temperature =[]
	cp =[]
	for line in open ('data','r'):
		values =line.split(',')
		temperature.append(float(values[0]))
		cp.append(float(values[1]))

	return [temperature,cp]


#main program
temperature, cp= read_file()
popt, pcov = curve_fit(func, temperature, cp)
fit_cp = func(np.array(temperature), *popt)


plt.plot (temperature, cp,, Linewidth=3)
plt.plot(temperature, fit_cp,color="red", Linewidth=3)
plt.legend (['Actual data', 'Curve fit'])
plt.xlabel('Temperature [K]')
plt.ylabel('Cp')
plt.show()
CURVE FITTING Quadratic function.
"""
2.Curve fit function - Quadratic
by ABIN K J
"""
import numpy as np
import matplotlib.pyplot as plt
from scipy.optimize import curve_fit


#Curve fit function
def func(t,a,b,c):
	return a*pow(t,2)+b*t+c

#readimg thermodynamic datafile
def read_file():
	temperature =[]
	cp =[]
	for line in open ('data','r'):
		values =line.split(',')
		temperature.append(float(values[0]))
		cp.append(float(values[1]))

	return [temperature,cp]


#main program
temperature, cp= read_file()
popt, pcov = curve_fit(func, temperature, cp)
fit_cp = func(np.array(temperature), *popt)


plt.plot (temperature, cp,, Linewidth=3)
plt.plot(temperature, fit_cp,color="red", Linewidth=3)
plt.legend (['Actual data', 'Curve fit'])
plt.xlabel('Temperature [K]')
plt.ylabel('Cp')
plt.show()
CURVE FITTING Cubic function.
"""
3.Curve fit function - cubic
by ABIN K J
"""
import numpy as np
import matplotlib.pyplot as plt
from scipy.optimize import curve_fit


#Curve fit function
def func(t,a,b,c,d):
	return a*pow(t,3)+b*pow(t,2)+c*t+d

#readimg thermodynamic datafile
def read_file():
	temperature =[]
	cp =[]
	for line in open ('data','r'):
		values =line.split(',')
		temperature.append(float(values[0]))
		cp.append(float(values[1]))

	return [temperature,cp]


#main program
temperature, cp= read_file()
popt, pcov = curve_fit(func, temperature, cp)
fit_cp = func(np.array(temperature), *popt)


plt.plot (temperature, cp,, Linewidth=3)
plt.plot(temperature, fit_cp,color="red", Linewidth=3)
plt.legend (['Actual data', 'Curve fit'])
plt.xlabel('Temperature [K]')
plt.ylabel('Cp')
plt.show()
RESULTS
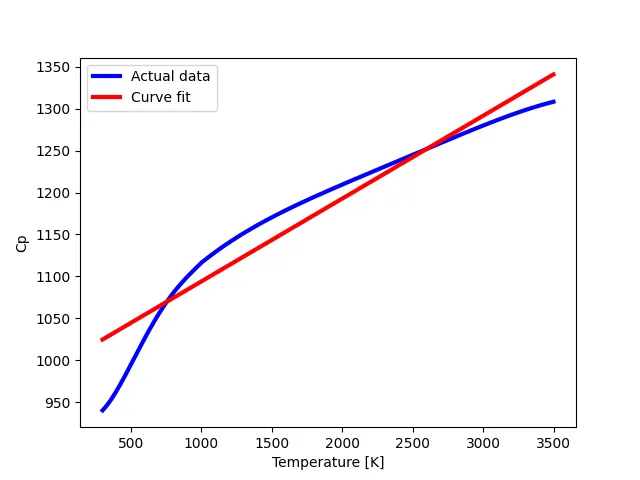
1.CURVE FITTING Linear function.
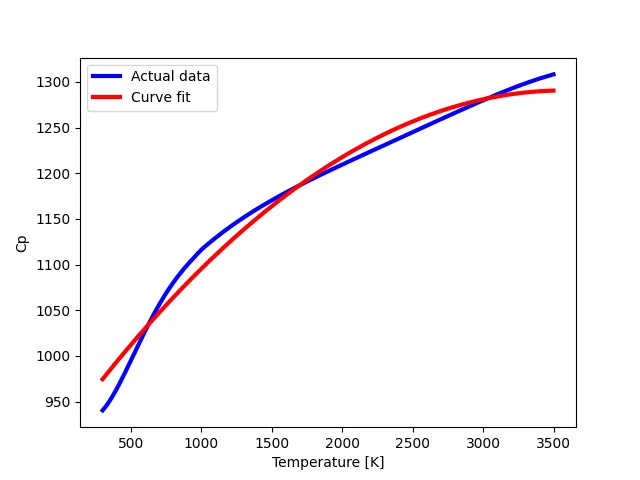
2.CURVE FITTING Quadratic function.
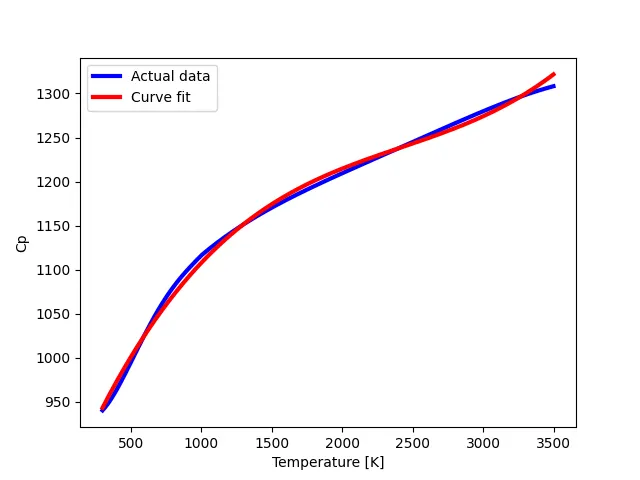
3.CURVE FITTING Cubic function.
EXPLANATION OF RESULTS
From the above graphs we can analyze each functions.
The first plot shows curve fit between actual data and Linear function.It is not matches with the acatual curve.
The quadratic equation is plotted in next programme, it is also dosent match with the given inputs.
So , I tried with cubic equation, it is almost fit with given datas.
Thus the given data about the oxygen is plotted and it is curve fitted with cubic equation.