Week 6 - Data analysis
PROBLEM STATEMENT: Use python to do data analysis on a data entry for various parameters of the engine operation and plot graphs between various data colums to understand the behaviour between them and use analytics techniques to calculate the required parameters.
OBJECTIVE: To use python language to conduct data analysis on the given data file and plot graphs between parameters and to evaluate results such as power output and specific fuel consumption.
SOLUTION AND CODES:
The first important task in this data analysis is opening the file which contains the data and also validating if the file is of the proper format to do analysis. Thus a compatibility check is done before proceeding forward with the analysis.
The entire code is as follows.
import matplotlib.pyplot as plt
from scipy.integrate import simps
import numpy as np
import math

#compatibality of file
print('enter file name:  \n')
filename = str(input())
if '.out' not in filename:
	print('file not recognized. Please provide a valid CONVERGE output file.')
	exit()
else:
	pass


#getting user input for colums to be plotted
n1 = int(input("enter first property:"))  #x axis of the graph
n2 = int(input("enter second property:")) #y axis of the graph
y=[]
x=[]

for line in open(filename):
	if '#' not in line:
		x.append(float(line.split()[n1-1]))
		y.append(float(line.split()[n2-1]))

#automating the label generation
ct =1
for line in open(filename):
	if '#' in line and ct==3:
		x_label = line.split()[n1]
		y_label = line.split()[n2]
		break
	else:
		pass
	ct+=1

plt.plot(x,y,color='blue',linewidth=3)

plt.xlabel(x_label)
plt.ylabel(y_label)
plt.show()

#calculating area under the p-v plot in MJ unit
volumes =[]
pressures =[]
for line in open(filename):
	if '#' not in line:
		volumes.append(float(line.split()[7]))
		pressures.append(float(line.split()[1]))


area = simps(pressures,volumes)

#power output
rpm =1500
power = 2*area*math.pi*rpm/60 #Mw
print('area under p-v plot is ' + str(area) +' Mega joule\n')
print ('power output is ' + str(power)+' Mega watt\n')

#specific fuel consumption calculation
fuel_per_cycle= 20e-6 #kg
sfc = fuel_per_cycle/(area*1000) #kg per kilo watt

print('specific fuel consumption is '+str(sfc)+' kg per kilo watt')
Once the compatibility is checked , the next step is to get user inputs from the user inorder to know the parameters the user wants to plot graph for.
Thus the first input is the x axis of the graph and the second input is the y axis of the graph.
Now the line of the fine is parsed succecively and the data belonging to the column requested by the user is strored in seperate array.
Now plots are made using these arrays by utilising matplotlib.pyplot module.
It is to be noted that the labels for the graphs are automatically accessed and used by the program and seperate codes have been written for this purpose.
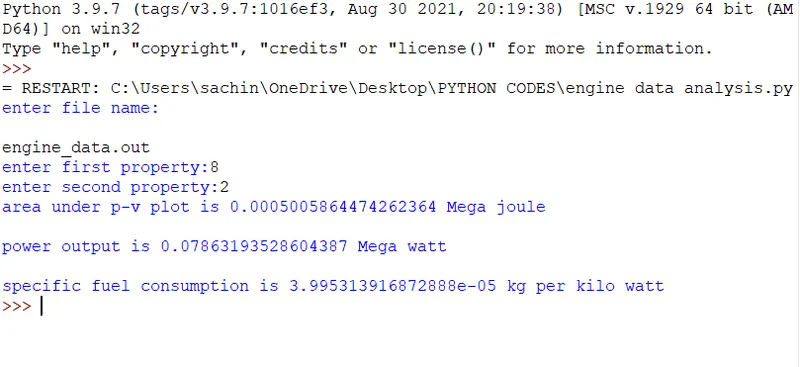
Varoius parameters such as area under p-v plot and power output are calculated in seperately.
RESULTS , PLOTS AND OBSERVATIONS:
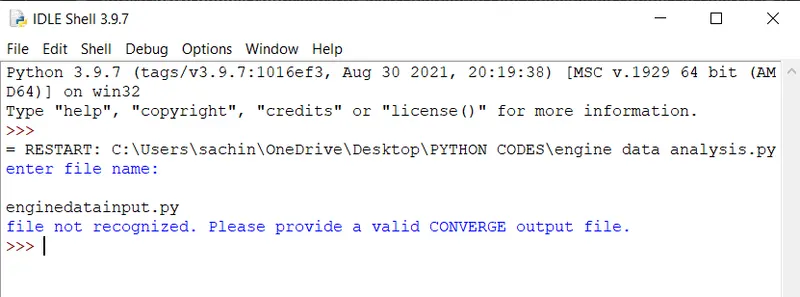
The compatibility check result is as follows. Here the file of wrong specification is given as input. It is not accepted by the program and a error message is displayed.
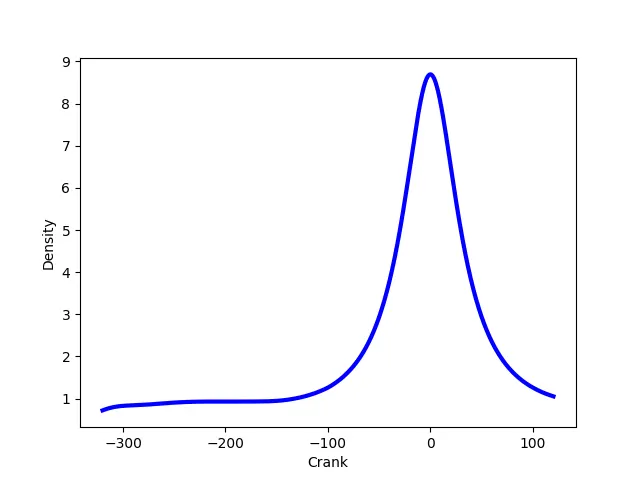
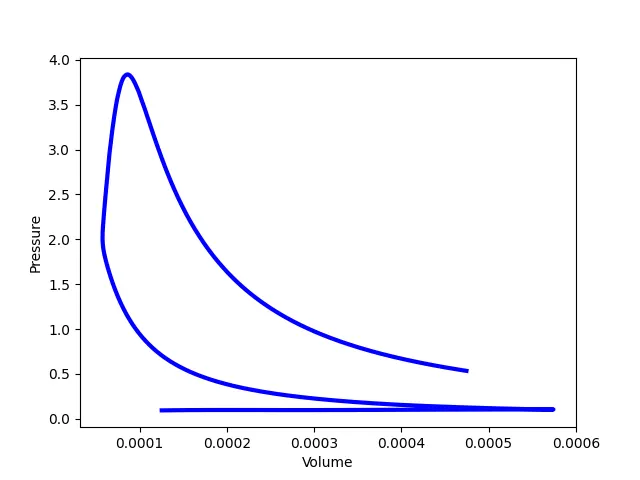
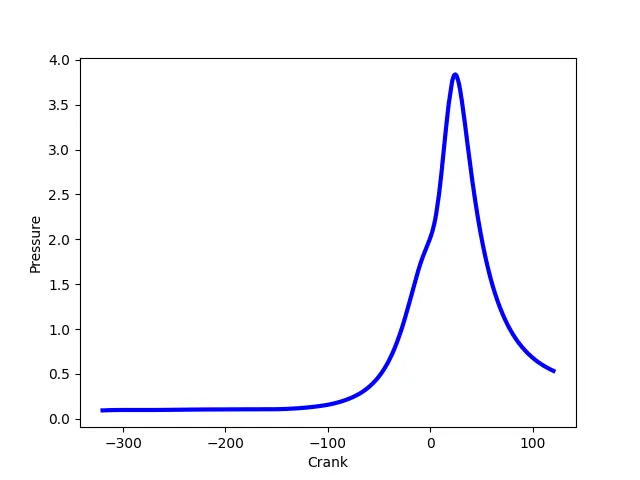
Various plots with labels are as follows.
The calculation results for various parameters are as follows.
Thus data analysis of the engine data for various parameters has been done successfully.