Week 5 - Curve fitting
1. What does popt and pcov mean?
ANS: The popt contains the list of most appropriate values of the arguments. The pcov contains the covariance matrix which is extremely useful to deal with uncertainities in the data.
2. What does np.array(temperature) do?
ANS: np.array(temperature) converts the list of temperatures into homogenous array data suitable for data analysis.
ex: [1,2,3] is changed into [1 2 3]
3. What does the * in *popt mean?
ANS: The popt contains all the appropriate argument values, *popt is used inside function argument to deploy all the values of the *popt list as arguments in order.
The code for curve fitting using linear , cubic functions is as follows.
import numpy as np
import matplotlib.pyplot as plt
from scipy.optimize import curve_fit

#curve fit linear function
def func_linear(t,a,b):
	return a*t + b

def func_cubic(t,a,b,c,d):
	return a*pow(t,3) + b*pow(t,2) + c*pow(t,1) + d
#reading data from the file
def read_data():
	temperature = []
	cp =[]
	for line in open('data' , 'r'):
		values = line.split(',')
		temperature.append(float(values[0]))
		cp.append(float(values[1]))
	return [temperature , cp]

#main program
temperature , cp = read_data()
#for linear curve fit
popt , pcov = curve_fit(func_linear , temperature ,cp)
fit_cp_linear = func_linear(np.array(temperature) , *popt)
plt.plot(temperature , fit_cp_linear ,,linewidth =3)

#for cubic curve fit
popt , pcov = curve_fit(func_cubic , temperature ,cp)
fit_cp_cubic = func_cubic(np.array(temperature) , *popt)
plt.plot(temperature ,fit_cp_cubic , , linewidth = 3)

plt.plot(temperature ,cp ,color="blue",linewidth=3)
plt.legend(['linear fit' , 'cubic fit' , 'actual data'])
plt.xlabel('TEMPERATURE')
plt.ylabel('SPECIFIC HEAT')
plt.show()
In the code we have created 2 distinct functions , first is for linear fit and the second for cubic fit.
A seperate function is written to segregate and arrange the given data into the required arrays.
Now the main program is written which is a step-wise procedure to implement curve fitting for the selected type of function.
At last matplotlib.pyplot is used to plot the various curve fit fucntions and the plot is made.
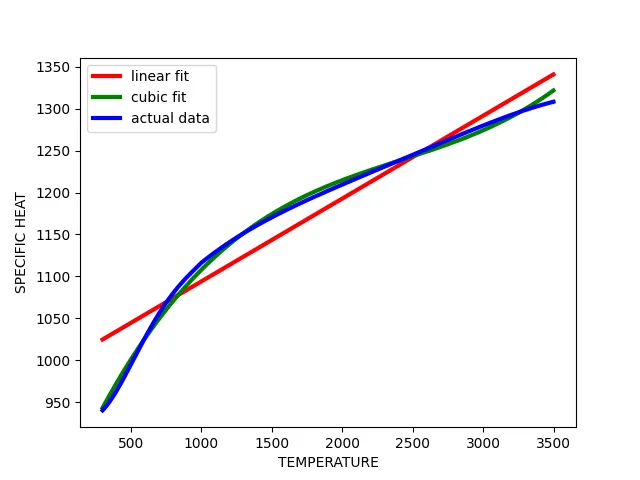
The fit is quite good but inorder to increase the accuracy we can increase the drgree of the polynomial function used.