Week 6 - Data analysis
DATA ANALYSIS
OBJECTIVE:
To obtain the different characteristics of the engine at various steps of the simulation & plot the graph between the two variable or single variable which the user has requested. Engine performance calculations for the Work done, Power, Specific fuel consumption has to be calculated with the data available in the engine output file as input. To check for compatibility as converge output file.
PROBLEM STATEMENT:
File parsing is converting the existing data in the file into another format which is easier to work or analyse further. In this case we will be able to analyse various engine parameters which are obtained as output from the engine simulation carried out in converge with file parsing in python. If we are not using file parsing doing manually will take a lot of time for each parameter to be analysed and there is a possibility of manual error also. So with file parsing we will be able to reduce time & avoid manual error.
In this project we have been requested to provide the user the option to select two parameters to analyse with each other or a single parameter with simulation steps. We have to calculate the basic engine performance calculations with the input data and also cross check the input data as proper converge output file or not.
SOLUTION PROCEDURE:
- The file name is requested to the user. After receiving file name, File checker function will check the file in two conditions
- File name matching with engine_data.out
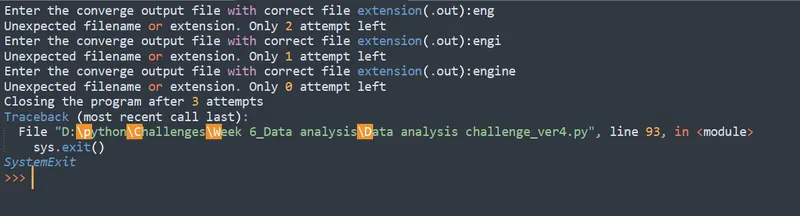
- If this condition is not met, User is provided two more attempts to enter the filename after that the program closes.
- File first line first word after “#” as converge
- If this condition is not met, Program will close informing the user that the input file is not a standard converge out file.
- File name matching with engine_data.out
- File parsing is initiated where the input contents are stored in a numpy two dimensional array with columns indicating parameters & rows indicating steps of simulation.
- User is provided with the list of all parameters whose data has been parsed in a tabular format with the index for easy access.
- User is requested whether he would like to plot a graph with two input variable
- If yes, he can input the index based on the above table for x & y axis
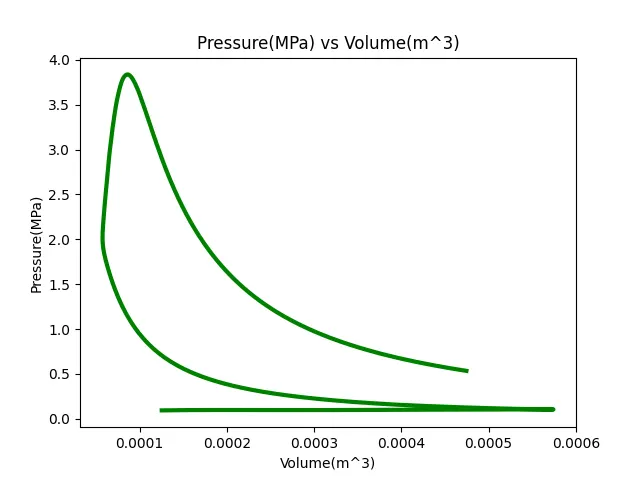
- Graph is displayed for immediate viewing & file is saved with both the parameters in the same file location
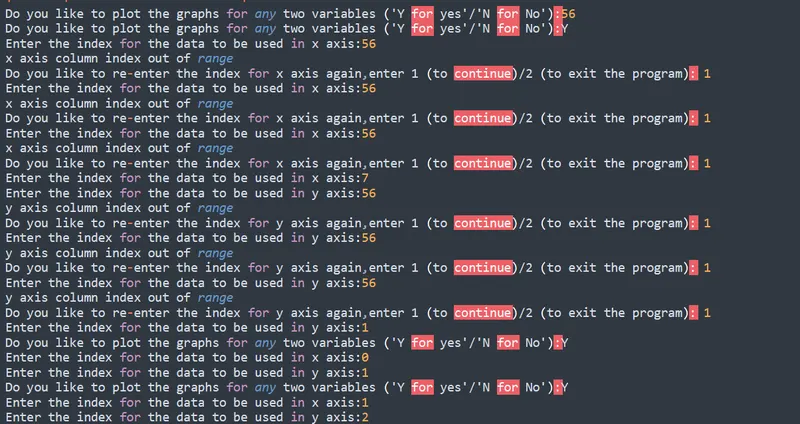
- If he inputs an index which is out of the index range, then he is prompted to re-enter or choose an option to close the program
- Once user chooses not to perform the graph with the two input variable, user is requested whether he would like to plot a graph with single variable
- If yes, he can input the index based on the above table for y axis
- Graph is displayed for immediate viewing & file is saved with parameter name in the same file location
- If he inputs an index which is out of the index range, then he is prompted to re-enter or choose an option to close the program
- Basic performance calculations are performed
- Work: By integrating & determining the area under the PV plot
- Power: Work * Cycles per second
- Cycles per second: rpm*(1/60) *(1/no of rotations for a cycle)
- Specific fuel consumption : Fuel consumed per hour/ power
CODE REFERENCE:
import math
import numpy as np
import matplotlib.pyplot as plt
from tabulate import tabulate
import sys


global line_counter
#Code for receiving user inputs for file name
def file_checker(filename,counter_exit):
	if filename =="engine_data.out":
		print("Filename matching with the extension")
		for line in open(filename):
			if line.split()[0]=="#" and line.split()[1]=="CONVERGE":
				print("File reading initiated")
				break
			else :
				print("File is not standard extract from converge, kindly recheck & start the program again")
				sys.exit()
		return(0)
	else :
		print("Unexpected filename or extension. Only %d attempt left"%counter_exit)
		return(1)
#Code for receiving inputs from user
def getting_checking_index_within_range(axis_count):
	if axis_count== 2:
		index_Data=[]
		index_variable=["x","y"]
	elif axis_count == 1:
		index_Data=[]
		index_variable=["y"]

	for i in index_variable:
		repeat=1
		while(repeat):
			a=input('Enter the index for the data to be used in {} axis:'.format(i))
			#Confirming the input is within the range of the input_data
			if int(a)>=0 and int(a)<=16:
				index_Data.append(int(a))
				repeat=0
			else:
				print("{} axis column index out of range".format(i))
				re_enter=1
				while(re_enter):
					error=input('Do you like to re-enter the index for {} axis again,enter 1 (to continue)/2 (to exit the program): '.format(i))
					if int(error) == 1:
						re_enter=0
						break
					elif int(error) == 2:
						sys.exit("Closing the program")
					else:
						print("Please enter only 1 or 2, no other input will be accepted")
	return(index_Data)

#Code for plotting the graphs
def plotting_graphs(Input_data,y,x):
	if x<=16:
		plt.figure()
		plt.plot(Input_data[:,x],Input_data[:,y],linewidth=3,color="green")
		plt.xlabel(column_names[x])
		plt.ylabel(column_names[y])
		plt.title("{} vs {}".format(column_names[y],column_names[x]))
		plt.savefig("{}-{}".format(column_names_without_units[y],column_names_without_units[x]))
		plt.show()
	else :
		plt.figure()
		plt.plot(np.linspace(0,line_counter-1,line_counter-1),Input_data[:,y],linewidth=3,color="green")
		plt.xlabel("simulation steps")
		plt.ylabel(column_names[y])
		plt.title("{}".format(column_names[y]))
		plt.savefig("{}".format(column_names_without_units[y]))
		plt.show()

#Main program
#Getting file name from user
input_notcorrect=1
exit_counter=1
while(input_notcorrect):
	if exit_counter <= 3:
		a=input("Enter the converge output file with correct file extension(.out):")
		global b
		b =a.replace(" ","")
		input_notcorrect=file_checker(b,(3-exit_counter))
		exit_counter=exit_counter+1
	else :
		print("Closing the program after 3 attempts")
		sys.exit()
#Code for reading number of lines of code & getting column name with units
line_counter=1
counter =1
column_names_without_units=[]
unit=[]
for line in open(b):
	if line.split()[0] != "#":
		line_counter=line_counter+1
	else :
		counter=counter+1
		if counter == 4:
			column_names_without_units=line.split()
			del column_names_without_units[0]
		if counter == 5:
			units =line.split()
			units.remove("#")
#Combining the column names with units
column_names=[i+j for i,j in zip(column_names_without_units,units)]
#Code for reading & storing the contents into a numpy array
Input_data= np.empty([line_counter-1,len(column_names)])
row_counter=0
for line in open(b):
	if line.split()[0] != "#":
		for i in range(0,len(column_names)):
			Input_data[row_counter][i]=float(line.split()[i])
		row_counter=row_counter+1

#Providing the user the information in a table format explaining what data is available in what column
index=np.linspace(0,len(column_names)-1,len(column_names),dtype=int)
Table=zip(index,column_names)
header=["Index","Description with units"]
print("\nFile reading completed \nDisplaying the column data available in the converge output file")
print(tabulate(Table,headers=header,tablefmt="pretty"))

#Getting parameters for plotting & plotting as per requirement
again=1
while(again):
	d=input("Do you like to plot the graphs for any two variables ('Y for yes'/'N for No'):")
	d=d.replace(" ","")
	if d == "Y":
		#Getting the column index to plot from user & checking the index are within the specified range
		a=getting_checking_index_within_range(2)
		x1=a[0]
		y1=a[1]

		#Plotting the graph requested by user
		plotting_graphs(Input_data,y1,x1)
	elif d=="N":
		while(again):
			e=input("Do you like to plot the graphs fort a single variable('Y for yes'/'N for No'):")
			e=e.replace(" ","")
			if e == "Y":
				f=getting_checking_index_within_range(1)
				y2=f[0]
				#f=input("Enter the index for the data to be used in Y axis: ")
				#f=int(f)
				plotting_graphs(Input_data,y2,line_counter-1)
			else :
				print("\n")
				again=0

#Basic performance calculation
#Area under the P-V diagram
Area=np.trapz(Input_data[:,1],Input_data[:,7])
#Converting MJ to J
Work =Area*1e6
#power output of the engine with assumption RPM as 1500
#power = work * cycles per sec
#one cycle of a 4 stroke engine formed by 2 rotations of crank
cps=1500/(60*2)
power=Work*cps
#Engine consumed 20 micrograms of fuel per stroke, determine specific fuel consumption (g/kWh)
Fuel_consumption=20
Fuel_consumption_hour=20*1e-6*cps*3600
power_kW=power/1000
specific_fuel_consumption=Fuel_consumption_hour/power_kW
print("ENGINE PERFORMANCE CALCULATION OUTPUTS")
print("Area under PV plot:{} MJ".format(round(Area,4)))
print("Work:{} J".format(round(Work,3)))
print("Engine power:{} kW with consideration of 1500 rpm".format(round(power_kW,3)))
print("Specific Fuel Consumption: {} g/kWh with the consideration of the 20 micro gram per cycle".format(round(specific_fuel_consumption,3)))
RESULTS:
OUTPUT OF THE PROJECT:
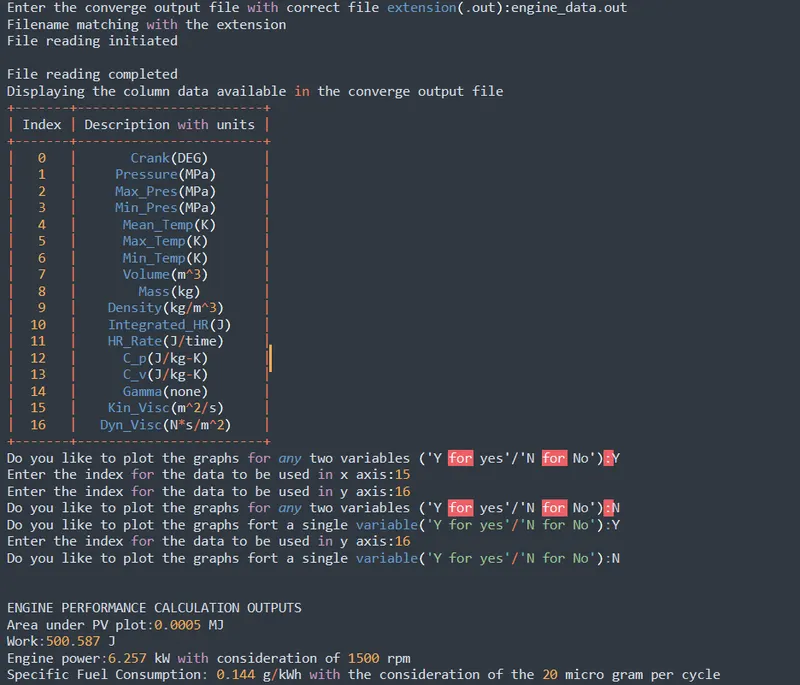
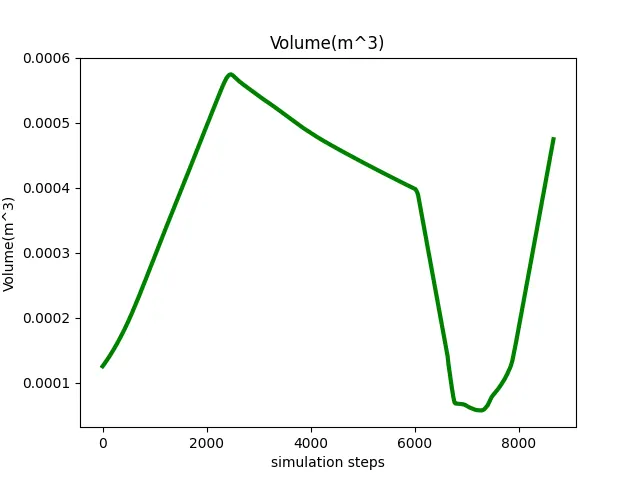
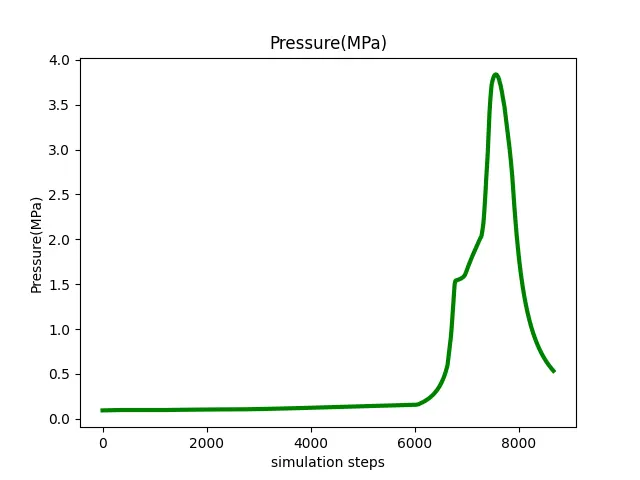
SAMPLE TWO VARIABLE PLOTS:
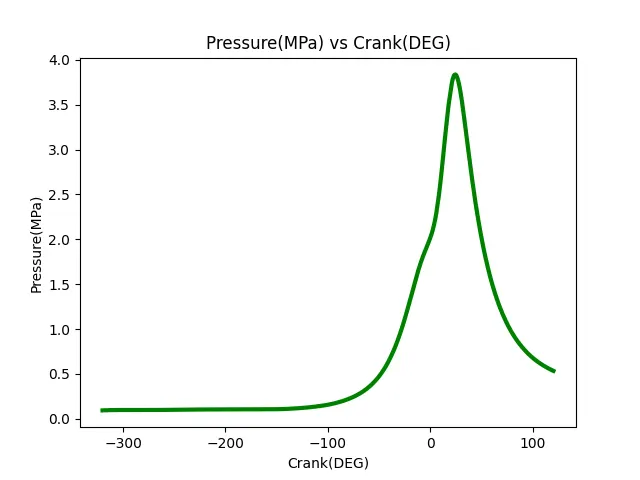
SAMEPLE SINGLE VARIABLE PLOTS:
DISCUSSION
Based on the above project, we are able to understand the file parsing for the given file & analyse the parsed data to better understand the relation between various parameters.
To better understand the application in practical situation, we should work on the compatibility of input file to accept different file names and prepare a standard list of graphs for a given set of files whose study could be an interesting next scope. When working on the next scope we should also focus on making the code more dynamic & concise.
ERROR:
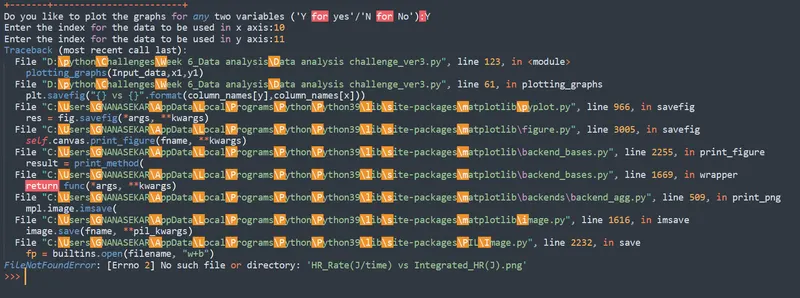
One of the difficult errors to understand was the file not found error face when saving the filename for the plot. It was realised that we have limitations to save the file name so file name was saved with only parameters without units.
Code:

Error message:
Correction code:

TESTING:
Testing for exiting for wrong file name:
Testing for program exiting with wrong file content:

Testing for index out of range: