Week 6 - Data analysis
- Data Analysis:- is a process of collecting, transforming,and modelling data in order to discover the required information.Here we have a Thermodynamic data collected and we have to analysed from a data file using a python program.
This data file consist of a 17 columns of different different parameters for which more than 8000 values have bbeen recorded. The objective is to open the file in the same directory,read and extract desired data from the file.
The program takes the data or inputs from the user and plots the graph for respective parameters.
- REPL:- REPL stands for Read Evaluate Print Loop, and is the name given to the interactive micropython prompt that is acccesible on the Python.Using REPL is the easiest way to test out Python code and run commands.You can use the REPL in addition to writting scripts in main.py.
- Objective:-
- Calculate the area under the p-v digm. P is in column 2 and V is in column 8.
- Calculate the power output of this engine.Assume the RPM is 1500.
- This engine consumed 20 micro grams of fuel(per 1 stroke cycle). Calculate its specific fuel consumption.
A program:-
import matplotlib.pyplot as plt
import numpy as np
from numpy import trapz


fname = input("enter file name: ")

if fname == 'engine_data.out':
	print('file is valid')

else:

	print('file is invalid')
	exit()

def compatibility_check(a):

	if 'CONVERGE' not in a:
		print('please provide converge output file to process')
		exit()

	else:

		print('compatibility compatibility_check is successful')

		pass

FILE = []

for line in open(fname):
	if '#' in line:

		FILE.append(line.split())
compatibility_check(FILE[0])

noc = len(FILE[1])
head = len(FILE[2])
col_no =[]
col_val = []
col_units =[]

z = FILE[1].index('column')
for i in range(z,noc-1):

	col_no.append(i)

for j in FILE[2]:

	if j is not '#':

		col_val.append(j)

for k in FILE[3]:

	if k is not '#':
		col_units.append(k)
print('data avalable are:')

for a in range(0,len(col_no)):

	print(col_no[a],col_val[a],col_units[a])

xaxis = int(input('Enter xaxis column no:'))-1
yaxis = int(input('Enter yaxis column no:'))-1

x = []
y = []

for  line in open(fname):

	if '#' not in line:

		x.append(float(line.split()[xaxis]))
		y.append(float(line.split()[xaxis]))

plt.plot(x,y,linewidth=1.5)
plt.xlabel(col_val[xaxis])
plt.xlabel(col_val[xaxis])
plt.show()

pressure = []
vol = []

for line in open(fname):
	if '#' not in line:

		pressure.append(float(line.split()[1]))
		vol.append(float(line.split()[7]))

pressure = 1e6*np.array(pressure)
volume = np.array(vol)
area = np.trapz(pressure,volume)
print('workdone =',area, 'joules')
cyclepersec = 750/60
power = area*(cyclepersec/1000)
print('power=',power,'kw')
mass_flow= 20e-6
sfc = mass_flow*3600/power
print('specific fuel consumption =',sfc,'g/kwh')
Results:-
enter file name: engine_data.out
file is valid
compatibility compatibility_check is successful
data avalable are:
1 Crank (DEG)
2 Pressure (MPa)
3 Max_Pres (MPa)
4 Min_Pres (MPa)
5 Mean_Temp (K)
6 Max_Temp (K)
7 Min_Temp (K)
8 Volume (m^3)
9 Mass (kg)
10 Density (kg/m^3)
11 Integrated_HR (J)
12 HR_Rate (J/time)
13 C_p (J/kg-K)
14 C_v (J/kg-K)
15 Gamma (none)
16 Kin_Visc (m^2/s)
17 Dyn_Visc (N*s/m^2)
Enter xaxis column no:3
Enter yaxis column no:5
workdone = 500.5866274680076 joules
power= 6.257332843350095 kw
specific fuel consumption = 0.011506499942146618 g/kwh
>>>
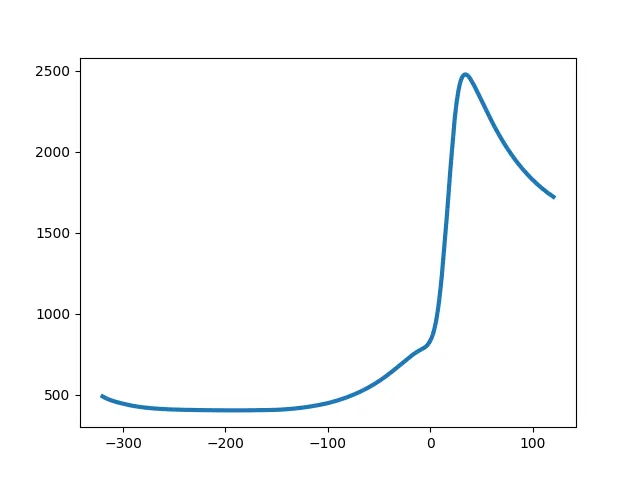
Plots:-
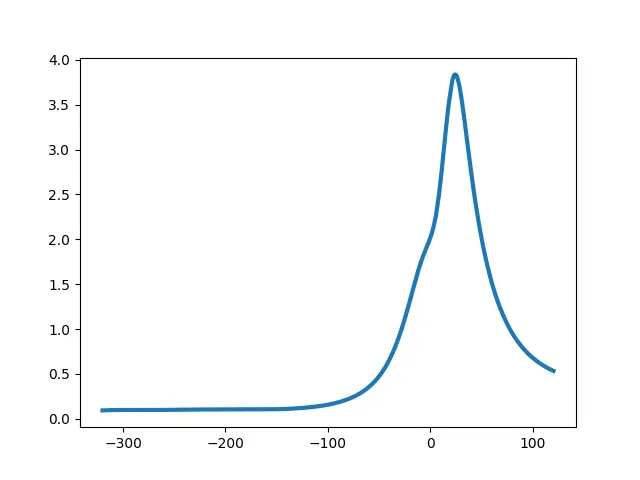
Figure(2):- pressure vs volume
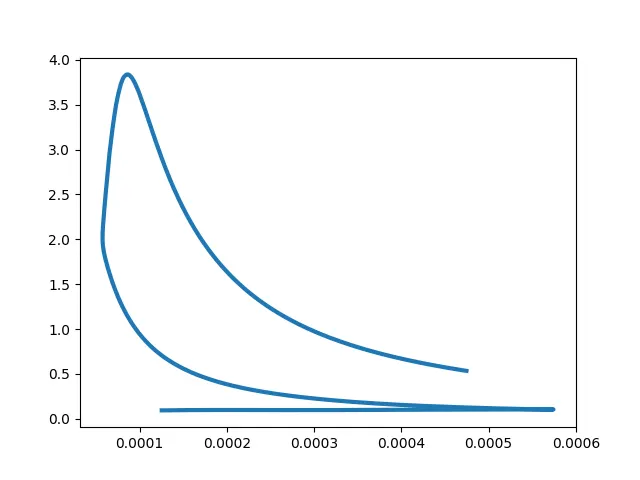
Figure(3):-Crank angle vs Temperature