Week 6 - Data analysis
DATA ANALYSIS ON ENGINE PERFORMANCE
AIM:
TO ANALYSE THE GIVEN SET OF DATA OF THE PERFORMANCE OF AN ENGINE AND TO COMPARE THE ACTUAL DATA AND TO PLOT THE PARAMETERS FROM THE GIVEN DATA SET.
OBJECTIVES:
COMPATIBILITY CHECK:
THE COMPATIBILITY CHECK IS NOTHING BUT TO CHECK THE GIVEN DATA IS VALID OR NOT. IF A NON-VALID FILE NAME IS PROVIDED AS AN INPUT, IT SHOULD EXIT THE PROGRAM, SAYING THAT “INPUT FILENAME IS NOT VALID “.
DATA VISUALIZE:
- WE NEED TO TAKE THE COLUMN NUMBERS AS INPUT AND WE NEED TO ACCESS THE COLUMN DATA VALUES ACCORDINGLY AND WE NEED TO USE THE DATA IN THE PROGRAM
CALCULATION :
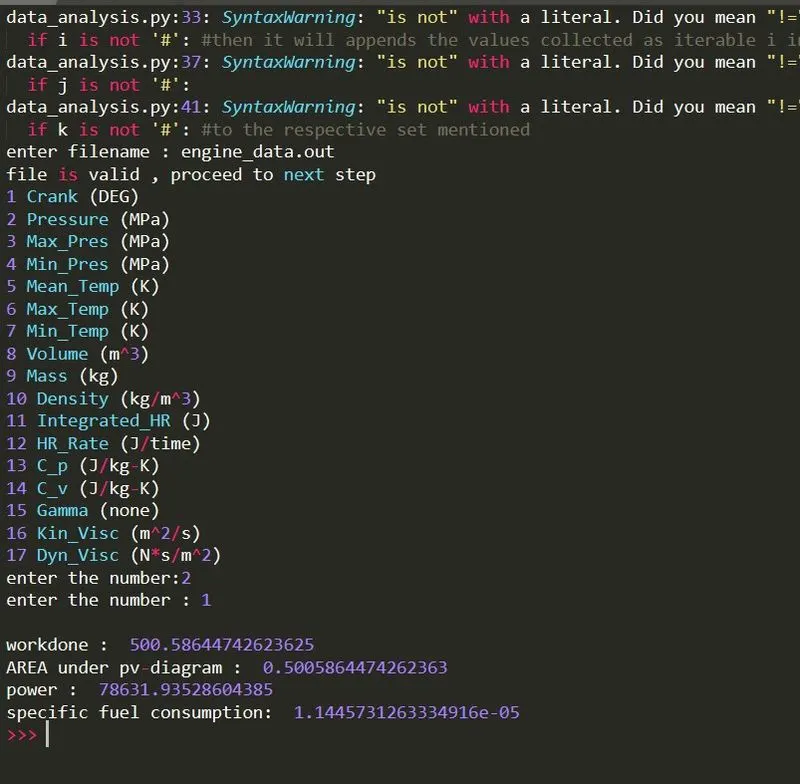
WE NEED TO CALCULATE THE AREA UNDER THE PV – DIAGRAM AND THE WORKDONE GENERATED BY THE ENGINE , POWER AND THE SPECIFIC FUEL CONSUMPTION FROM THE GENERATED DATA SET .
CODE :
import math #we are now importing math module to perform the mathematical operations
import matplotlib.pyplot as plt  #we are now importing the matplot library as plt for plotting purposes
import numpy as np #we are now importing numpy module to perform array operations and basic matrix operations
from scipy.integrate import simps #from scipy intergration module we are now importing simpson integration library as simps to perform an integration operation

# we are now accessing the data and slicing the data and storing them for the later operations required
column = []   #this column variable will store each and every column as a list

column_number =[] #from the column , we are now slicing the list and saving a certain line in the column_number
column_value=[] #from the column, we are now slicing the list and saving a certain line in the column_value
column_units=[] #from the column, we are now slicing the list and saving a certain line in the column_units
line_count = 1  #to get the number of lines in the actual data , we are assuming a variable named line_count with a initial value of 1

#compatibility check
check = input("enter filename : ") #this line represents the compatibility check ,  means to check  if the given data set or data file is an actual converge file
#and it contains the converge file data or not
if check == 'engine_data.out':    #this loop statement represents the entered filename is the name of the actual data set or not . if yes
	print("file is valid , proceed to next step") #it will proceed to the next step

else:
	print("file is not valid , and exit ")  #if it is not the name of the actual data set given the program will not proceed further and it will
#print the following message and it will exit the loop and stop the program
	exit()

#ACCESSING DATA
for line in open(check): #now we need to access the data in the given data file for each and every value and to store the data accordingly in the given empty set
	if '#' in line: # #this line is only meant for the data which contains only the # symbol and it will consider only those lines
		column.append(line.split()) # this line will split the column into a list and it will append each and every values of the condition given accordingly in to the empty set
a = column[1].index('column') #this variable is given to eliminate the word column in the line by means of indexing

#the given data set contains units , units values , units name . these three columns can be separated and sliced and then stored in their respective empty sets accordingly
for i in range(a,len(column[1])-1): #for the first value we got the serial number for the column , inorder to get the values we need to use a loop statement untill it collects all the column number and
	if i is not '#': #then it will appends the values collected as iterable i in the column_number
		column_number.append(i)
#this loop statement represents the column_value in  the similar fashion as the before loop
for j in column[2]: #this loop statements checks for the line 2 in the column to get the value and then it will store the values collected as the iterable j in the respective sets
	if j is not '#':
		column_value.append(j)
#this loop statement looks for the units of the data provided in the data set which is represeneted in the column number 3
for k in column[3]: #this loop statement looks for the value of the given data  and then it will collect each and every values as iterable k and then it will append
	if k is not '#': #to the respective set mentioned
		column_units.append(k)
#in order to represent every collected data in the output screen as the table format we are just structured the loop statement as the length of the column number
for i in range(0,len(column_number)): #so that the units , values and serial number will generate upto the column number in the data set
	print(column_number[i],column_value[i],column_units[i]) #it will display the given the format in the output screen

#we need to run the program for any value and to plot the graph for any two parameter , which is basically a user defined inputs

x = int(input("enter the number:"))-1 #this will ask for the user to enter a manual number to access the program
y = int(input("enter the number : "))-1 #this will ask for the user to enter a manual number to access the program
x_input=[] #this will store the generated data by the user defined x value from the  displayed data list in the above loop and it is accessed in the future
y_input=[] #this will store the generated data by the user defined y values from the displayed data list in the above loop and it is accessed in the future

for line in open(check):  #this line will open the data set according to the user defined filename , and it will look for each and every line
	if '#' not in line : #for this time we need to access the data instead the heading section , so we are ignoring the pound lines

		x_input.append(float(line.split()[x])) #this will look for the user defined number in the actual data set and it will convert the data into a integer set and it will append it to the x_input set
		y_input.append(float(line.split()[y])) #this will look for the user defined number in the actual data set and it will convert the data into a integer sert and it will append the values to the y_input set

	line_count = line_count+1 #this line will check for the no of lines in the given data set untill its over , it will go for another line
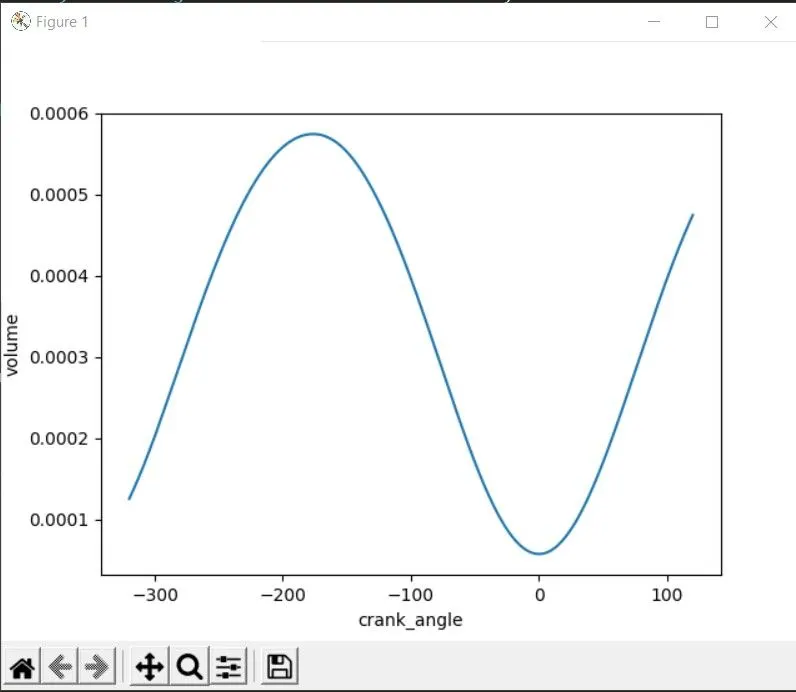
plt.figure(1) #this will open a new figure window
plt.plot(x_input,y_input) #this will plot according to the user defined values as the x_input and y_input
plt.xlabel("crank_angle")
plt.ylabel("volume")
plt.show() #this command will show the plot that is generated

#CALCULATION
 #we just need the  known data values to enter in to the calculation section , for workdone we need to know the pressure and volume values
pressure = []  #this will store the values of the pressure values from the data set
volume = [] #this will store the values of the volume values from the data set


for line in open(check): #this line will open the data set and will look for each and every line in the data set
	if '#' not in line : #again we dont need to access the heading only the datas so we are ignoring the pound statements

		pressure.append(float(line.split()[1])) #this line will split the values from the data set and make it as a list format and will append the values in the pressure list
		volume.append(float(line.split()[7])) #this line will split the values from the data set and make it as a list format and will append the values in the volume list
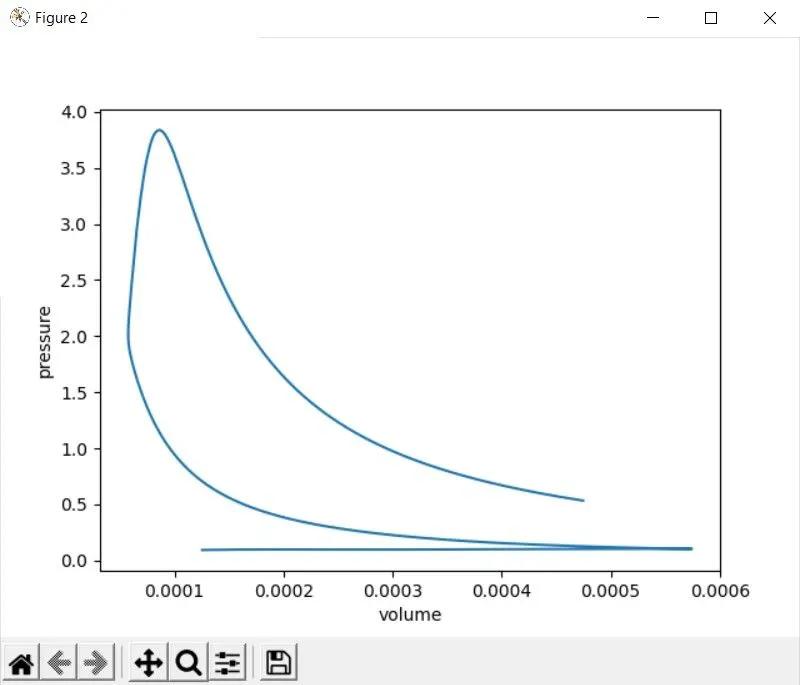
plt.figure(2)	#this command will open a new figure window for another plots to be displayed
plt.plot(volume,pressure) #this will generate the plot for the pressure and volume as a p-v diagram
plt.xlabel("volume")
plt.ylabel("pressure")
plt.show()#this will display the plot generated for the pressure and volume as p-v diagram to the output screen
p = np.array(pressure)*1000 # we need to convert the values of pressure from PASCAL to KILOPASCAL  in order to convert each and ever values of pressure from pa to kpa values as it is stored in list
#so we are converting the list into matrix by means of the numpy arrays so that it will convert the list into matrix and then we can simply follow the matrix multiplication rule .
A = simps(p,volume) #we need to find the area generated in the pv diagram for the pressure and volume , we are using the simpson integration rule , where we imported from the scipy library
w = A*1000 #workdone is the result of the area in the pv diagram
print(w) #this will print the value of the workdone
print(A) #this will print the value of the  area


#power
rpm = 1500 #given data
power = (2*math.pi*rpm*w)/60 #we are defining the power by means of the formula of the power
print(power) #this line will print the value of the power generated

#SPECIFIC FUEL CONSUMPTION
stroke = 20*pow(10,-6) #this is the  value of fuel consumed by the engine in grams
spfc = (stroke * rpm * (0.5/60)*3600 )/power #we are defining the specific fuel consumption by means of the formula
print(spfc) #this statement will display the value of the specific fuel consumption value
PLOTS :
CONDITION 1 :
1) CRANK ANGLE VS VOLUME
2) CONDITION - 2
PRESSURE VS VOLUME :
output :
CONCLUSION :
THUS , WE HAVE PLOTTED AND CALCULATED THE NECCESARIES FROM THE GIVEN DATA SET .