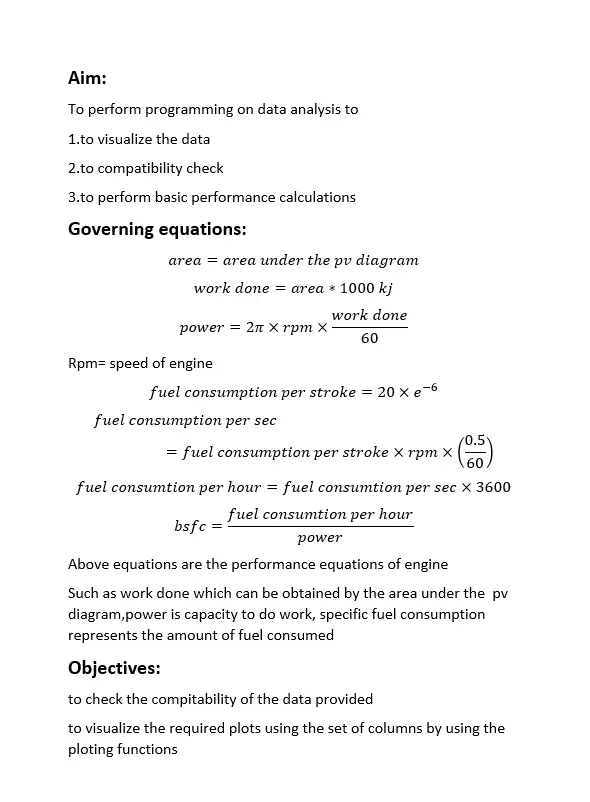
Week 6 - Data analysis
"""
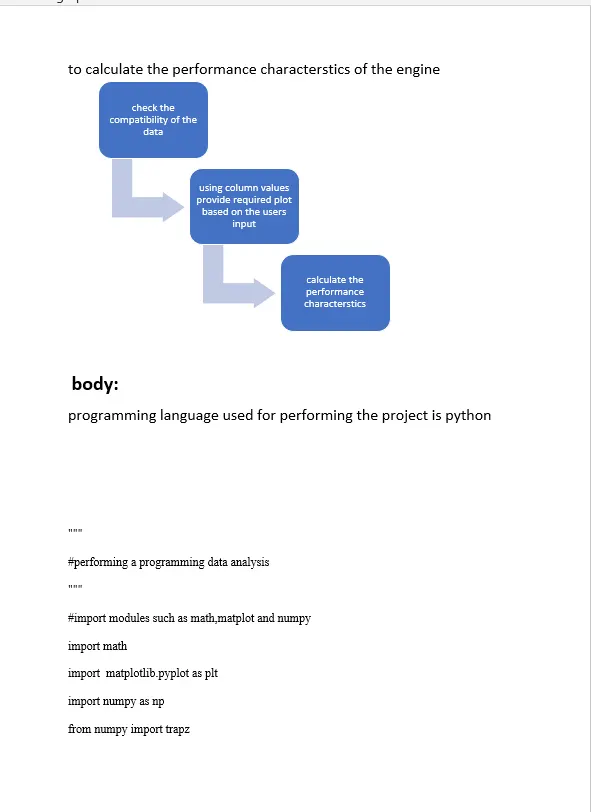
#performing a programming data analysis
"""
#import modules such as math,matplot and numpy
import numpy as np
from numpy import trapz
import math
import matplotlib.pyplot as plt
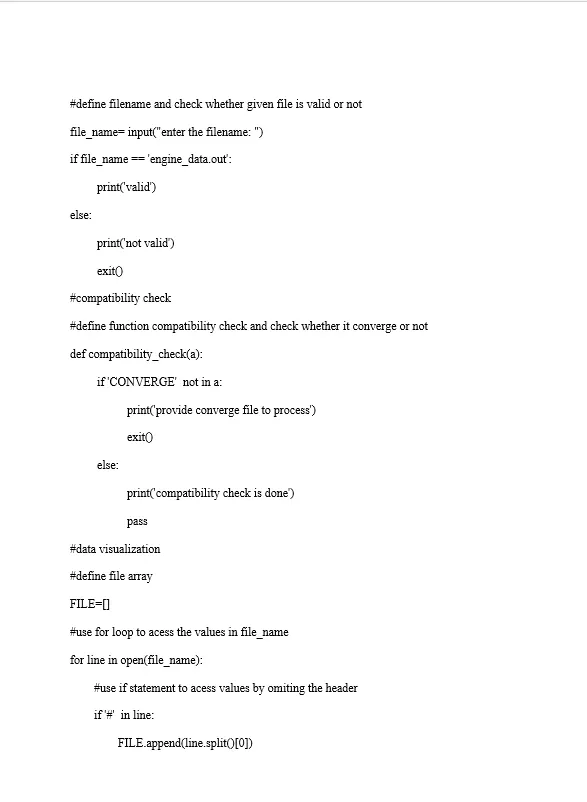
#define filename and check whether given file is valid or not
file_name= input("enter the filename: ")
if file_name == 'engine_data.out':
print('valid')
else:
print('not valid')
exit()
#define function compatibility check and check whether it converge or not
def compatibility_check(a):
if'CONVERGE' not in a:
print('provide converge file to process')
exit()
else:
print('compatibility check is done')
pass
#define file array
FILE=[]
#use for loop to acess the values in file_name
for line in open(file_name):
#use if statement to acess values by omiting the header
if'#' in line:
FILE.append(line.split()[0])
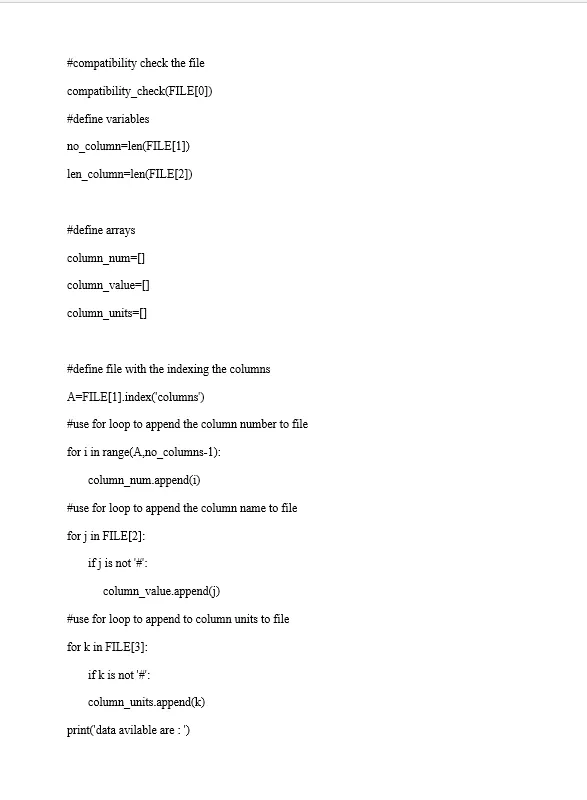
#compatibility check the file
compatibility_check(FILE[0])
#define variables
no_column=len(FILE[1])
len_column=len(FILE[2])
#define arrays
column_num=[]
column_value=[]
column_units=[]
#define file with the indexing the columns
A=FILE[1].index('columns')
#use for loop to append the column number to file
for i in range(A,no_columns-1):
column_num.append(i)
#use for loop to append the column name to file
for j in FILE[2]:
if j is not '#':
column_value.append(j)
#use for loop to append to column units to file
for k in FILE[3]:
if k is not '#':
column_units.append(k)
print('data avilable are : ')
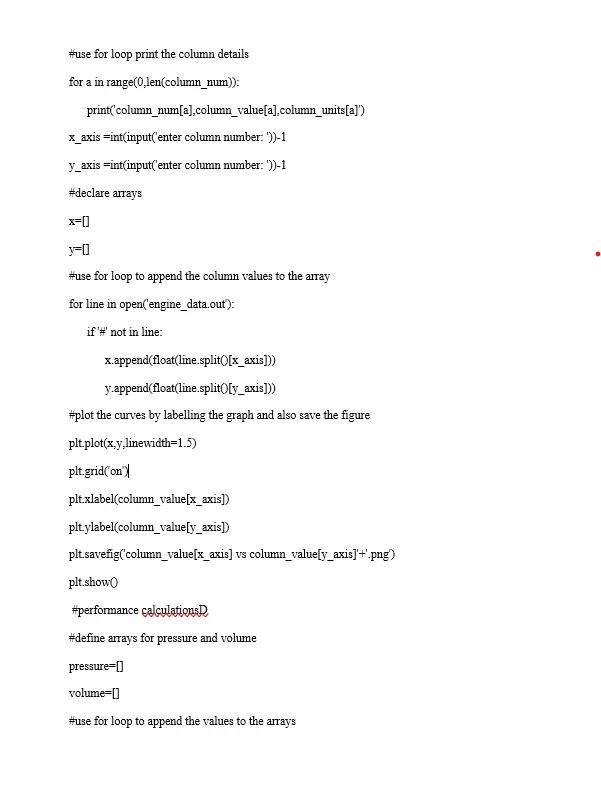
#use for loop print the column details
for a in range(0,len(column_num)):
print('column_num[a],column_value[a],column_units[a]')
x_axis =int(input('enter column number: '))-1
y_axis =int(input('enter column number: '))-1
#declare arrays
x=[]
y=[]
#use for loop to append the column values to the array
for line in open('engine_data.out'):
if '#' not in line:
x.append(float(line.split()[x_axis]))
y.append(float(line.split()[y_axis]))
#plot the curves by labelling the graph and also save the figure
plt.plot(x,y,linewidth=1.5)
plt.grid('on')
plt.xlabel(column_value[x_axis])
plt.ylabel(column_value[y_axis])
plt.savefig('column_value[x_axis] vs column_value[y_axis]'+'.png')
plt.show()
#define arrays for pressure and volume
pressure=[]
volume=[]
#use for loop to append the values to the arrays
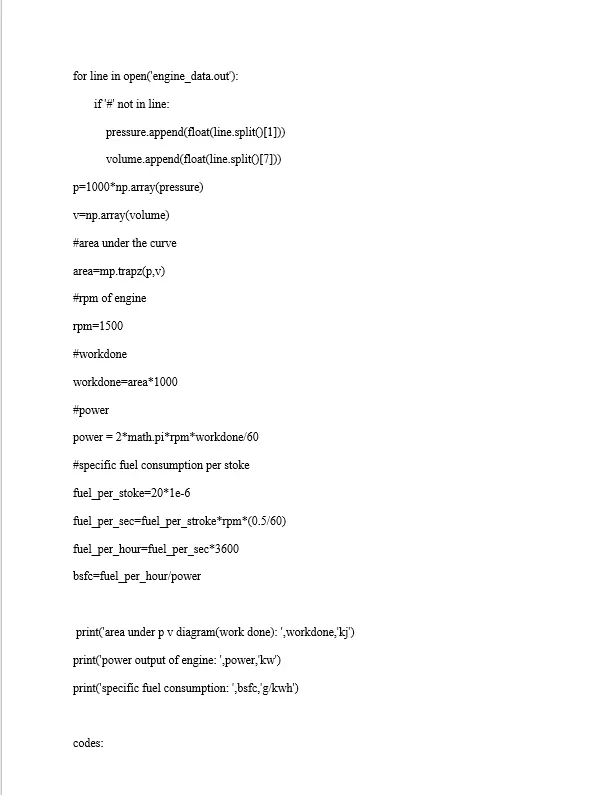
for line in open('engine_data.out'):
if '#' not in line:
pressure.append(float(line.split()[1]))
volume.append(float(line.split()[7]))
p=1000*np.array(pressure)
v=np.array(volume)
#area under the curve
area=mp.trapz(p,v)
#rpm of engine
rpm=1500
#workdone
workdone=area*1000
#power
power = 2*math.pi*rpm*workdone/60
#specific fuel consumption per stoke
fuel_per_stoke=20*1e-6
fuel_per_sec=fuel_per_stroke*rpm*(0.5/60)
fuel_per_hour=fuel_per_sec*3600
bsfc=fuel_per_hour/power
print('area under p v diagram(work done): ',workdone,'kj')
print('power output of engine: ',power,'kw')
print('specific fuel consumption: ',bsfc,'g/kwh')
codes:
import matplotlib.pyplot as plt
import numpy as np
from numpy import trapz
import math

file_name = input("enter the file name:  ")

if file_name== 'engine_data.out':
	print('valid')
else:
	print('invalid')

	exit()


def compatibility_check(a):

	if 'CONVERGE' not in a:

		print('provide converge file to process')

		exit()
	else:
		print('compatibility check is done')

		pass

FILE = []

for line in open(file_name):

	if '#' in line:

		FILE.append(line.split())

compatibility_check(FILE[0])

no_column=len(FILE[1])
len_column=len(FILE[2])

column_num=[]
column_value=[]
column_units=[]


A= FILE[1].index('column')

for i in range(A,no_column-1):
	column_num.append(i)

for j in FILE[2]:

	if j is not '#':

		column_value.append(j)


for k in FILE[3]:

	if k is not '#':

		column_units.append(k)

print('data avialable are: ')

for a in range(0,len(column_num)):

	print(column_num[a],column_value[a],column_units[a])

xaxis = int(input('enter row number:'))-1
yaxis = int(input('enter column number:'))-1

x=[]
y=[]

for line in open(file_name):

	if '#' not in line:

		x.append(float(line.split()[xaxis]))
		y.append(float(line.split()[yaxis]))

plt.plot(x,y,linewidth=1.5)
plt.grid('on')
plt.xlabel(column_value[xaxis])
plt.ylabel(column_value[yaxis])
plt.savefig( 'column_value[xaxis] vs column_value[yaxis]'+'.png')
plt.show()

pressure=[]

volume=[]

#use for loop to append the values to the arrays

for line in open('engine_data.out'):
	if '#' not in line:
		pressure.append(float(line.split()[1]))
		volume.append(float(line.split()[7]))

p=1000*np.array(pressure)
v=np.array(volume)
area=np.trapz(p,v)
rpm=1500
workdone=area*1000
power = 2*math.pi*rpm*(workdone/60)
fuel_per_stroke=20*1e-6
fuel_per_sec=fuel_per_stroke*rpm*(0.5/60)
fuel_per_hour=fuel_per_sec*3600
bsfc=fuel_per_hour/power

print('area under p v diagram(work done): ',workdone,'kj')
print('power output of engine: ',power,'kw')
print('specific fuel consumption: ',bsfc,'g/kwh')https://www.dropbox.com/t/zfElYwQ5gWNz3xjCvalid
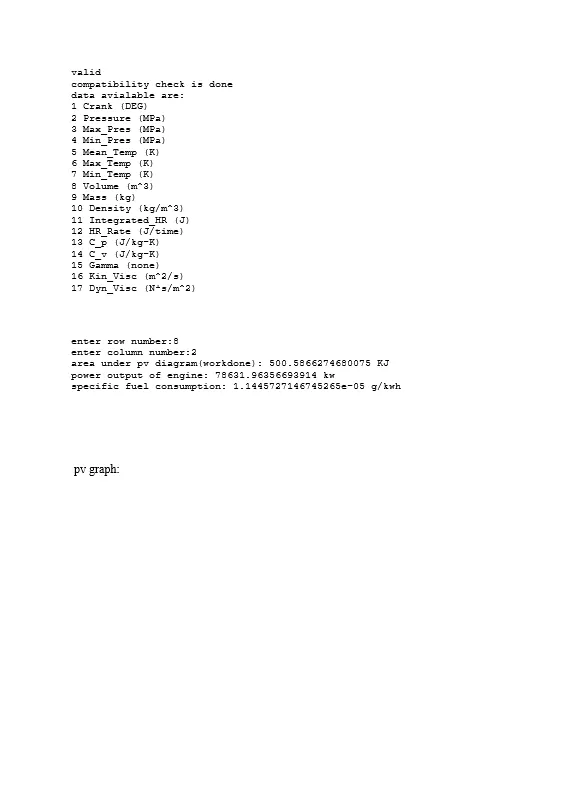
compatibility check is done
data avialable are:
1 Crank (DEG)
2 Pressure (MPa)
3 Max_Pres (MPa)
4 Min_Pres (MPa)
5 Mean_Temp (K)
6 Max_Temp (K)
7 Min_Temp (K)
8 Volume (m^3)
9 Mass (kg)
10 Density (kg/m^3)
11 Integrated_HR (J)
12 HR_Rate (J/time)
13 C_p (J/kg-K)
14 C_v (J/kg-K)
15 Gamma (none)
16 Kin_Visc (m^2/s)
17 Dyn_Visc (N*s/m^2)
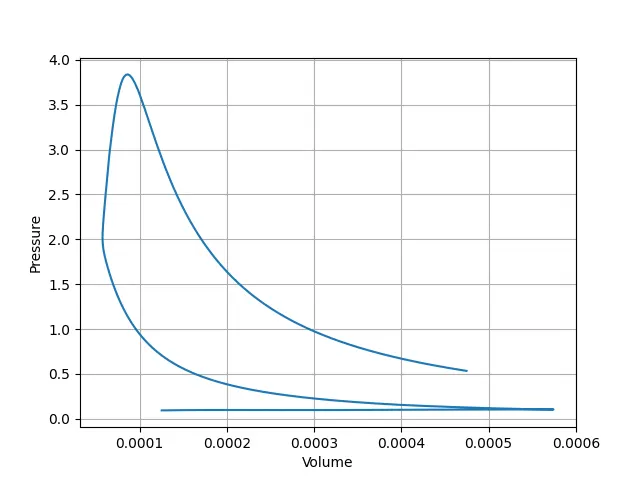
enter row number:8
enter column number:2
area under pv diagram(workdone): 500.5866274680075 KJ
power output of engine: 78631.96356693914 kw
specific fuel consumption: 1.1445727146745265e-05 g/kwh
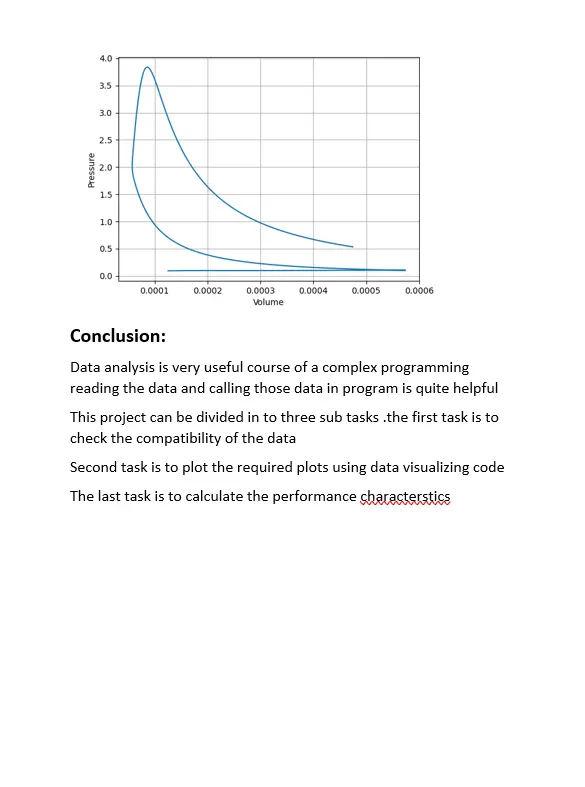
pv graph:
report: