Week 6 - Data analysis
Objective
The objective of the code is to compatibility the code.
Read the data from the data file and take the user input to plot the graph between two variables.
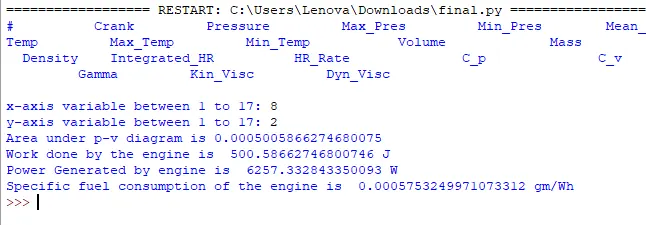
If the graph is plotted between pressure and volume. Then calculate the area under P-V diagram. Calculate the power of the engine and specific fuel consumption.
Solution Procedure
1. We need to import the math library, plot library, and Numpy library for certain calculations and processes. To calculate the area under P-V curve we are going to import trapz from numpy.
2. Now we are going to check the code compatibility. In order to that, we need to check that the data file is present in the same folder as the code file. So to check that we are going to use try-except. In that, we are going to read the data file. If it is unable to read it will print out "File not recognized. Please provide a valid CONVERGE output file".
3. Now we are going to print out the third line from the data file. Which shows the variables present in the data file.
4. Now we are going to take the user input to choose the index of the variables which users want to plot a graph between them.
5. We are going to store the variable and unit from the line 3 and 4 from the data file. So that we can use them while we are giving the label and title to the graph.
6. Now we are going to store the data for the variables which the user selected.
7. Now we are going to plot the graph, gives the label and title to the graph.
8. If the user decided to plot the graph between pressure and volume then we are going to do some calculation. By looking at the P-V diagram we can see that it is an 'otto cycle'.
9. First, we are going to calculate the area of the P-V diagram with the help of the 'trapz' and we are going to print that.
10. The area under the P-V curve is work. But we going to convert the unit in joule we are going to multiply it with `10^6` and we are going to print that.
11. Now we are going to calculate the power of the engine. In order to that, we are going to assume that RPM is 1500.
So power `P = W*(N/2)*(1/60)`
Now we are going to print that.
12. Now we are going to calculate specific fuel consumption. So we are going to assume that engine consumes 20 micrograms of fuel (per 1 stroke cycle).
First, we are going to convert it into gm/sec.
`m_f = 20*2*N*10^-6/60`
So the specific fuel consumption
`SFC = m_f*3600/P`
Now we are going to print that.
Python Script
# File parsing

import math
import matplotlib.pyplot as plt
import numpy as np
from numpy import trapz


# File comptability check

try:
        open('engine_data.out', 'r')
except:
	print('file not recognized. Please provide a valid CONVERGE output file')


# Plotting of the graph as the user requested
line_count = 1
for line in open('engine_data.out'):
    if line_count == 3: print (line)
    line_count = line_count + 1


# Input Values
x = int(input("x-axis variable between 1 to 17: "))
y = int(input("y-axis variable between 1 to 17: "))

variable = []
unit = []
line_count = 1
for line in open('engine_data.out'):
    if line_count == 3:
        variable.append(line.split())
    if line_count == 4:
        unit.append(line.split())
    line_count = line_count + 1


x_variable = []
y_variable = []


for line in open('engine_data.out'):
	if '#' not in line:
		x_variable.append(float(line.split()[x-1]))
		y_variable.append(float(line.split()[y-1]))


plt.plot(x_variable,y_variable)
plt.xlabel(variable[0][x]+unit[0][x])
plt.ylabel(variable[0][y]+unit[0][y])
plt.title(variable[0][y]+ ' vs '+variable[0][x]+' diagram')
plt.savefig(variable[0][y]+ ' vs '+variable[0][x]+'.png')
plt.show()


if (x == 8) & (y == 2):

    area = np.trapz(y_variable,x_variable)

    print("Area under p-v diagram is",area)


    # Work ddone
    W = area*pow(10,6)
    print('Work done by the engine is ',W,'J')

    # Power Generation
    # Speed in rpm
    N = 1500
    P = W*(N/2)*(1/60)
    print('Power Generated by engine is ',P,'W')

    # Specific Fuel Consumption
    m_f = 20*2*N*pow(10,-6)/60
    SFC = m_f*3600/P
    print('Specific fuel consumption of the engine is ',SFC,'gm/Wh')
Output
Now when we execute the program, it asks for the user input
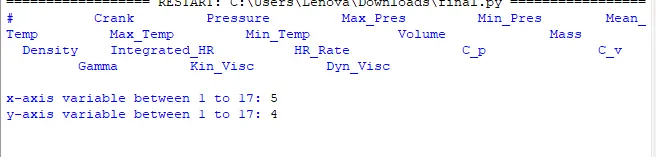
When I gave the input to be 5 and 4. It gives us the following graph:-
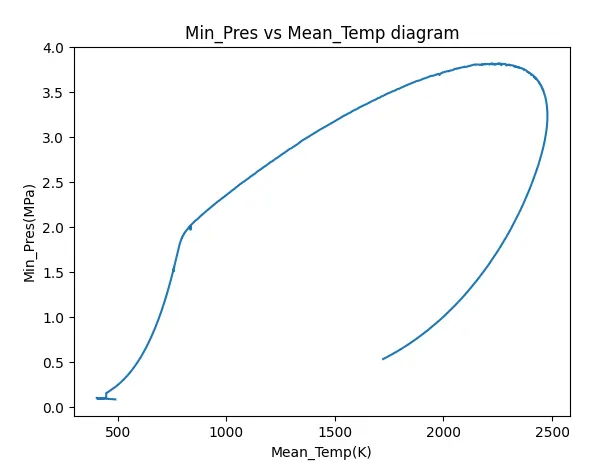
It is the graph between minimum pressure and mean temperature.
Now when I gave the user input to be 8 and 2

We get the graph between pressure and volume.
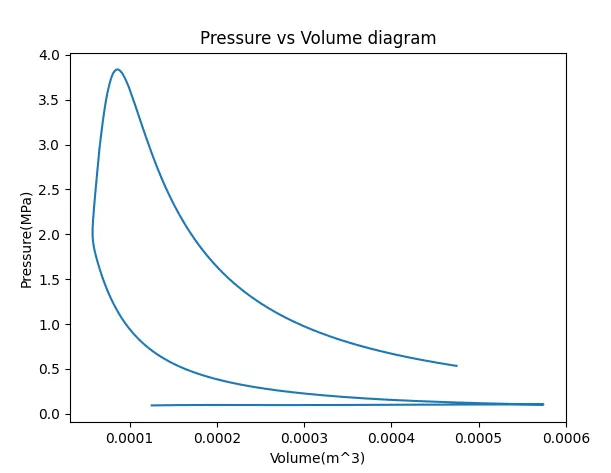
And then it calculates the work, power, and SFC value and prints out those values.