DATA ANALYSIS, USING PYTHON PROGRAMMING LANGUAGE
AIM:
- From the given file “engine_data.out”, All the data inside the file has to be read and some task to be performed by using that data inside the file, with PYTHON programming language.
OBJECTIVE:
- Task -1: The PYTHON code should exit gracefully, if a non-compatible file is provided as an input. It should say something like "File not recognized. Please provide a valid CONVERGE output file"
- Task-2: The PYTHON code should take column numbers as the input and plot the respective columns as separate images and each file should be saved by the name of the column. This should not be done manually.
- Task-3: The PYTHON code to calculate the area under the P-V diagram. P is in column 2 and V is in column 8
- Task-4: Calculate the power output of this engine. Assume that RPM is 1500
- Task-5: This engine consumed 20 micro grams of fuel (per 1 stroke cycle). Calculate its specific fuel consumption.
DETAILED CONTENT:
- Using “Open” command for Opening and Reading the desired file.(Refer python code)
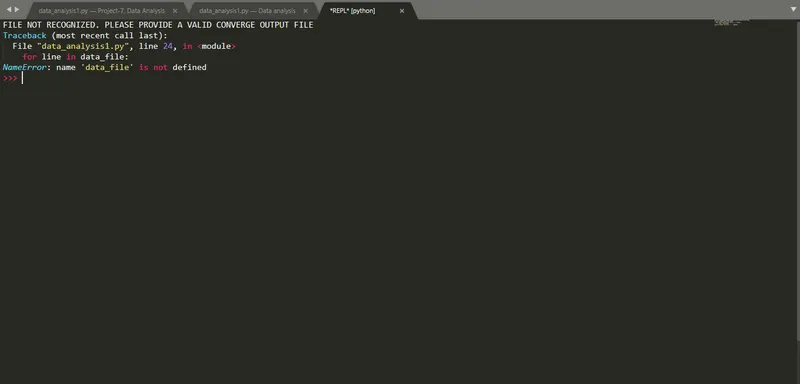
- “try” & “except” command is used for executing task-1, as “try” with “open” command is given to open the desired file and “except” command is given, if the desired file is not in the particular location it will throw an message as per the given code. .(Refer python code)
- Task-2, is carried out by assigning a index value to all the column, which as the particular data stored in that array index. The data type of the array which is converted to float from the default string data type. .(Refer python code)
- The “input” code is used to get the dynamic input, for the index value corresponding to respective parameters. Using that input the plot will be in made in such a manner to study the performance of the engine.
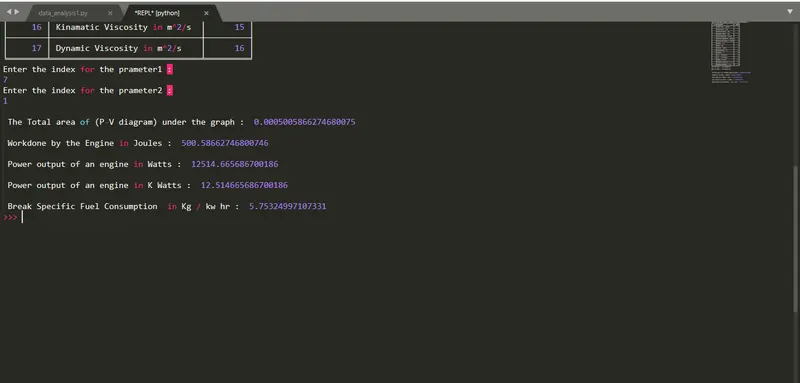
- Task-3, using the data from the given file, The area under P-V plot is calculated using “trapz” code imported from the numpy module. (Refer python code)
- Task-4, using the area under the P-V plot, that denotes the work done by the engine and it is used to calculate the power output of the engine.
`POWER=frac{WORKDONE xx RPM}{60}`
where,
Workdone in KJ
Power in KW
- Taks-5, using the power output and the fuel consumed per stroke the specific fuel consumption will be calculated.
`SFC = frac{FUEL(MASS) xx3600}{POWER}`
where,
Mass of fuel consumed in kg/sec
Power in KW
SFC in `frac{KG}{KW-HR}`
PYTHON CODE WITH EXPLAINATION:
#0FILE PARSING,DATA ANALYSIS WITH A FILE CONTAING THE DATA OF ENGINE PARAMETERS
"""
IMPORT THE MODULE/ LIBRARY REQUIRES FOR THIS PROGRAM
"""
import math
import matplotlib.pyplot as plt
import numpy as np
from tabulate import tabulate

#TASK-1 : READ THE DATA FILE
"""
THE CODE WILL EXIT GRACEFULLY, IF A NON-COMPATIBLE FILE IS PROVIDED AS AN INPUT.
IT WILL DISPLAY SOMETHING LIKE "FILE NOT RECOGNIZED. PLEASE PROVIDE A VALID CONVERGE OUTPUT FILE"
"""

try:
	data_file = open('engine_data.out','r')

except FileNotFoundError:
	print ("FILE NOT RECOGNIZED. PLEASE PROVIDE A VALID CONVERGE OUTPUT FILE")

#DATA FROM THE FILE IS SPLITTED LINEWISE USING FOR-LOOP, AND STORED IN VALUES VARIABLE
values = []
for line in data_file:
	if '#'not in line:
		values.append(line.split())

#THE DATA STORED AS STRINGS WHICH IS CONVERED TO FLOAT
column=np.transpose(values)
column = column.astype(float)

#TASK-2 : THE TABLE LISTS THE RESPECTIVE INDEX FOR THE PARAMETERS
print ("FROM THE BELOW TABLE, CHOOSE THE INDEX FOR THE REQUIRED PARAMERTES : ")
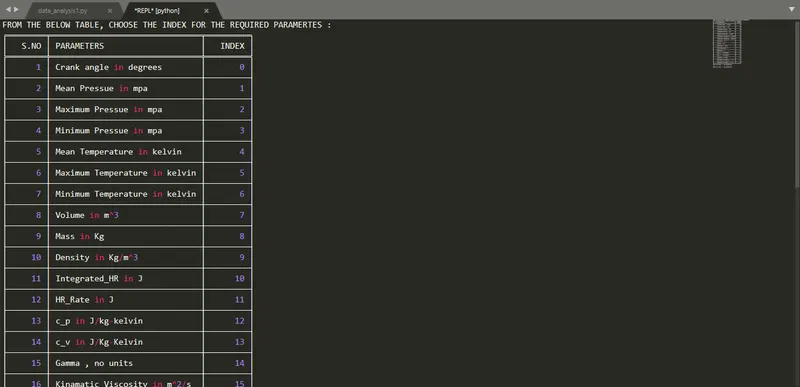
table = [["S.NO", "PARAMETERS", "INDEX"], ["1", "Crank angle in degrees", "0"], ["2", "Mean Pressue in mpa", "1"], ["3", "Maximum Pressue in mpa", "2"], ["4", "Minimum Pressue in mpa", "3"], ["5", "Mean Temperature in kelvin", "4"],["6", "Maximum Temperature in kelvin", "5"], ["7", "Minimum Temperature in kelvin", "6"], ["8", "Volume in m^3", "7"], ["9", "Mass in Kg", "8"], ["10", "Density in Kg/m^3", "9"], ["11", "Integrated_HR in J", "10"], ["12", "HR_Rate in J", "11"], ["13", "c_p in J/kg-kelvin","12"],["14", "c_v in J/Kg-Kelvin", "13"], ["15", "Gamma , no units", "14"], ["16", "Kinamatic Viscosity in m^2/s", "15"], ["17", "Dynamic Viscosity in m^2/s", "16"]]
print (tabulate (table, headers = 'firstrow', tablefmt='fancy_grid'))

#PARAMETERS FOR DISPLAYING IN PLOT GRAPH FOR 'X' & 'Y' LABEL
parameters = ['Crank angle in degrees', 'Mean Pressue in mpa', 'Maximum Pressue in mpa', 'Minimum Pressue in mpa', 'Mean Temperature in kelvin', 'Maximum Temperature in kelvin', 'Minimum Temperature in kelvin', 'Volume in m3', 'Mass in Kg', 'Density','Integrated_HR', 'HR_Rate', 'c_p','c_v', 'Gamma', 'Kinamatic_Viscosity', 'Dynamic_Viscosity']
respective_index = ['Crank angle in degrees=0', 'Mean Pressue in mpa=1', 'Maximum Pressue in mpa=2', 'Minimum Pressue in mpa=3', 'Mean Temperature in kelvin=4', 'Maximum Temperature in kelvin=5', 'Minimum Temperature in kelvin=6', 'Volume in m3=7', 'Mass in Kg=8', 'Density= 9','Integrated_HR= 10', 'HR_Rate= 11', 'c_p= 12','c_v= 13', 'Gamma= 14', 'Kinamatic_Viscosity= 15', 'Dynamic_Viscosity= 16']

#INPUT FOR 'X' & 'Y' INPUT INDEX FOR THE SECOND PARAMETERS
x=int(input ("Enter the index for the prameter1 : n"))
y=int(input ("Enter the index for the prameter2 : n"))

#PLOTTING GRAPH
plt.plot(column[x], column[y], linewidth=5, color='r')
plt.xlabel(parameters[x])
plt.ylabel(parameters[y])
plt.title(parameters[x]+' VS '+parameters[y])
plt.savefig(parameters[x]+' VS '+parameters[y]+'.PNG')
plt.show()

#TASK -3: AREA UNDER PV DIAGRAM OR WORKDONE BY THE ENGINE
volume =column [7]
pressure =column [1]

area=np.trapz(pressure,volume)
print ('n The Total area of (P-V diagram) under the graph : ', area)
w= (area *pow(10,6))
print ('n Workdone by the Engine in Joules : ', w)

#TASK-4: POWER OUTPUT OF THE ENGINE
n=1500 #Revolution per minute
power = (n*w)/60
print ('n Power output of an engine in Watts : ', power)
print ('n Power output of an engine in K Watts : ', power/1000)

#TASK-5: SPECIFIC FUEL CONSUMPTION
mass_fuel=20*pow(10,-6) #COVERTING MICRO GRAMS TO GRAMS
mass_fuel = mass_fuel *pow(10,3) #GRAMS TO KILO GRAMS
#BREAK SPECFIC FUEL CONSUMPTION
bsfc = (mass_fuel *3600) / (power /1000)
print ('n Break Specific Fuel Consumption  in Kg / kw hr : ', bsfc)
OUTPUT AND RESULTS:
- The below image shows the parameters and its respective array index where the data of those parameters are stored.
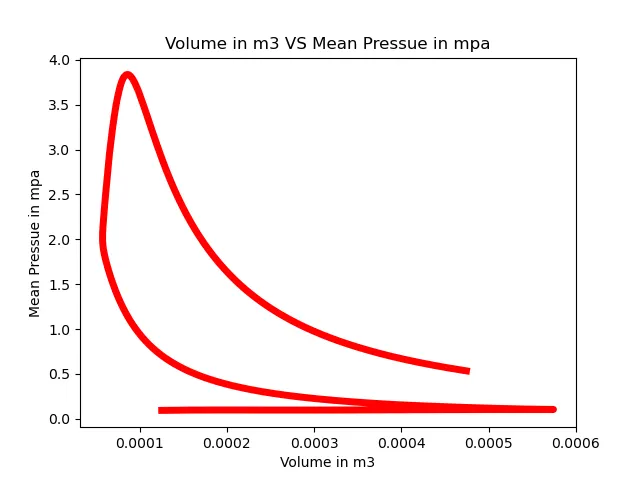
- The below image, shows the dynamic input which is given and the plot of P-V Diagram which is displayed for the choosen parameters (Volume and Pressure), respective index are 7,1.
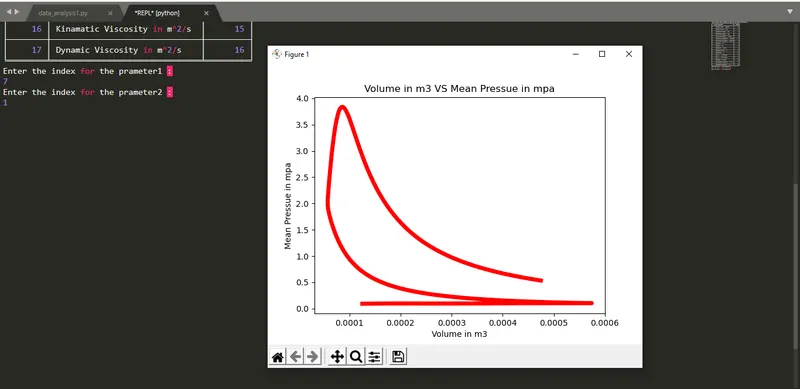
- As the PV plot which is displayed on the above screen because of the plt.show() syntax. After closing that image the next steps wil be executed.
- The below image displays the Workdone, Power output and the specific fuel consumtion of the engine based on the data provided on the "engine_data.out" file.
- The below image displaying the output from "except" command, as the "engine_data.out" file is renamed to other name. Hence, "File not recognized. Please provide a valid CONVERGE output file" is displayed on the screen as coded.
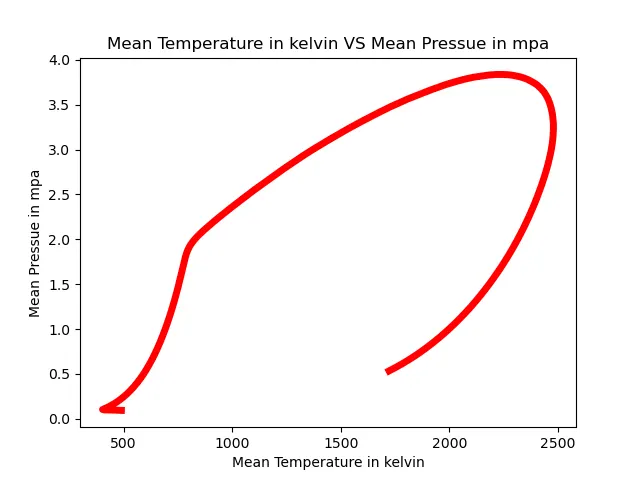
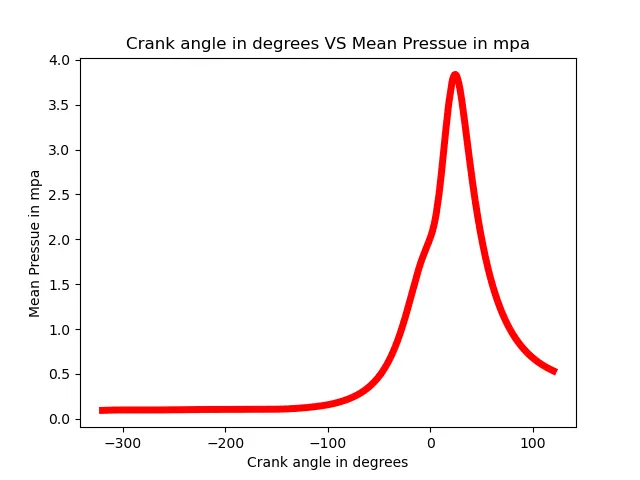
- Below are some of the plots extracted form the data provided on the "engine_data.out" file.
CONCLUSION:
- Hence, the large amount of data stored in a file, can easily studied, compared and analysed, using PYTHON programming language.