ETL and data analysis using Python
Aim: The aim of this challenge is to read the given data file and carry out the necessary analysis using python.
Objectives: The objective of this challenge is to:
- Calculate the area under the P-V diagram.
- Calculate the power output of this engine, assuming that RPM is 1500.
- This engine consumed 20 micrograms of fuel (per 1 stroke cycle). Calculate its specific fuel consumption.
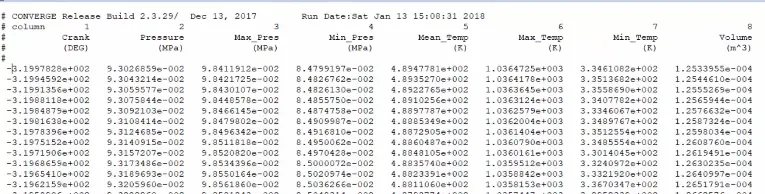
File: The given file is a collection of data obtained from the simulation of an IC engine.
It consists of all the thermodynamic properties of a port fuel-injected engine.
It consists of 17 columns and each column has 8665 values.
Description of file:
Code:
To generate a user-requested plot:
import matplotlib.pyplot as plt
import numpy as np
import math

try:
	f = open('engine_data.out')
	print('File succcessfully opened')

except FileNotFoundError:
	print('File not found, please provide a valid CONVERGE FILE')

with open('engine_data.out') as f:

	l = []
	v = []

	for line in open('engine_data.out'):
		if '#' in line:
			l.append(line.split())
		if '#' not in line:
			v.append(line.split())


	names = (l[2])

	Values = np.transpose(v)
	Values = Values.astype(float)

	print("Enter 0 for Crank; 1 for  Pressure; 2 for Max_Pres; 3 for Min_Pres; 4 for Mean_Temp; 5 for Max_Temp; 6 for Min_Temp; 7 for Volume; 8 for Mass; 9 for Density; 10 for Integrated_HR; 11 for HR_Rate; 12 for C_p; 13 for C_v; 14 for Gamma; 15 for Kin_Visc; 16 for Dyn_Visc")

	x = int(input("Enter x axis parameter"))
	y = int(input("Enter y axis parameter"))
	plt.plot(Values[x],Values[y])
	s1 = names[x+1]
	s2 = names[y+1]
	s = " vs "
	#print(s)
	plt.title(s1+s+s2)
	plt.xlabel(s1)
	plt.ylabel(s2)
	plt.show()
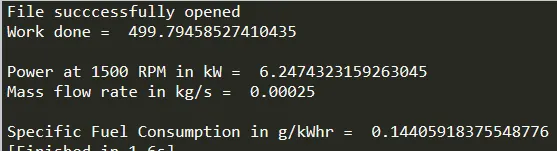
To calculate the area under the PV curve and determine the power output of the engine and SFC at 1500 RPM.
import matplotlib.pyplot as plt
import numpy as np
import math


try:
	f = open('engine_data.out')
	print('File succcessfully opened')

except FileNotFoundError:
	print('File not found, please provide a valid CONVERGE FILE')

l = []
v = []

for line in open('engine_data.out'):
	if '#' in line:
		l.append(line.split())
	if '#' not in line:
		v.append(line.split())

names = (l[2])
Values = np.transpose(v)
Values = Values.astype(float)

p = Values[1];
v = Values[7];

	#Area under the P-V curve
Ar = 0
A = 0
for i in range(1,8665):
	Ar = p[i]*(v[i]-v[i-1])*10**6
	A = A+Ar

print('Work done = ',A)


maximum_v = np.max(v)
index_of_maximum_v = np.where(v == maximum_v)

minimum_v = np.min(v)
index_of_minimum_v = np.where(v == minimum_v)

V_sw = v[2464]-v[7265]
mep = A/(v[2464]-v[7265])
N = 1500


P = (mep*1500*V_sw)/(2*60000)
print('nPower at 1500 RPM in kW = ',P)

r = 20*pow(10,-6)
#When RPM = 1500, no. of strokes is 1500/2 = 750
#No of strokes per second is 750/60 = 12.5
#Mass flow rate mf is mass of fuel consumed per strok times no. of strokes per second
mf = r*12.5
print('Mass flow rate in kg/s = ', mf)
sfc = (mf*3600)/P
print('nSpecific Fuel Consumption in g/kWhr = ',sfc)
Code Explanation:
Reading each line:
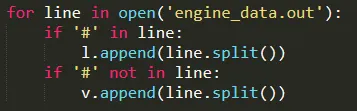
The variable line takes each line in the document 'engine_data.out'
if # is present in the line, then it is added to variable l and # is not present in the line, the values are added to variable v. line.split() splits a string into a list of elements.
Printing l we see a list of lists and each consists of values taken from each line containing #.

The name of each column is present in the third list of l and is accessed using l[2] and is assigned to variable names.

The values of each column are stored in v.

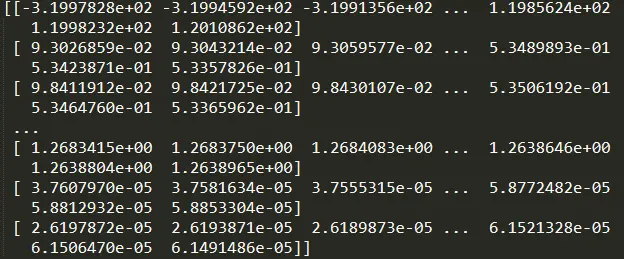
Printing v, we see that it is a list of lists and each list contains values from each column. In order to access all the values from the column, we transpose v using np.transpose(v).

Values.astype(float) converts the string values to float values to allow for further numerical calculations.
Printing Values:
To generate a graph between two user-requested parameters:

User input was taken using input(prompt)
int() was used to convert the string value to integer value.
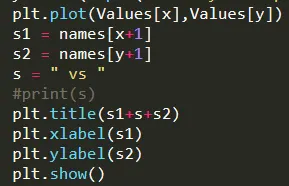
string variable s1 and s2 retrieve the name from list names
Since the first element of names is #, index x+1 and y+1 were used to access column names.

The area under the PV curve:
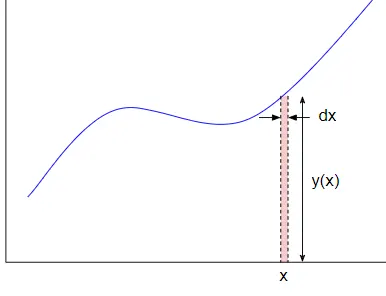
To find the work done or the area under the PV curve, we integrate the sum of areas found using `P*(V(n)-V(n-1))`
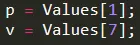
Since Values is a list of list, pressure and volume values are retrieved using Values[1] and Values[7].
Printing Values[1]:

Printing Values[7]:

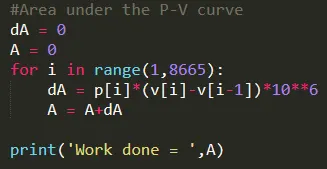
A for loop is created to access all the pressure and volume values, and i is initiated from 1 to 8665.
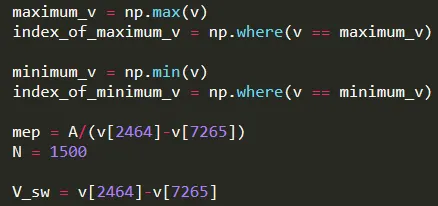
To calculate the mean effective pressure and the swept volume, v max and v min were determined using np.max(v) and np.min(v). The index(position) of the element was determined using np.where().
Max volume was at index 2464 and minimum volume at index 7265.
Swept volume is the difference between v max and v min and the mean effective pressure was calculated by dividing the work done by the swept volume.

The engine power at 1500 RPM was calculated by finding the product of mean effective pressure, RPM, and swept volume and dividing it by 60000.

The mass flow rate was determined based on the fuel consumed for each stroke cycle.
Using the mass flow rate, the Specific fuel consumption of the engine was calculated.
Result:
Code1:

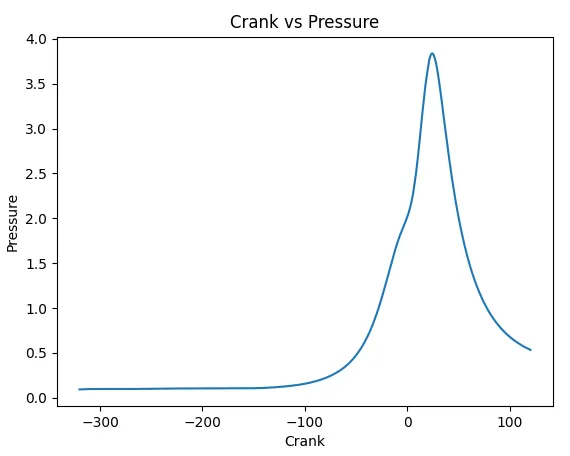
X axis parameter = 0
Y axis parameter = 1
Plot:
Code2:
Conclusion: Relevant data from the given file was parsed and the required numerical calculations and operations were carried out on it.