Week 6 - Data analysis
Data analysis
AIM:
Data visualizer
- The script should take column numbers as the input and plot the respective columns as separate images
- Each file should be saved by the name of the column
- The plot labels should be extracted from the file. If, I request for a plot between column 1 (crank angle) and column 8(volume), then the label information should automatically be extracted and must appear as labels in the plots. THIS SHOULD NOT BE DONE MANUALLY
Compatability check
- The code should exit gracefully, if a non-compatible file is provided as an input. It should say something like "File not recognized. Please provide a valid CONVERGE output file"
Basic performance calculation
- Calculate the area under the P-V diagram. P is in column 2 and V is in column 8.
- Calculate the power output of this engine. Assume that RPM is 1500
- This engine consumed 20 micro grams of fuel (per 1 stroke cycle). Calculate its specific fuel consumption.
PROCEDURE:
1)Initially python program takes the name of the data file as input and both the program code and the data file should be saved in the same folder if not the program will not be excecuted.
2)Then the file is opened and read by program and the data is stored.
3)Then the parameters are given and there coloumns are stored as array.And in code each parameters are given a code or number.
4)The formula to calculate power,specific fuel consumption is given in program to calculate the parameters with the data.
5)These parameters are calculated and displayed at the end of the program.
PROGRAM CODE:
"""
Program of Data Analysis by ABHISHEK M B
"""
#Importing Library

import matplotlib.pyplot as plt
import math
import numpy as np

#Open and Read the file and save the parameters in variable values
try:
	data = open('engine_data.out','r')

except FileNotFoundError:
       print('"File not recongnized.Please provide a valid CONVERGE output file"')

value = []

for line in data:
	if '#' not in line:
		value.append(line.split())

coloumn = np.transpose(value)
coloumn = coloumn.astype(float)

#All Parameters Name
parameter = [ 'Crank','Pressure','Max_Pres','Min_Pres','Mean_Temp','Max_Temp','Min_Temp','Volume','Mass','Density','Integrated_HR','HR_Rate','C_p','C_v','Gamma','Kin_Visc','Dyn_Visc']
print(parameter)
print('These are code name for the following.Please choose')

#Parameters with Codes
corresponding_num = ['Crank=0','Pressure=1','Max_Pres=2','Min_Pres=3','Mean_Temp=4','Max_Temp=5','Min_Temp=6','Volume=7','Mass=8','Density=9','Integrated_HR=10','HR_Rate=11','C_p=12','C_v=13','Gamma=14','Kin_Visc=15','Dyn_Visc=16']
print(corresponding_num)

print("Please press the code for first parameter and press enter:\n")
x = int(input())
print("Please press the code for second parameter and press enter:\n")
y = int(input())

plt.plot(coloumn[x,:],coloumn[y,:],linewidth=1.5,color='red')
plt.xlabel(parameter[x],color='green',fontsize=12)
plt.ylabel(parameter[y],color='green',fontsize=12)
plt.title(parameter[y]+'   VS   '+parameter[x],color='black',fontsize=15)
plt.savefig(parameter[y]+'VS'+parameter[x]+'.png')

#Calculating area under p-v curve
volume = coloumn[7,:]
pressure = coloumn[1,:]*pow(10,6)

work = []

for i in range(0,8664):
	work.append((volume[i+1]-volume[i])*(pressure[i+1]+pressure[i])*0.5)

work_done=0
for j in range(0,len(work)):
	work_done = work_done + work[j]

print('work done is:',work_done,'J')

#Calculation of Power
speed = 1500/60
power=work_done*speed
print('power:',power/1000,'KW')

#Calculation of Specific Fuel Consumption
m_f=20*pow(10,-6)
bsfc = (m_f*3600)/power
print('specific fuel consimption:',bsfc,'gm/KWhr')
PLOTS OBTAINED:
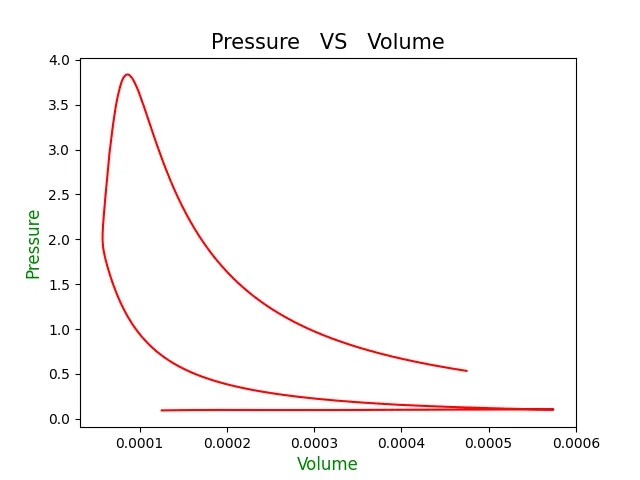
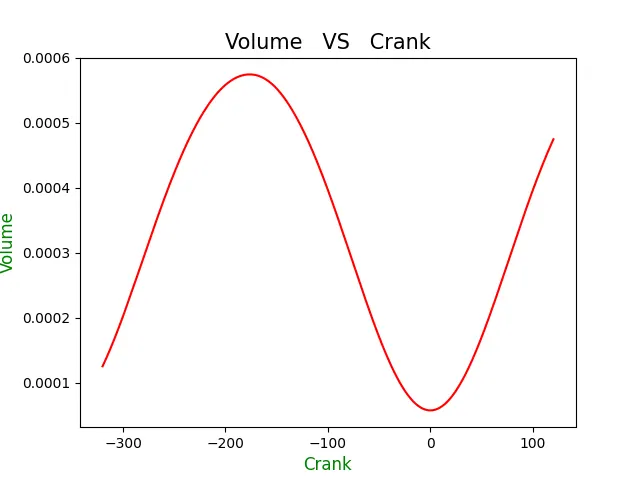
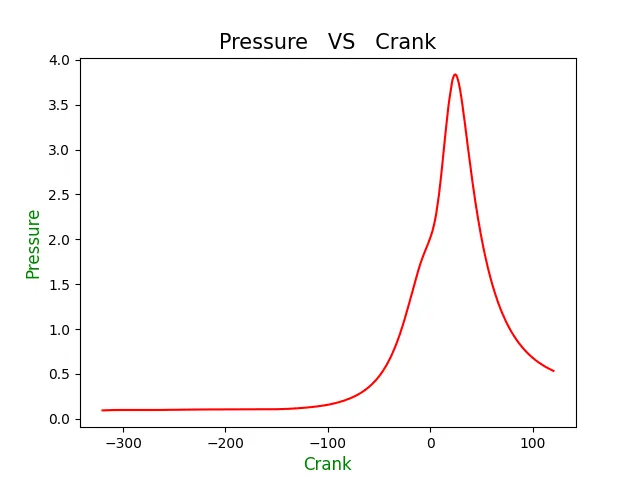
RESULTS:
1)The data from the file was read successfully and the required plots were made by the program.
2)The calculations were done and displayed , the results are
Area under PV diagram(work done) =500.58662746800763 J
power =12.51466568670019 KW
specific fuel consimption =5.753249971073308 e-06 gm/KWhr