Modelling and simulation of flow through a flowbench
PROJECT NAME : Modelling and Simulation of flow through a Flowbench
AIM: To create a 3D model of a flow bench and run flow analysis and also to obtain a plot of lift vs mass flow rate.
INTRODUCTION:
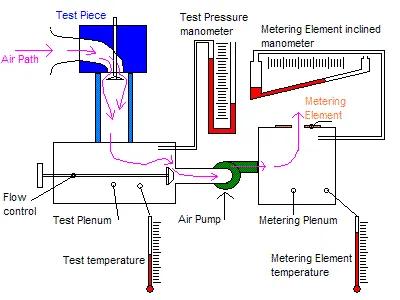
An air flow bench is a device used for testing the internal aerodynamic qualities of an engine component and is related to the more familiar wind tunnel.
A flow bench consists of an air pump of some sort, a metering element, pressure and temperature measuring instruments such as manometers, and various controls. The test piece is attached in series with the pump and measuring element and air is pumped through the whole system. Therefore, all the air passing through the metering element also passes through the test piece. Because the volume flow rate through the metering element is known and the flow through the test piece is the same, it is also known. The mass flow rate can be calculated using the known pressure and temperature data to calculate air densities, and multiplying by the volume flow rate.
PROCEDURE:
STEP 1: Select Top Plane and sketch a circle of radius 0.05m and extrude it into the downward direction to 0.10m.
STEP 2: Select Front Plane and select line tool and sketch a circular inlet port with the help of line tool and sweep tool.
STEP 3: Create shell of 0.0002m for the circular inlet port and outlet port.
STEP 4: Create axis on the exit part of inlet port with the help of Refrence Geometry.
STEP 5: With the help of Refrence Geometry create plane at the exit of inlet port and sketch a valve with the help of axis and click revolve tool.Add constrains to valve geometry.
STEP 6: Create Lids to both inlet and outlet port and save the file.
STEP 7: Now open flow simulation wizard and give project name ->si units ->internal flow ->select fluid as air ->click ok.
SREP 8: Click on Boundary condition and click on insert boundary condition and give total inlet pressure of 401325Pa and static outlet pressure of 101325Pa.
STEP 9: Add global goals of mass flow rate and surface goals of mass flow rate by selecting the lid at outlet port.
STEP 9: In global mesh settingd give intial mesh as 3. Also add cut plot and run a baseline simulation.
STEP 10: Open new parametric study and give dimension parameter and click on valve lift of 0.001m and click range with numbers upto 0.008m and give 7 values so it will be divided into 7 values.
STEP 11: Add goals and cut plots and run the simulation.You will get the results.
RESULTS:
GRID DEPENDENCY TEST:
Consider valve lift=0.001m
CASE 1: Velocity plot at grid level 3.
CASE 2: Velocity plot at grid level 5.
CASE 3: Velocity plot at grid level 7.
In these 3 above cases results more smoother in grid level 5.So it is good to perform flow simulation at grid dependency level 5.
EFFECT OF VALVE LIFT ON MASS FLOW RATE: To know the effect of valve lift on mass flow rate we have increase the valve lift from 1mm to 8mm with equal intervals and also with global mesh level 5.
Valve lift at 0.001m
velocity plot
At valve lift 0.001m the velocity is more near the valve and less after that because there is very less gap between valve and cylinder for fluid to pass through it.
Pressure plot
At valve lift 0.001m the pressure is more at the inlet to valve and less after that because there is small gap for fluid to enter between valve and cylinder.
Valve lift at 0.0021m
Velocity plot
At valve lift 0.0021m the velocity is slightly more near the inlet port when compared to previous plot and more near the valve because the valve is opened a bit.
Pressure plot
At valve lift of 0.0021m the pressure is more before the valve and it is less after the valve because still the gap between the valve and cylinder is less.
Valve lift at 0.0033m
Velocity plot
Here the velocity is bit high compared to previous plot and also it is high near the valve and goes on decreasing after entering.
Pressure plot
Here the pressure is more near the inlet port to valve and goes on decreasing after entering through the valve.
Valve lift at 0.0045m
Velocity plot
c
Pressure plot
Here the pressure is more near the inlet port to valve and goes on decreasing after entering through the valve.
Valve lift at 0.0056m
Velocity plot
Here the velocity is more from inlet port to valve compared to previous plot and still more near the valve and goes on decreasing after entering through valve.
Pressure plot
Here the pressure is more near the inlet port to valve and goes on decreasing after entering through the valve.
Valve lift at 0.0068m
Velocity plot
Here the velocity is more from inlet port to valve compared to previous plot and still more near the valve and goes on decreasing after entering through valve.
Pressure plot
Here the pressure is more near the inlet port and gets slightly low near the valve and goes on decreasing after entering through the valve.
Valve lift at 0.008m
Velocity Plot
The velocity is low at inlet port and gets bit higher near the valve and high at the entering the valve and goes on decreasing slowly after entering the valve.
Pressure Plot
Here the pressure is more near the inlet port and gets slightly low near the valve and goes on decreasing after entering through the valve.
Goal Plot
As the valve lift increases the mass flow rate also increases.
FLOW TRAJECTORY:
At Valve Lift 0.001m:
Velocity Contour:
Pressure Contour:
At Valve Lift 0.0021m:
Velocity Contour:
Pressure Contour:
At Valve Lift 0.0033m:
Velocity Contour:
Pressure Contour:
At Valve Lift 0.0045m:
Velocity Contour:
Pressure Contour:
At Valve Lift 0.0056m:
Velocity Contour:
Pressure Contour:
At Valve Lift 0.0068m:
Velocity Contour:
Pressure Contour:
At Valve Lift 0.008m:
Velocity Contour:
Pressure Contour:
CONCLUSION:
Grid Dependency Test:
The test was done for level 3,5 and 7 initial mesh.As per my observation the results were smoother and detailed in level 5.So level 5 was choosed to conduct flow simulation of flowbench.
Mass flow rate v/s Valve Lift:
Initially at valve lift 0.001m the little gap between valve and cylinder results in high velocity near the valve opening and high pressure near the inlet .Hence mass flow rate is low at this point.
As the valve lift increases the the gap between valve and cylinder increases ,thus the velocity and pressure decreases near the valve and inlet respectively and results in increase of mass flow rate.
Therefore,As the Valve Lift increases the Mass flow Rate also increases.
Flow Trajectory:
The flow trajectories shown in the above fig.As per my observation the velocity is high near the valve opening point and goes on decreasing whereas the pressure is high at the entry of inlet to the valve and then goes on decreasing.