Week 6 - Data analysis
AIM: To write a code for compatibility check
To write a code for data visualizer
To write a code for calculating the area under PV graph, power, and specific fuel consumption
case1; compatibility check
we have used 'try' block command for the test run of our given data by specifying its file name. if the file name matches with your code then print fille is recognized. we use 'except' block to handle the error if the file name is doesn't matches then print file is not recognized
case2: Appending the data with respect to their properties
As we need to get the input from the user so we create two empty arrays named column1 and column2.Then we declare two variables i and j where we actually get it from user as input. we need to specify the title name of the properties like a crank, pressure etc.

in the above figure, we can see clearly that the properties name starts at 1st indentation and their values starts at indentation 0. so we need to code respectively. initially, we need to open our given data in the for loop and use the split command to split the line with space( ie: i+1 and j+1 from user)as title1,title2 respectively. this can be used for the title in the plot and to save the figure with their tiltle1 vs tiltle2. again split command is used to split the remaining strings as columns then all the values are appended in column1 and coloumn2 were created initially with respective to their title names.
for instance, I have given input as 0 and 7 my output will be
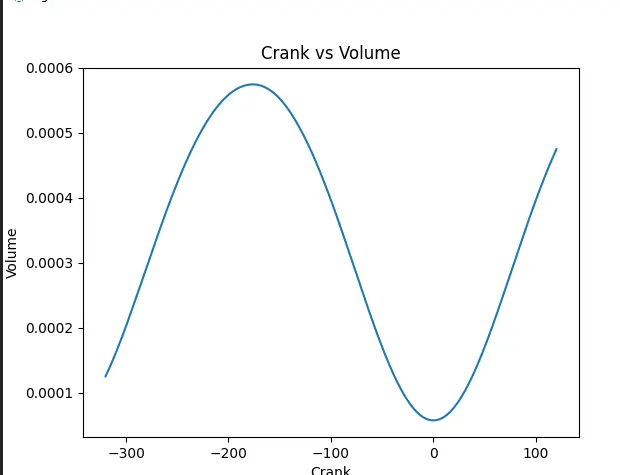
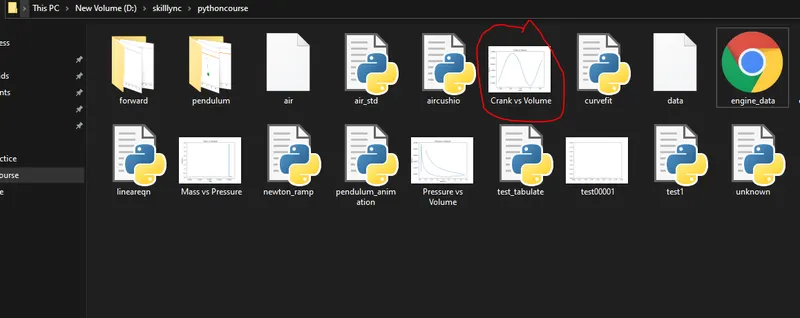
and the plot get saved in the folder with their title names
case3:Basic performance calculation.
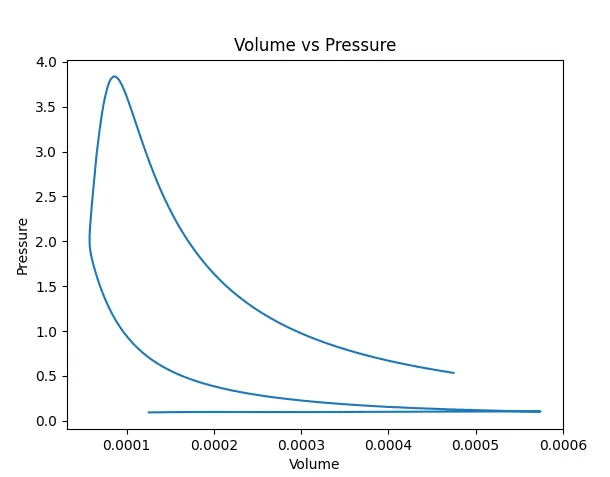
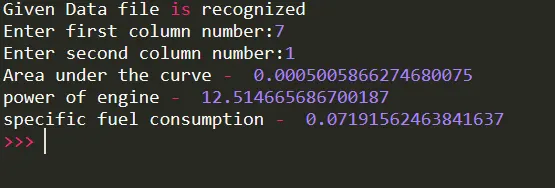
we need to find the area under the PV graph, so as mentioned we generally append the values for pressure at the 2nd column and volume at the 8th column. Then we use trapz command from numpy module to calculate the area under the graph. after calculating the area we need to calculate the power with formulae mentioned below and finally, we need to calculate the specific fuel consumption using the power which is calculated above.
final output:
formulae used :
Power = `Areaxx1000xx(RPM)/60`
specific fuel consumption = `((m_f)xx(3600))/((BP)xx(0.
import math
import matplotlib.pyplot as plt
import numpy as np

#compatability check
try:
	data=open('engine_data.out')
	print("Given Data file is recognized")
except:
	print("File not recognized. Please provide a valid CONVERGE output file")


#appemding the data WRT their properties

column1=[]
column2=[]
i=int(input("Enter first column number:"))
j=int(input("Enter second column number:"))
count=0
for line in open('engine_data.out'):
	if count==2:
		title1=line.split()[i+1]
		title2=line.split()[j+1]
	count=count+1

	if'#' not in line:
		column1.append(float(line.split()[i]))
		column2.append(float(line.split()[j]))


#ploting


filename=title1+' vs '+title2
plt.figure()
plt.plot(column1,column2)
plt.xlabel(title1)
plt.ylabel(title2)
plt.title(filename)

plt.savefig(filename)

plt.show()


#area under the graph amd specic fuel consuption formulae
pressure=[]
volume=[]
for line in open('engine_data.out'):
	if'#' not in line:
		pressure.append(float(line.split()[1]))
		volume.append(float(line.split()[7]))

area= np.trapz(pressure,volume)
print("Area under the curve - ",area)

rpm=1500
rps=rpm/60
power=area*rps*1000
print("power of engine - ",power)

sfc=(20*pow(10,-6)*3600)/(0.08*power)
print("specific fuel consumption - ",sfc)
conclusion: Thus we have satisfied all the cases and calculated our requirements