Project 1 - Parsing NASA thermodynamic data
AIM: To write a program to parse the data from a nasa file and to calculate the molecular weight of all species
Formulae used
High temperature coefficient
`C_P=[A_1+(A_2×t)+(A_3×t^2 )+(A_4 ×t^3 )+(A_5×t^4 )]×r`
`H=[A_1+(A_2×(t/2))+(A_3×(t^2/3))+(A_4×(t^3/4))+(A_5 ×(t^4/5))+(A_6/t)]×r×t`
`S=[A_1 〖×log〗t+(A_2×t)+(A_3×(t^2/2))+(A_4×(t^3/3))+(A_5 ×(t^4/4))+A_7 ]×t`
Low temperature coefficient
`C_P=[A_8+(A_9×t)+(A_10×t^2 )+(A_11 ×t^3 )+(A_12×t^4 )]×r`
`H=[A_8+(A_9×(t/2))+(A_10×(t^2/3))+(A_11×(t^3/4))+(A_12 ×(t^4/5))+(A_13/t)]×r×t`
`S=[A_8 〖×log〗t+(A_9×t)+(A_10×(t^2/2))+(A_11×(t^3/3))+(A_12 ×(t^4/4))+A_14 ]×t`
Procedure
- initially we have to save the THERMO .dat file in our program file of matlab path
- Then we have to read the file using fopen command and r to read the THERMO .dat file in matlab
- The whole THERMO .dat is a string file , so all the content is in string format
- We have to get the local temperatures of the individual species [using fgetl] that is been in the order of is local low temperature ,local high temperatures ,local mid temperatures in respective position
- We use strsplit to split as individual array with providing a space ‘ ‘,this space get the cell array of 1x1
- So from that we can easily get the three temp of that line ,but still it is an string ,so we use strdouble to convert it into a value
- we can use this process for getting the species name too, which is situated in first position
- next we have to get all fourteen coefficients
- for that we have to use an command called findstr which is use to identify a particular character inside the string
- we use that command to find character ‘E’ inside the string
- this character can define each coefficient position by suffix and prefix length
- for this we need initially get that lines using f getl command
- Then we have to use this coefficients to calculate the specific heat,enthalpy,entropy
- Using the low temp and high temp in linspace ,here we have to apply a condition before calculating it
- if the temperature is more than local low temperature then it should subtitute in first seven coefficient of else it should substitute in last seven coefficients
- This has to be done for all the 53 species inside the file ,so we need to run this whole procedure in side the for loop
- Inside the for loop we should use another loop for calculating ,cp,s,h for all the species
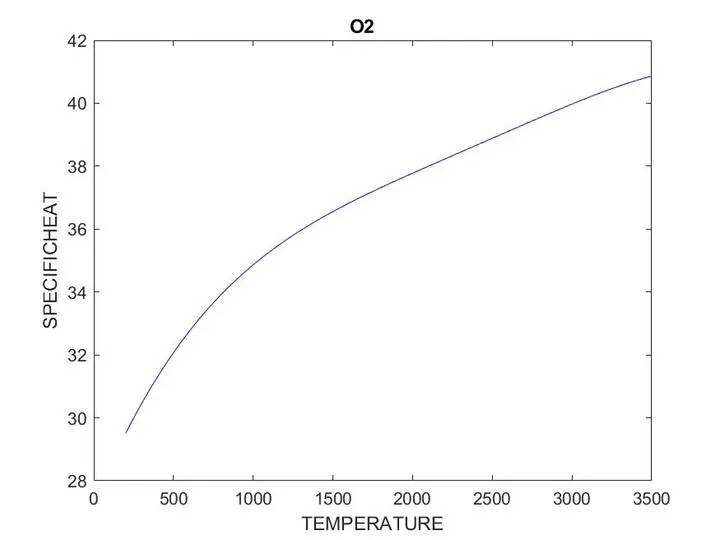
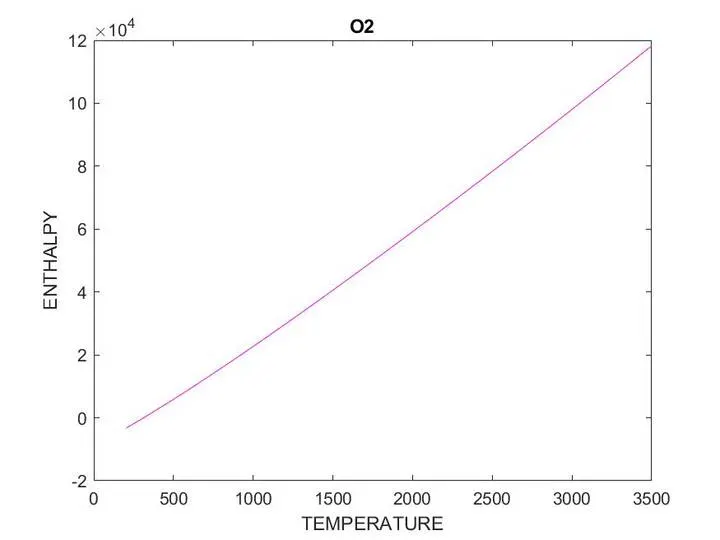
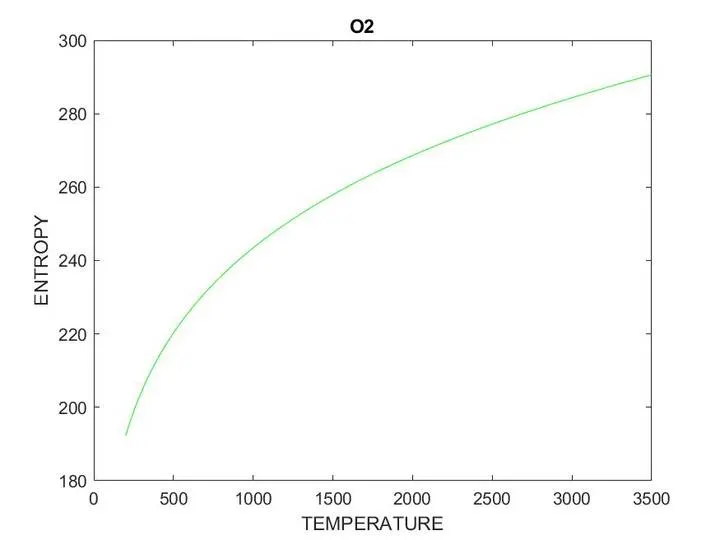
- Then we have to plot them individually vs temperature
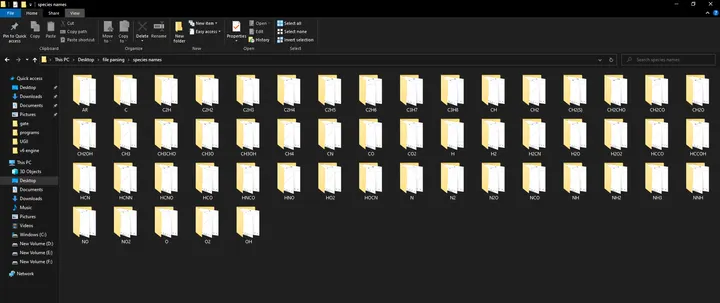
- The next part of the project is to save the plots in separate folder of their respective species
- So we use the mkdir to make new directory to save them respectively in eary created folder
- We use that location directory inside mkdir and for the name of the folders we use species names as we have defined above
- us cd command to close the directory and save as command to save the plots in respective folders
- next we have to calculate molecular weight of all species in our file
- for that we need to program a simple function code which takes the input as species name ,which define all elements and its atomic weight seperatly and we should use strcmpi to compare those elements with respective atm weights,we have understand the position logic here to add the species and multiply if there is any numbers with its prefix element
- we use for loop to execute the same for all remaining species
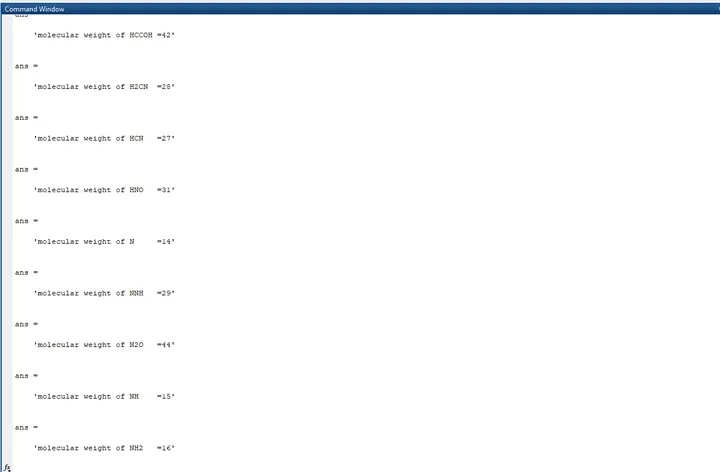
- Then we should call the function and use sprintf command to print it inividually in command window
Outputs
sceren shot of saved folders
plots of O2
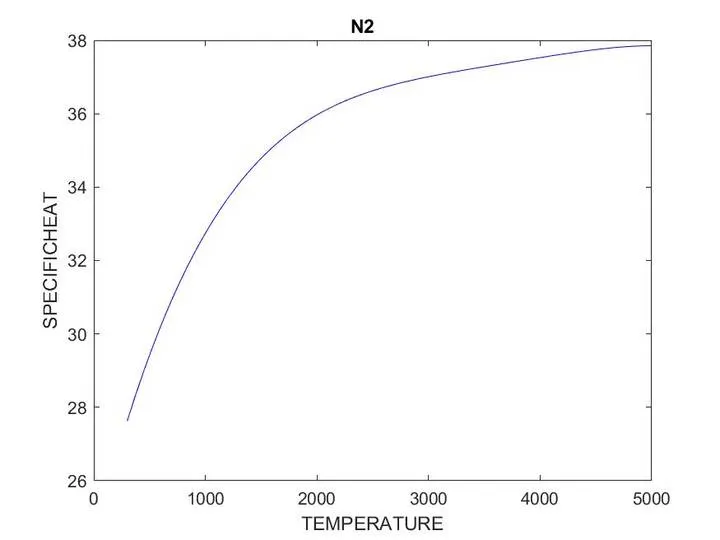
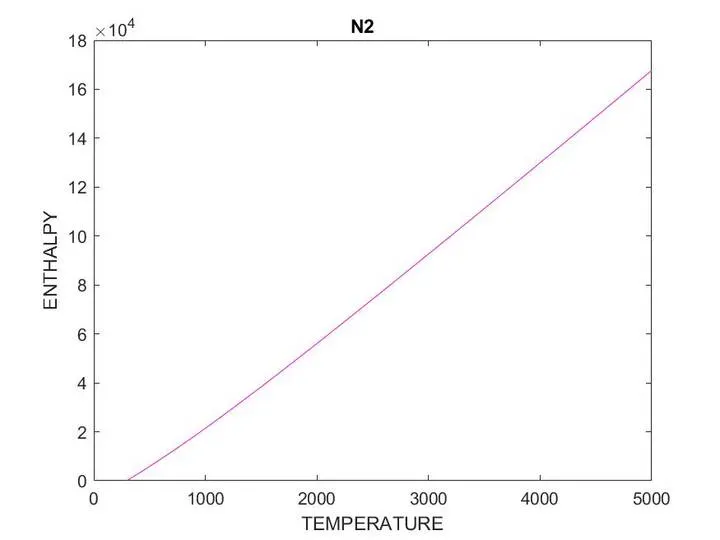
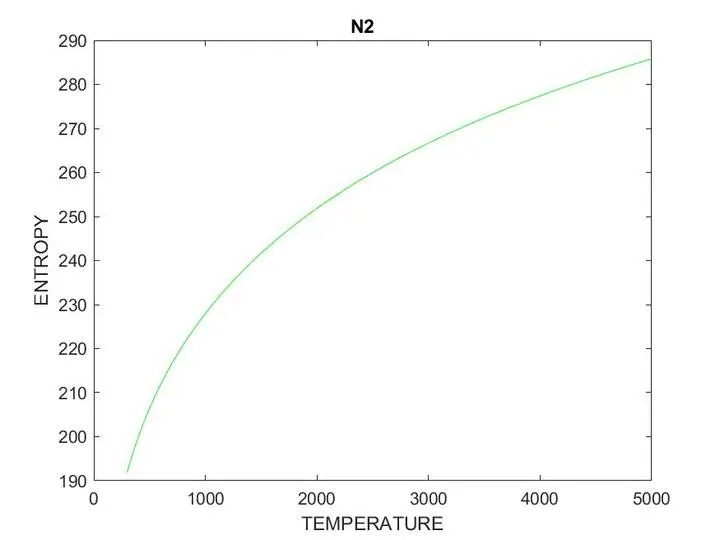
plots of N2
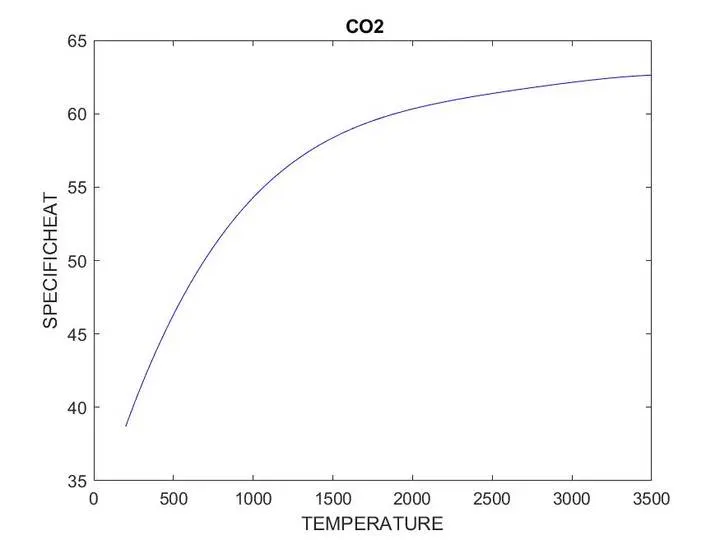
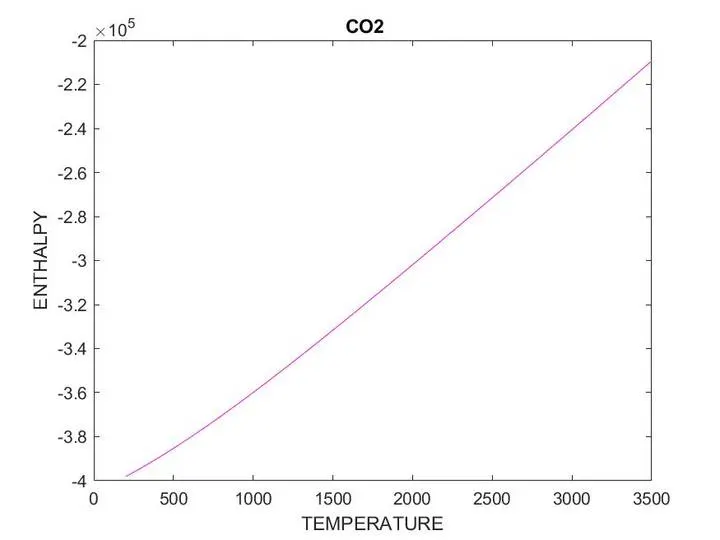
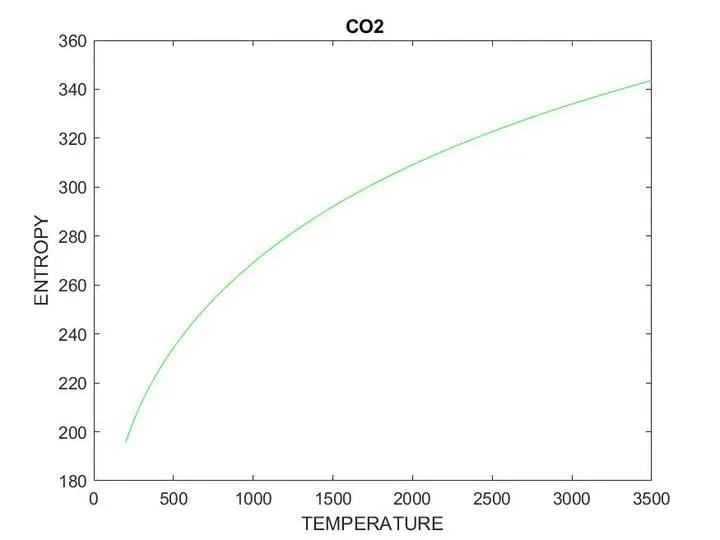
plots of CO2
Molecular weights



molecular weights screen shot
MAIN PROGRAM
clear all
close all
clc


f1=fopen('THERMO.dat','r');
%skipping lines
for i=1:5
   a= fgetl(f1);
end

    for k=1:53

b=fgetl(f1);
c=strsplit(b,' ');
species_name=b(1:6);
l=length(c);
local_lowtemp= str2double(c(l-3));
local_hightemp= str2double(c(l-2));
local_midtemp= str2double(c(l-1));
%gettinf all fourteen coeffient using findstr command
coeff=fgetl(f1);
a=findstr(coeff,'E');
a1=coeff(1:a(1)+3);
a1=str2double(a1);
a2=coeff(a(1)+4:a(2)+3);
a2=str2double(a2);
a3=coeff(a(2)+4:a(3)+3);
a3=str2double(a3);
a4=coeff(a(3)+4:a(4)+3);
a4=str2double(a4);
a5=coeff(a(4)+4:a(5)+3);
a5=str2double(a5);

coeff2=fgetl(f1);
a=findstr(coeff2,'E');

a6=coeff2(1:a(1)+3);
a6=str2double(a6);
a7=coeff2(a(1)+4:a(2)+3);
a7=str2double(a7);
a8=coeff2(a(2)+4:a(3)+3);
a8=str2double(a8);
a9=coeff2(a(3)+4:a(4)+3);
a9=str2double(a9);
a10=coeff2(a(4)+4:a(5)+3);
a10=str2double(a10);

coeff3=fgetl(f1);
a=findstr(coeff3,'E');

a11=coeff3(1:a(1)+3);
a11=str2double(a11);
a12=coeff3(a(1)+4:a(2)+3);
a12=str2double(a12);
a13=coeff3(a(2)+4:a(3)+3);
a13=str2double(a13);
a14=coeff3(a(3)+4:a(4)+3);
a14=str2double(a14);

molecular_weight=mol_weight(species_name);
        sprintf('molecular weight of %s=%d',species_name,molecular_weight)


mkdir(['C:\Users\hp\Desktop\file parsing\species names\',species_name]);
t=linspace(local_lowtemp,local_hightemp,500);
r=8.31;
for m=1:length(t)
    %formulae for calculating specific heat ,enthalpyand entropy
    if(t<local_midtemp)

        cp=(a8+(a9.*t)+(a10.*(t.^2))+(a11.*(t.^3))+(a12.*(t.^4)))*r;
            h=(a8+((a9.*t)/2)+((a10.*(t.^2))/3)+((a11.*(t.^3))/4)+((a12.*(t.^4))/5)+(a13./t)).*(r.*t);
            s=((a8.*log(t))+(a9.*t)+(a10.*((t.^2)/2))+(a11.*((t.^3)/3))+(a12.*((t.^4)/4))+a14)*r;


    else
            cp=(a1+(a2.*t)+(a3.*(t.^2))+(a4.*(t.^3))+(a5.*(t.^4)))*r;
            h=(a1+((a2.*t)/2)+((a3.*(t.^2))/3)+((a4.*(t.^3))/4)+((a5.*(t.^4))/5)+(a6./t)).*(r.*t);
            s=((a1.*log(t))+(a2.*t)+(a3.*((t.^2)/2))+(a4.*((t.^3)/3))+(a5.*((t.^4)/4))+a7)*r;


        end


end
%ploting for the individual
    figure(1)
    plot(t,cp,'color','b')
    title(species_name)
    xlabel('TEMPERATURE')
    ylabel('SPECIFICHEAT')
     figure(2)
    plot(t,h,'color','m')
    title(species_name)
    xlabel('TEMPERATURE')
    ylabel('ENTHALPY')
     figure(3)
    plot(t,s,'color','g')
    title(species_name)
    xlabel('TEMPERATURE')
    ylabel('ENTROPY')

      cd(['C:\Users\hp\Desktop\file parsing\species names\',species_name]);
saveas( 1,'t vs cp','jpeg');
        saveas( 2,'t vs h','jpeg');
           saveas( 3,'t vs s','jpeg');


    end
FUNCTION CODE
function [mol_wt]=mol_weight(species_name)
element=['H','C','O','N','S','A'];
atm_wt=[1 12 16 14 32 40];


mol_wt=0;
for i=1:length(species_name)

    for j= 1:length(element)

       if strcmpi(species_name(i),element(j));
           mol_wt=mol_wt+atm_wt(j);

           c=j;
       end
    end
    n=str2double(species_name(i));
    if n>1
        mol_wt=mol_wt+(atm_wt(c))*(n-1);
    end
end
end