Week 6 - Data analysis
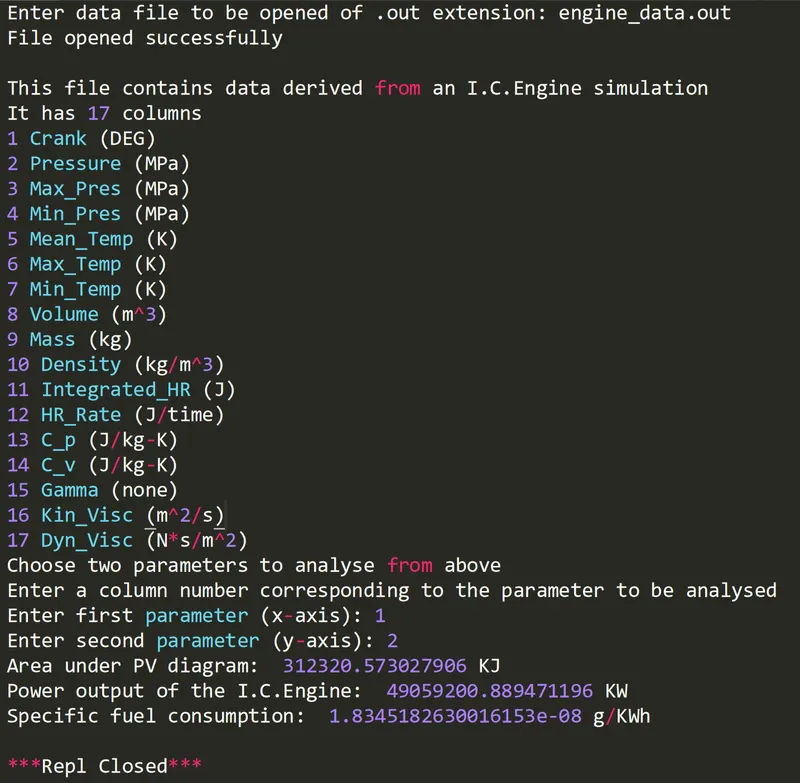
A simulation was performed on an I.C.Engine resulting in a data file with thermodynamic properties of the engine during that simulation. The objective is to extract the respective parameters' data and plot them to visualize their dependancies. The code is as follows:
import matplotlib.pyplot as plt
import math
import numpy as np
from numpy import trapz

# Input
line_ct = 1
filename = input('Enter data file to be opened of .out extension: ')

# Check if file is compatible
try:
	file = open(filename,'r')
	print('File opened successfully')
except:
	print('File does not exist or format not supported. Please enter a valid filename')

# Showing what thermodynamic properties are present in the data file to choose from
for line in file:
	if line_ct == 3:
		headers = line.split()
		columns = len(headers)
		print('\nThis file contains data derived from an I.C.Engine simulation')
		print('It has %d columns' %(columns-1))

		for Line in file:
			if line_ct == 4:
				header_unit = Line.split()
			break

		for column in range(1,columns):
			print(column,line.split()[column],Line.split()[column])
		break
	line_ct += 1

print('Choose two parameters to analyse from above')
print('Enter a column number corresponding to the parameter to be analysed')

# Input column number/parameters which one wants to analyse
x = int(input("Enter first parameter (x-axis): "))
y = int(input("Enter second parameter (y-axis): "))

x_data = []
y_data = []

# Extracting the labels for the plots from the file
line_ct = 1
for line in open(filename,'r'):
	if line_ct == 3:
		X_label = line.split()[x]
		Y_label = line.split()[y]

		if line_ct <= 4:
			x_label = line.split()[x] + Line.split()[x]
			y_label = line.split()[y] + Line.split()[y]

	if '#' not in line:
		x_data.append(float(line.split()[x-1]))
		y_data.append(float(line.split()[y-1]))

	line_ct += 1

file_name = Y_label + 'vs' + X_label + '.png'

# Plotting results
plt.figure()
plt.plot(x_data,y_data)
plt.xlabel(x_label)
plt.ylabel(y_label)
plt.title(Y_label + ' vs ' + X_label)
plt.savefig(file_name)
plt.show()

# Calculating area under plot using trapezium rule
RPM = 1500
Area = np.trapz(y_data,x_data)
Work = Area*1000
# Calculating power output of the engine
Power = 2*math.pi*RPM*Work/60
# Calculating specific fuel consumption
Fuel_per_stroke = 20*1e-6
Fuel_per_sec = Fuel_per_stroke*RPM*(0.5/60)
Fuel_per_hour = Fuel_per_sec*3600
BSFC = Fuel_per_hour/Power

print('Area under PV diagram: ', Work,'KJ')
print('Power output of the I.C.Engine: ',Power,'KW')
print('Specific fuel consumption: ',BSFC,'g/KWh')
Code Explanation:
The required modules were imported. First a compatibility check is done using the 'try-except' command where the user has to input the file name. Then we go on to open the file in read mode and print how many parameters and what they are along with their units so the user can choose which two parameters he/she wants to analyze. Once the user inputs the parameters, I extracted the name of the column along with its units so as to use this later in the plots. Finally the data under the column was extracted simply using the split() function. Plotting was done and the appropriate labels and titles were used from the extracted ones. Area under PV curve was calculated using the numpy.trapz function. This function uses the trapezoidal rule to calculate area under the graph. Alternatively one can use 'from scipy.integrate import simps' function to calculate area under the curve via Simpson's rule. Finally specific fuel consumption was calculated from the given data of RPM and fuel per stroke.
It must be noted that SublimeText cannot by itself run an input type user interactive code. Therefore SublimeREPL was installed and used to run the code.
Compatibility Check:
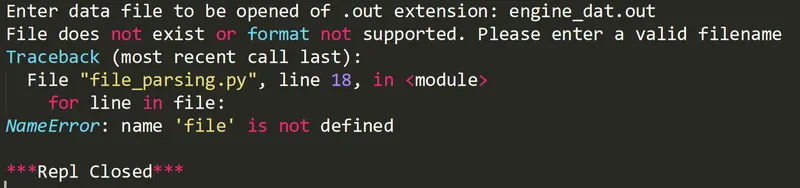
There was an error in the file name and hence the code requests to provide a valid file name.
Result:
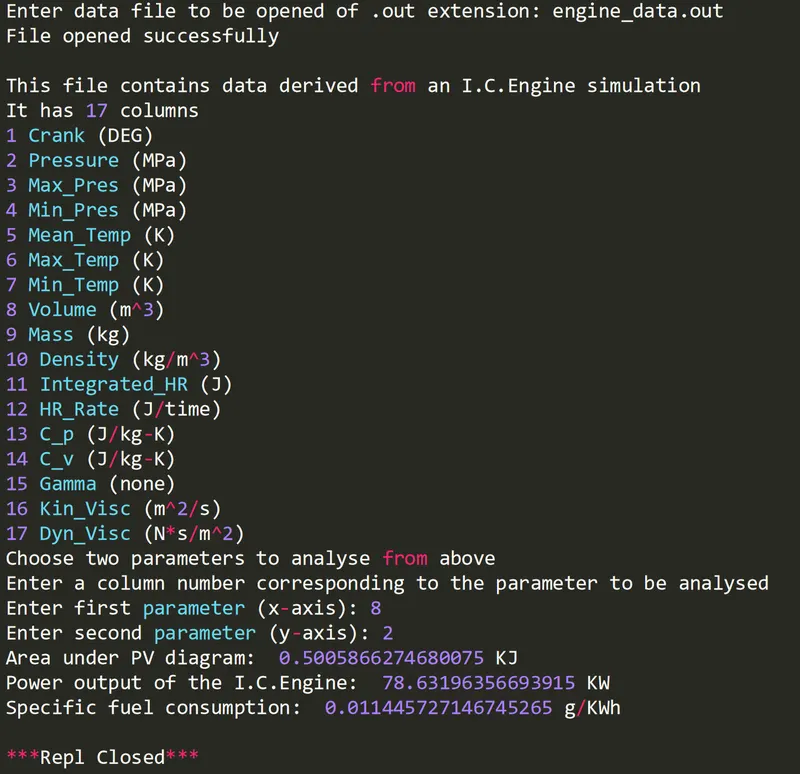
Data Visulization:
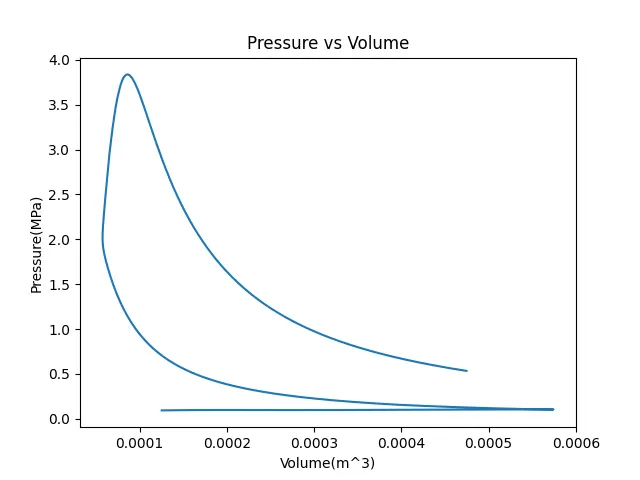
PV Diagram:
Effect of Crank on Pressure:
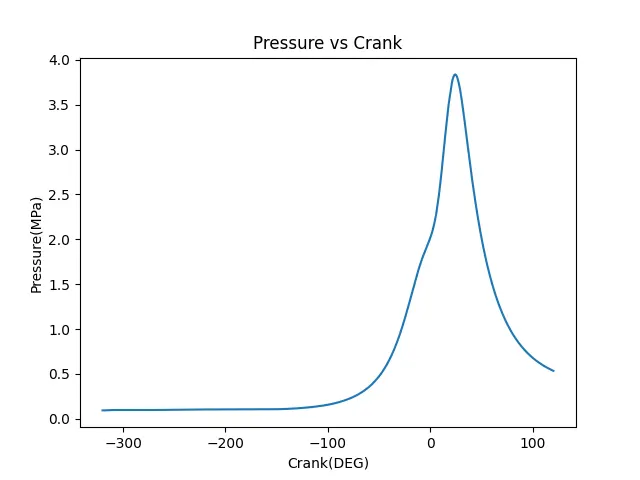
Resulting Area, Power and BSFC can be seen below: