Week 6 - Data analysis
Aim:
- The script should take column numbers as the input and plot the respective columns as separate images
- Each file should be saved by the name of the column
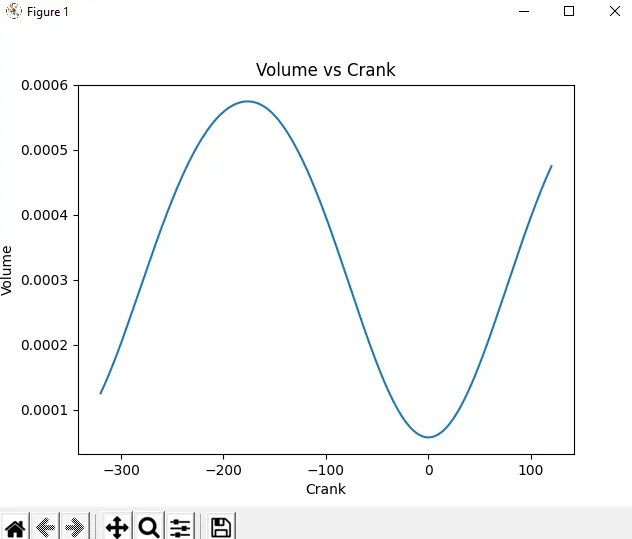
- The plot labels should be extracted from the file. If I request a plot between column 1 (crank angle) and column 8(volume), then the label information should automatically be extracted and must appear as labels in the plots.
Procedure:
1. The following python code is written-
import math
import numpy as np
from scipy.integrate import simps
import matplotlib.pyplot as plt
import os
import sys

#The code starts

def file():
    input_file = input('Enter the file name: ')
    x = input_file.split('.')
    if(x[1] != 'out'):
        print("File not recognized. Please provide a valid CONVERGE output file")
        return file()
    return(input_file)

try:
    input_filename = file()
    fileopened = open(input_filename)
except:
    print('The Input file is not found')
    sys.exit(1)

i = input('Enter 1st column: ')
j = input('Enter 2nd column: ')

parameter1 = []
parameter2= []
count = 1
col1name = 'none'
col2name = 'none'
for line in open(input_filename):

    if(count == 3):
        col1name = line.split()[int(i)]
        col2name = line.split()[int(j)]
    if '#' not in line:
        parameter1.append(float(line.split()[int(i)-1]))
        parameter2.append(float(line.split()[int(j)-1]))

    count=count+1

pressure =[]
volume = []

for line in open(input_filename):

    if '#' not in line:
        pressure.append(float(line.split()[1]))
        volume.append(float(line.split()[7]))

area=float(simps(pressure, volume))

print('area:' + str(area))

rpm = 1500
speed = rpm/60
power = speed*area
print('power output: ' + str(power))

FuelMass = 20*pow(10, -6)
specfuel = FuelMass/power
print('specific fuel consumption : ' + str(specfuel))


plt.plot(parameter1, parameter2)
plt.xlabel(col1name)
plt.ylabel(col2name)
file_name = str(col2name) + ' vs ' + str(col1name)
plt.title(file_name)
plt.savefig(file_name + '.png')
plt.show()
plt.clf()
Code explanation-
The required methods are imported. A function is created and the required file is been asked here to enter by the user and see whether the input file is valid or not. Next, the file is read and required inputs are asked to the user. Next, the 2 empty arrays are created and the values of a parameter of the engine are stored in them according to the column entered by the user. Next, the area under the PV diagram, the specific fuel consumption of the engine, and power output of the engine is calculated using the required formulas and are stored in variables. Next, the plot required is plotted with respect to the values entered by the user.
Results:
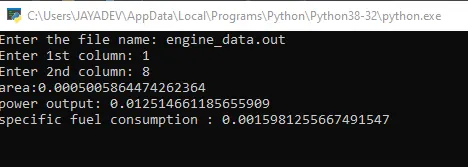
Pressure vs volume graph:
Conclusion:
A python has been written to read the given data file and draw the plots between different properties of the engine. The area under the PV diagram is calculated and the specific fuel consumption and power output are calculated for the engine with RPM = 1500 and with fuel consumption of 20 micro grams of fuel (per 1 stroke cycle)