Week 6 - Data analysis
Aim:
- To create a data visualiser program for the given engine data which provides any 2 relavent parameter values when requested by user
- To create a file compatibilty check
- Plot the P-V diagram using the values in the given data and calcualte area under the curve.
- Calculate output power of the engine for RPM=1500
- Calculate specific fuel consumption when engine consumes 20 micro grams of fuel (per 1 stroke cycle).
Equations used :
Output power of the Engine(KW)=(area under P-V curve)*N/60
N=speed of Engine=1500RPM
specific fuel consumption(sfc)(KG/KW.hr)=mass of fuel consumed/output power
mass of fuel consumed=20micrograms
Procedure:
- The code written is given below:
import numpy as np
import matplotlib.pyplot as plt
import math
from scipy.integrate import simps
try:
    data=open("engine_data.out")
except FileNotfoundError:
    print("the file is not recognised,please provide a valid file")
#stating the reference for giving input
parameters=['Crank-angle','Pressure','Max Pressure','MinPressure','MeanTemparature','MaximumTemparature','MinimumTemparatue','Volume','Mass','Density','IntegratedHeatRejection','HeatRejection Rate','Cp','Cv','Gamma','KinematicViscosity','DynamicViscosity']
print('parameters present in the given data:')
print(parameters)
corresponding_num=['Crankangle=0','Pressure=1','Maximum Pressure=2','MinimumPressure=3','MeanTemparature=4','MaximumTemparature=6','MinimumTemparatue=5','Volume=7','Mass=8','Density=9','IntegratedHeatRejection=10','HeatRejection Rate=11','Cp=12','Cv=13','Gamma=14','KinematicViscosity=15','DynamicViscosity=16']
print('corresponding values to be given as input')
print(corresponding_num)
#asking relevant input from the user
first_column=input("please enter the first parameter value:")
second_column=input("please enter the second parameter value:")
column_1=int(first_column)
column_2=int(second_column)
column1_val=[]
column2_val=[]
count=1
#extracting the asked data from the file
for line in open('engine_data.out'):
#saving the name of the columns asked
    if count == 3:
        column_name1=line.split()[column_1+1]
        column_name2=line.split()[column_2+1]
#extracting the column values from thefile
    if '#' not in line:
            column1_val.append((float(line.split()[column_1])))
            column2_val.append((float(line.split()[column_2])))
    count=count+1
#plotting the requested parameters
plt.plot(column1_val,column2_val,'r')
plt.xlabel(column_name1)
plt.ylabel(column_name2)
plt.title(column_name1+'VS'+column_name2)

#calculation of area under p-v curve
column_3=1
column_4=7
count=1
column3_val=[]
column4_val=[]
for line in open('engine_data.out'):
    if count == 3:
        column_name3=line.split()[column_3+1]
        column_name4=line.split()[column_4+1]
#extracting the column values from the file
    if '#' not in line:
            column3_val.append((float(line.split()[column_3])))
            column4_val.append((float(line.split()[column_4])))
    count=count+1
#area
area=float(simps(column3_val,column4_val))
plt.figure(2)
plt.plot(column4_val,column3_val)
plt.title(column_name4+'VS'+column_name3)
plt.xlabel(column_name4)
plt.ylabel(column_name3)
plt.savefig('P-V diagram')
print('Area under P-V curve is:')
print(area)
#calculation of output power and specific fuel consumption
#inputs
#speed
N=1500/60
#fuel consumed in micro grams
f_c=20*pow(10,-6)
#output power in kilo watts
Op=float(area*N)
print('output power of engine is:')
print(Op)
#specific fuel consumption in kilograms/kw.hr
sfc=(f_c/Op)
print('specific fuel consumption is:')
print(sfc)
- In this code first of all we checked file compatibility using try and except in python.This one execute a block of code.It tries to open the file and checks fopr given compatibility check and returns if it is error.
- Next,the data visualisation code starts.Here we first mentioned the pararmeters present in the dataset and provided an integer value which should be given as input by the user inorder to access the correspondnig parameter column in the given data set.
- Then 2variables are declared which takes inputs given by the user as integer values.
- Then using for loop we open the file and read the data line by line.By using the line split command,we split the columns by reffering to the given input values by the user and then store them seperately in 2 arrays.
- And also we store the names of the columns requested by the user so that it can be used for labelling.
sample output:
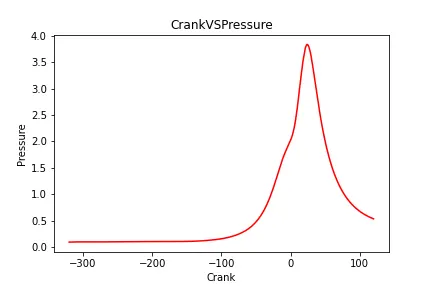
Note:user inputs are 0 and 1.These are column values of crank angle and pressure.The plot obtained between Crank angle VS pressure is given below:
- Next we find out area under the P-V curve.For this we use simps module form scipy library.It evaluates the area under the curve using simpsons rule.
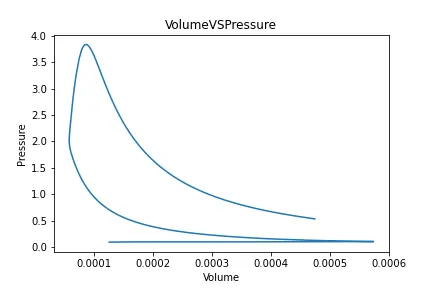
- For this we need to extract the values from the pressure and volueme columns and plot a graph between them.
- And also store the values in 2 arrays and by using simpsons rule the area under the P-Vcurve is evaluated.
The area under pv curve obtained is:0.0005005864474262364
The P-V curve plotted is given below:
- For calculation of output power we need the speed of engine value.So we declared a variable for that and given the value .By using the formula ,we calculated the output power of engine.
The output power obtained is:0.012514661185655909(KW)
- Similarily using the above formula we calculate the specific fuel consumption of the engine using formula mentioned above.
The specific fuel consumption obtained is: 0.0015981255667491547(kg/kw.hr)
Conclusion:
- Thus a data visualiser code is written.
- Area under the P-V diagram,power output of this engine,specific fuel consumption is calcualted using the dataset provided.