Week 6 - Data analysis
Objective(s):
Data Analysis of the given engine data file using Python.
Theory:
Thermodynamic data of a fuel injection engine is extracted and stored into a file with a .out extension and is used to plot plots between various parameters based on user's choice.
Formulas used:
Area under the P-V curve= Work done.
Power output= A*n*1000000 Watts
where n is the number of cycless per second,
n= N/120 for four stroke engine and n=N/60 for two stroke engine,N=Rotations per minute
SFC(Specific fuel consumption)= (Fuel consumed in kg/hr)/(Power output in kW)
Python Program:
# data analysis of engine data

import matplotlib.pyplot as plt
from scipy.integrate import simps

line_count=1


try:
	file=open('engine_data.out')
	print('File opened successfully\n')
except:
	print('File not found!')

print('Parameters are: 1)Crank degrees 2)Pressure 3)Maximum Pressure 4)Minimum Pressure 5) Mean Temparature 6)Maximum Temparature 7)Minimum Temparature 8)Volume 9)Mass 10)Density 11)integrated_HR 12)HR_Rate 13)Cp 14)Cv 15)Gamma 16)Kinematic Viscosity 17)Dynamic Viscosity')
first_col=input('Enter Ist column to plot (1-17):')
second_col=input('Enter 2nd column to plot (1-17):\n')
first_col=int(first_col)
second_col=int(second_col)
first_col_values=[]
second_col_values=[]

for line in open('engine_data.out'):
	if line_count == 3:
		first_col_name=line.split()[first_col]
		second_col_name=line.split()[second_col]
	if '#' not in line:
		first_col_values.append(float(line.split()[first_col-1]))
		second_col_values.append(float(line.split()[second_col-1]))
	line_count=line_count+1

#Work done= Area under the curve
area=float(simps(first_col_values,second_col_values))
print('area:{}\n'.format(area))

rpm=1500 #given value
speed= rpm/60
power= area*speed
print('power:{}\n'.format(power))

mf= 20*pow(10,-6)
sfc=mf/power
print('SFC:{}\n'.format(sfc))

#Plotting using matplotlib
plt.plot(second_col_values,first_col_values)
plt.xlabel(first_col_name)
plt.ylabel(second_col_name)
print(' {} vs {}'.format(first_col_name,second_col_name))
plt.show()
Explanation of the code:
First I imported matplotlib and scipy.integrate library for plotting and integrating of the values. Then using try and except block I have checked the compatibility of the data file to see if it runs,opens and exits properly.
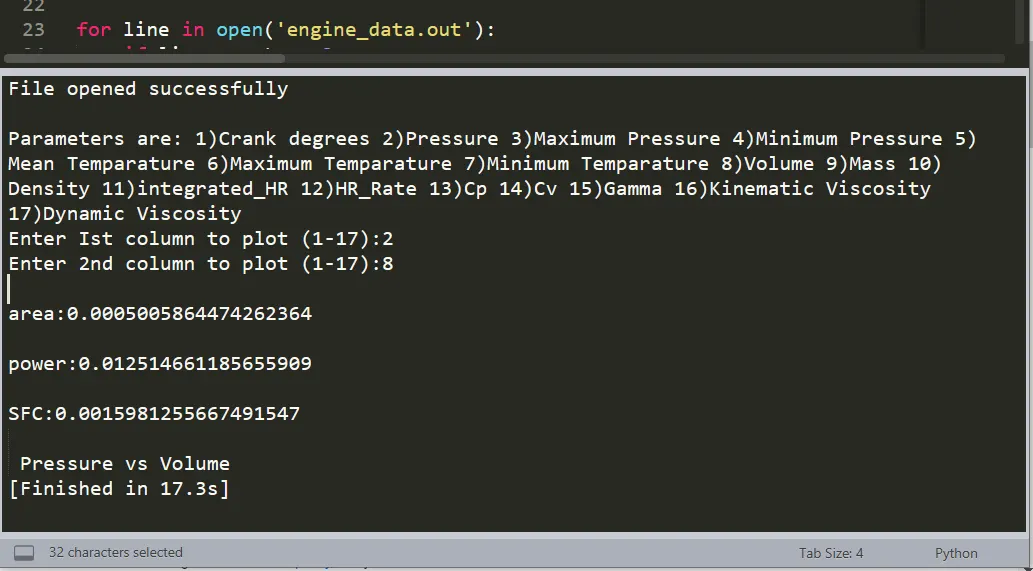
Then using a print statement I have displayed all the paramters avaliable in the data file from which user can select and make choices. The program then takes input from the user to plot the graph and calculate the values.
The names of axes are added automatically and not manually. Then the file is parsed through and it is read by the for loop. Area , power and SFC is then calculated and printed out.
The last part of the code contains the plotting of graphs between the user selected choices of parameters. Using the plt.show() command the graph is then displayed to the output.
Result:
- Compatibility check/Output
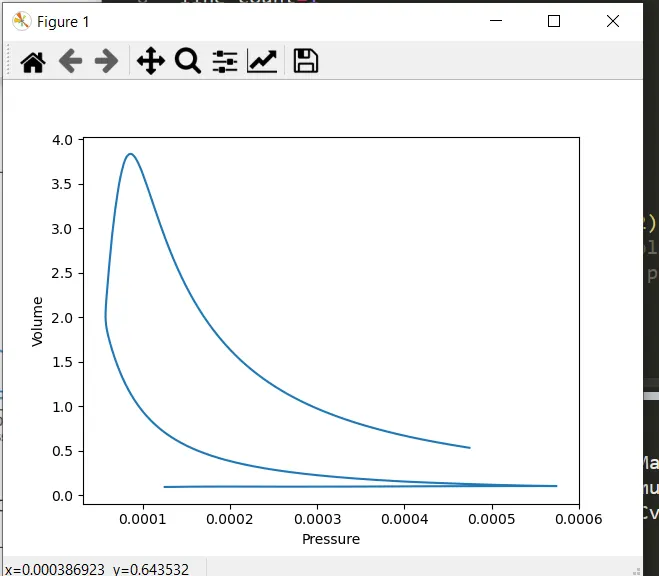
- Pressure Vs Volume
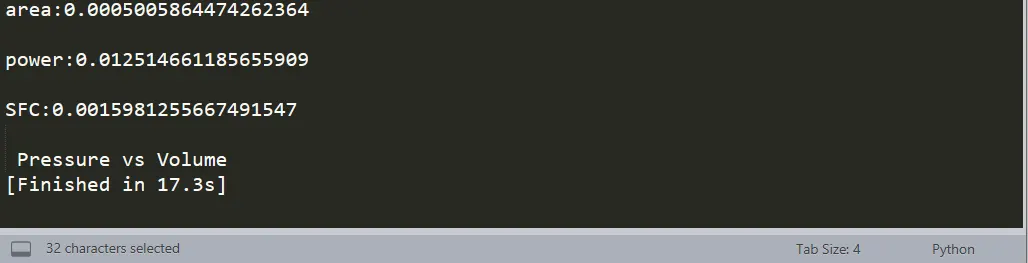
- Area,Power and SFC
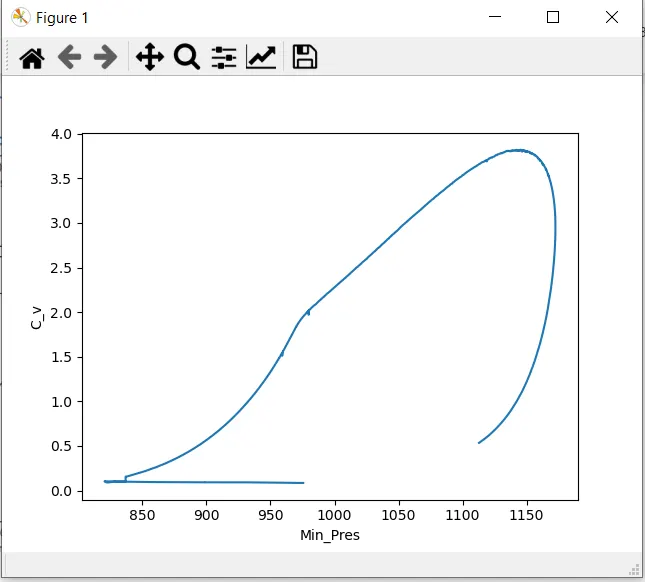
- Minimum Pressure Vs Cv
- Mean Temparature Vs Maximum Pressure
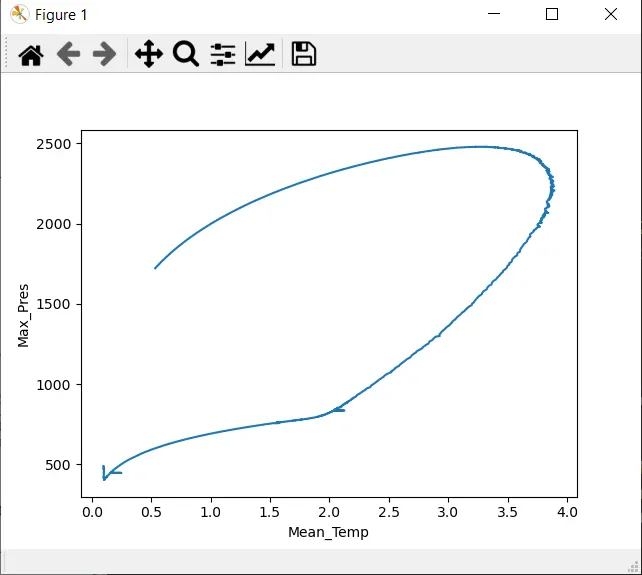
Conclusion: The following were obtained as a result
- Graphs between the user selected choices of parameters
- Area, power and SFC for engine with given parameters.
- Execution time: 17.3 s