Week 6 - Data analysis
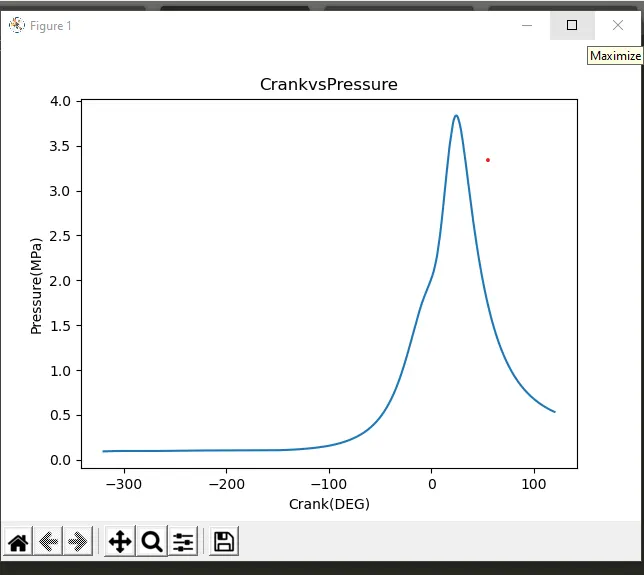
Q1) write a code for user input graph
Q2) compatibility check of the file which going to be read
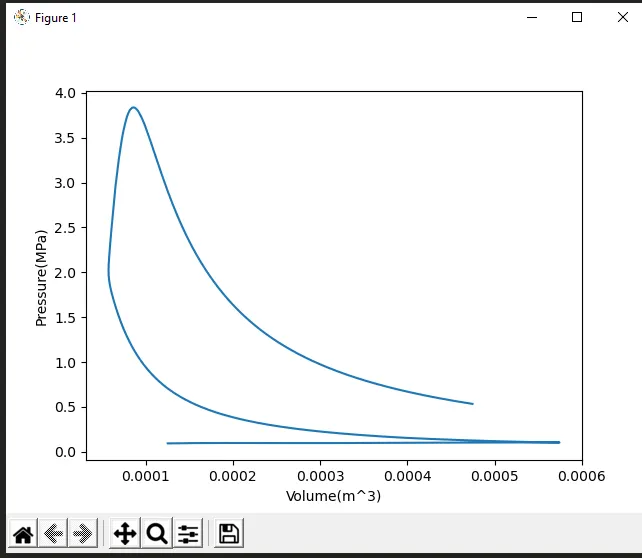
Q3) Calculate the area under the P-V diagram. P is in column 2 and V is in column 8
Q4) Calculate the power output of this engine. Assume that RPM is 1500
Q5) This engine consumed 20 micro grams of fuel (per 1 stroke cycle). Calculate its specific fuel
consumption.
Theory
To integrate the curve trapezoidal rule is used, basically it divide the whole curve into small parts and then finely add them all. It gives some error but it is very small ,here we are using approximation of curve area.
Here we consider two stroke engine, hence in every revolution I will be getting the one power stroke.
N=RPM
n=1, Two stroke engine
n=2, Four stroke engine
k=no. of cylinder
Indicated Power= work done(area under curve)*2*Ꙥ*(N/(n*60)*k)
Let us suppose no friction is exist
Break Power(BP)= Indicated Power(kW)
Break specific fuel consumption(bsfc)(kg/kWh), for every revolution only in one stroke fuel is injected, hence rpm is divided by 2 in order to get the stroke per min.
mass of fuel(kg/h)=mass of fuel(kg/stroke)*(1500/2)(stroke/min)*(60/60)=9*10^-4
Bsfc= mass of fuel(kg/h)/BP(kW)
import math
import matplotlib.pyplot as plt
import numpy as np


# check the compatbility of file
try:
	file=open('engine_data.out')
	print("FILE IS COMPATIBLE")
except:
	print("File not recognized. Please provide a valid CONVERGE output file")

# plot the graph between 1 to 17 column

a=input('Enter the column no. ie x axis')
b=input('Enter the column no. is y axis')

A=int(a)
x=A-1
B=int(b)
y=B-1
c=[]
d=[]
ct=0
column_title=[]
column_unit=[]
for line in open('engine_data.out'):
	#print(line.split())

	if '#' not in line:
		c.append(float(line.split()[x]))
		d.append(float(line.split()[y]))
	if '#' in line:
		ct=ct+1
		if ct==3:
			line_content=line.split()
			#print(line_content)

			for i in range (1,np.size(line_content)):
				column_title.append((line_content[i]))
		elif ct==4:
			line_content=line.split()
			#print(line_content)
			for j in range(1,np.size(line_content)):
				column_unit.append((line_content[j]))
#print(column_title)
#print(column_unit)
plt.plot(c,d)
plt.xlabel(column_title[x]+column_unit[x])
plt.ylabel(column_title[y]+column_unit[y])
plt.title(column_title[x] + 'vs' + column_title[y])
#plt.savefig(column_title[x]+ 'vs' +column_title[y]+'.png')

plt.show()

# Calculate the area under the P-V diagram. P is in column 2 and V is in column 8.
k=[]
z=[]
for line in open('engine_data.out'):
	if '#' not in line:
		k.append(float(line.split()[7]))
		z.append(float(line.split()[1]))
plt.plot(k,z)
plt.xlabel('Volume(m^3)')
plt.ylabel('Pressure(MPa)')
#plt.savefig('plot2.png')

plt.show()

AR=(np.trapz(z,k))*1000
print('Area under PV curve in kJ=',AR)
BO=(AR*2*math.pi*(1500/60))  # let us suppose two stroke engine and break power
print('brake power output of the engine in kW=',BO)
# Indiacted specific fuel consumption and m_f(kg/h)
m_f=9e-4 #
bsfc=m_f/BO
print("Break specific fuel consumption in kg/kWh=",bsfc)
Procedure
1) try and except statement is used, as soon try statement get failed then reamaning statement which comes under the try statement won't run. It jump to except statment otherwise not.
2) input function is used to ask the input from the user(column number for x axis and y axis)
3) user input is always string which is converted into the integer with help of int function.
4) for loop with varible line is used to read the desired data file.
5) Then we differentiate between those line which contaning # and not.
6) if,elif conditional statement is used to seprate the approiate data(column name and unit), split function create these data into "list ", then with help of for loop it append the all list(line_content) value into column unit and column _title into empty array. Here for loop applied in a such way that it doesnt take list first value ie #, because here we defined the index value(variable of for loop) starting from 1 to number of elements in the line_content.
7) Graph are plotted with help of matplotlib.pyplot module, here we defined the index of list(column_unit and column_title) so that it facilitate the x and y axis label.
8) now again we append the value of coulmn no.2 and 8, so that these value will use to find the area under the PV plot, this is possible because of numpy module and its function is trapz.
9) breake power and break specific fuel consumption is find, with approiate unit conversion.
Here we consider the 2 stroke engine

Result
It is evident from the bsfc, it is very economical engine.